
AI Statistical Test Selector: Choose the Right Test
Use this AI Statistical Test Selector to identify the right statistical method for your research question, data type, group structure, and assumptions. Compare t-tests, ANOVA, correlation, regression, chi-square, and non-parametric alternatives while learning how to verify, interpret, and report the recommended test accurately.
AI Statistical Test Selector: Find the Right Test for Your Data
An AI Statistical Test Selector recommends a suitable statistical method by evaluating the research goal, outcome type, groups or predictors, observation structure, and assumptions. It can narrow the options quickly, but the final choice must still match how the study was designed and how the data were collected.
The most useful selector does more than name a test. It explains why the method fits, identifies checks that remain, suggests reasonable alternatives, and warns when a simple flowchart is not enough.
What Is an AI Statistical Test Selector?
An AI Statistical Test Selector is a guided decision tool that recommends a statistical test or model from the research goal, outcome type, number of groups, observation structure, and relevant assumptions. It is most useful when it shows its reasoning instead of returning a test name without context.
A traditional flowchart follows fixed branches. An AI-assisted selector can also interpret a plain-language description, ask for missing details, and explain why one method fits better than another. That flexibility is valuable, but it creates a practical dependency: vague or incorrect input can lead to a confident but unsuitable answer.
The right statistical test depends first on the scientific question and study design, then on the variable types and assumptions. Normality alone should never control the entire decision.
How It Differs From a Traditional Statistical Flowchart
A static statistical test decision tree usually asks whether the data are numerical or categorical, how many groups are involved, whether observations are paired, and whether the data are normal. An AI selector can go further by distinguishing a single Likert item from a composite score, identifying count or time-to-event outcomes, and recognizing when repeated or clustered observations require a model rather than a simple test.
The safer design combines a deterministic decision matrix with a generative explanation. The rules constrain the recommendation, while the language model explains the choice in terms the user can understand. The system should also be able to say that the available information is insufficient.
Who Can Benefit From This Tool?
Students and thesis writers can use the selector to connect a research question with a defensible method. Academic and healthcare researchers can use it as an initial check before finalizing an analysis plan. Business analysts can distinguish methods for revenue, conversion, retention, counts, and customer categories. Data scientists may use it as a screening aid, although complex prediction, longitudinal analysis, and causal inference usually require a fuller modeling workflow.
Which Statistical Test Should You Use?
Start with five decisions: what you want to learn, what the outcome represents, how many groups or predictors are involved, how the observations are related, and whether the proposed method has reasonable assumptions. The first four decisions identify the likely test family. The last determines the exact version, a robust alternative, or the need for a more advanced model.
| Research goal | Outcome type | Groups or variables | Recommended method | Possible alternative |
|---|---|---|---|---|
| Compare two separate groups | Continuous | Two independent groups | Welch or independent-samples t-test | Mann-Whitney U, permutation, or robust method |
| Compare two related measurements | Continuous | Two paired measurements | Paired-samples t-test | Wilcoxon signed-rank test |
| Compare three or more separate groups | Continuous | Three or more independent groups | One-way or Welch ANOVA | Kruskal-Wallis test |
| Compare repeated measurements | Continuous or ordinal | Three or more related conditions | Repeated-measures ANOVA or mixed model | Friedman test |
| Test association | Categorical counts | Two categorical variables | Chi-square test of independence | Fisher exact or another exact method |
| Measure association | Two numerical or ordered variables | Two variables | Pearson correlation | Spearman rank correlation |
| Predict a continuous value | Continuous | One or more predictors | Linear regression | Robust, nonlinear, or generalized model |
| Predict a yes/no outcome | Binary | One or more predictors | Logistic regression | Penalized or exact logistic model |
This quick-reference matrix covers common research scenarios, but it cannot show every dependency. Two columns of scores may represent different students, the same students measured twice, or students nested within classrooms. Those designs require different error structures even when the recorded values look identical.
How the AI Statistical Test Selector Works
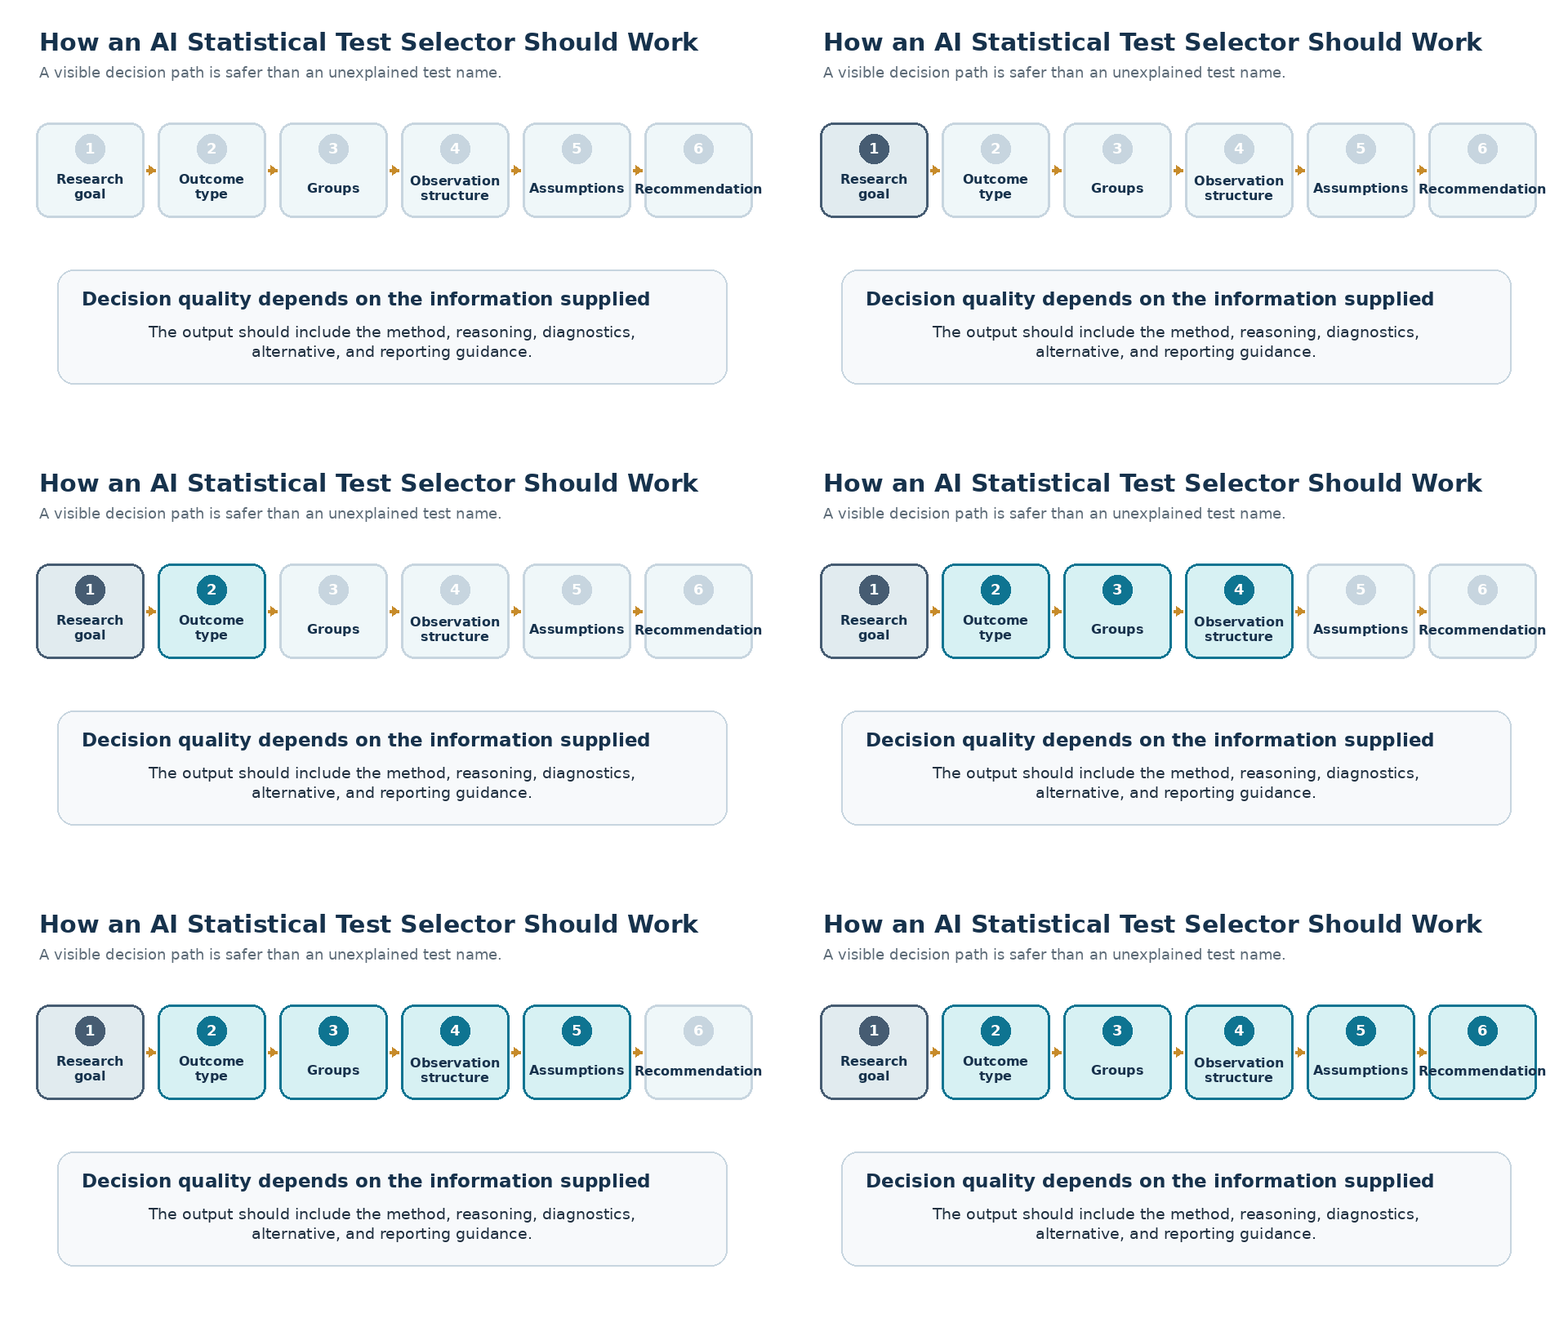
Identify the Research Goal
The research goal should be stated before opening a statistics menu. A comparison question asks whether outcomes differ between conditions or populations. An association question examines whether categorical variables are related. A correlation question summarizes how two ordered or numerical variables move together. A prediction question estimates an outcome from one or more predictors.
A useful selector also asks what quantity matters. The user may want a difference in means, a difference in ordered distributions, an odds ratio, a rate ratio, a change over time, or a prediction. These targets are not interchangeable.
Identify the Outcome Variable Type
A continuous outcome can take many numerical values, such as blood pressure or examination score. An ordinal outcome has ordered categories without guaranteed equal spacing, such as one five-point satisfaction item. A binary outcome has two states, such as pass or fail. A count outcome records event frequency, while a time-to-event outcome records how long it takes for an event to occur and may include censoring.
The values 1, 2, 3, 4, and 5 do not reveal the data type by themselves. They may be genuine counts, ordered ratings, or codes for unrelated categories. The selector must ask what the values mean.
Count the Groups, Conditions, and Predictors
One group may be compared with a reference value. Two groups may be independent or paired. Three or more groups may involve one factor, several factors, or repeated conditions. Regression may include one predictor or several predictors used to adjust for baseline values or potential confounding.
Determine Whether Observations Are Independent, Paired, Repeated, or Clustered
Independent groups contain different observational units. Paired observations come from the same unit twice or from deliberately matched units. Repeated observations contain more than two records from the same unit. Clustered data arise when observations share a higher-level source, such as students within classrooms or patients within hospitals.
This step often matters more than the normality decision. Treating dependent observations as independent can produce standard errors and confidence intervals that are too optimistic.
Check the Relevant Assumptions
For classical regression and ANOVA, NIST describes the assumptions in terms of model errors or residuals: they should be independent, centered around zero, have reasonably constant variance, and follow the distribution required by the procedure. The assumption is therefore not that every raw column must form a perfect bell curve. (NIST/SEMATECH Engineering Statistics Handbook)
Receive a Recommendation, Alternative, and Reporting Plan
A strong output identifies the method, states why it fits, separates known design facts from diagnostics that still need checking, and describes what to report. It may recommend Welch's t-test for two independent groups with unequal variances, then request an outlier review and a confidence interval for the mean difference. It should also flag clustering, major covariates, missing data, or other conditions that could change the model.
Statistical Test Decision Flowchart
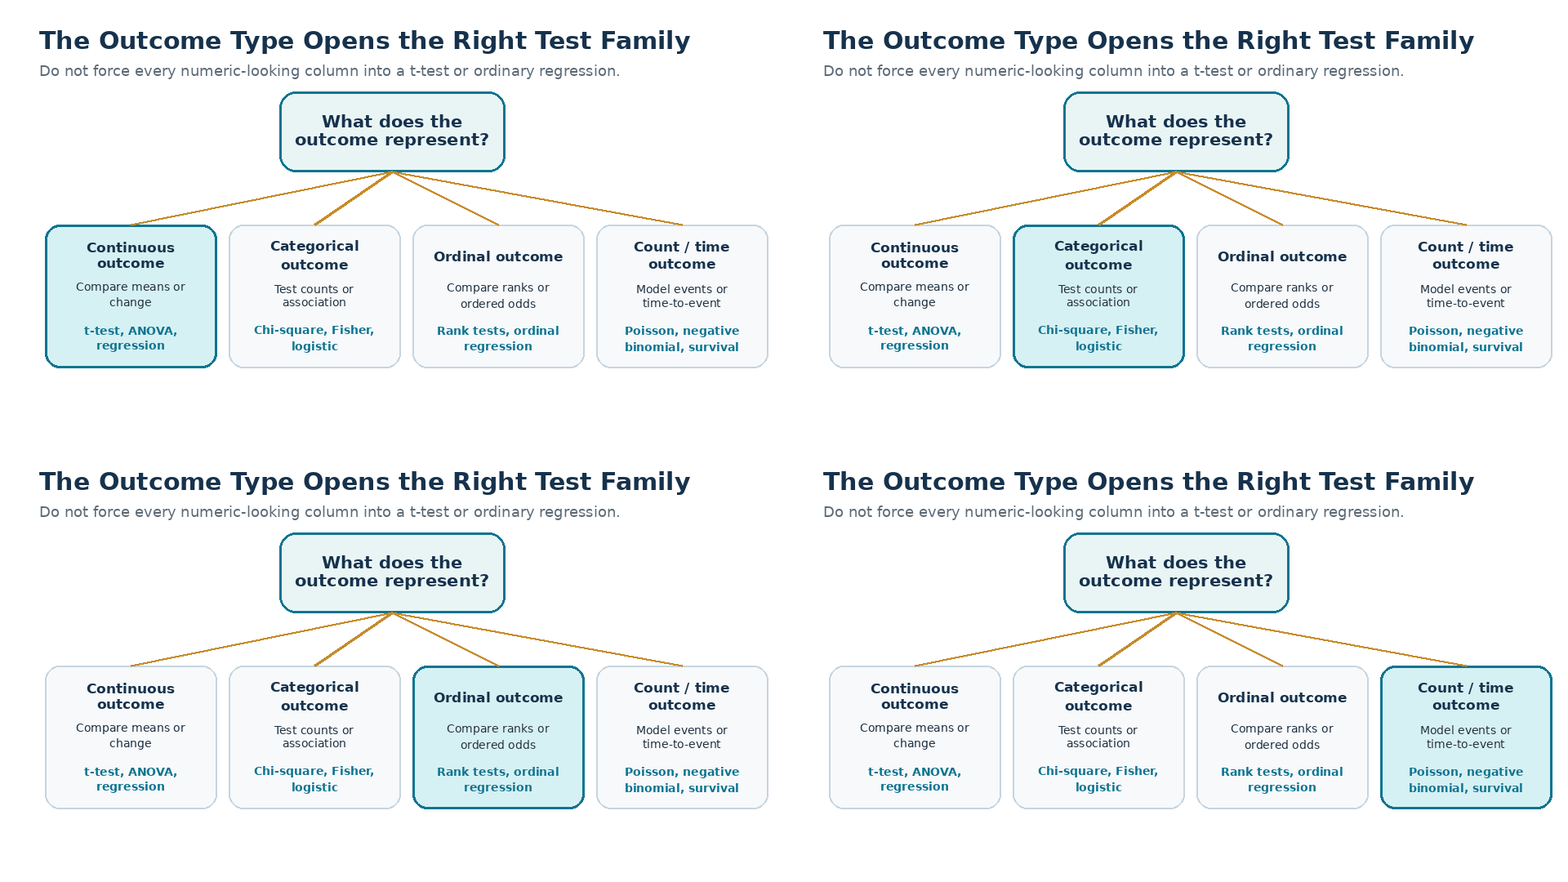
Start With the Outcome, Not the Spreadsheet Format
Continuous outcomes lead toward mean comparisons, correlation, ANOVA, or linear models. Categorical counts lead toward chi-square, exact procedures, proportion methods, or categorical regression. Ordinal outcomes may require rank-based procedures or ordinal regression. Counts may need Poisson or negative binomial regression. Time-to-event outcomes generally require survival methods.
Decision Path for Comparing Groups
For one sample compared with a reference, consider a one-sample t-test or a suitable robust or permutation alternative. For two independent groups, consider Welch or the classical independent t-test. For two related measurements, consider a paired t-test. With three or more independent groups, consider one-way or Welch ANOVA. With repeated conditions, consider repeated-measures ANOVA, Friedman, or a mixed-effects model.
Decision Path for Categorical Association
A chi-square test of independence is common when each observation contributes to one cell and the approximation is suitable. Fisher's exact test is a standard exact option for small contingency tables. Paired binary responses require a paired categorical procedure such as McNemar's test rather than an ordinary chi-square test of independence. SciPy's official contingency-table documentation distinguishes chi-square and exact procedures and provides resampling options in current versions. (SciPy documentation)
Decision Path for Correlation and Prediction
Pearson correlation describes linear association between numerical variables. Spearman correlation describes monotonic rank association and is often useful for ordinal data. Linear regression models a continuous outcome, while logistic regression models a binary outcome. Count, ordinal, survival, repeated, and clustered outcomes require corresponding model families rather than being forced into ordinary regression.
| If the situation is... | Start with... | Check before deciding |
|---|---|---|
| One numerical sample versus a reference | One-sample t-test | Outliers, independence, target estimand |
| Two independent numerical groups | Welch t-test | Observation independence, extreme values, mean as target |
| Two paired numerical measurements | Paired t-test | Correct pairing and distribution of differences |
| Three or more independent numerical groups | One-way or Welch ANOVA | Variance structure and post-hoc plan |
| Three or more repeated measurements | Repeated-measures ANOVA or mixed model | Within-unit dependence, missing follow-up, covariance structure |
| Two independent categorical variables | Chi-square independence test | Expected counts and sampling design |
| Small 2 by 2 contingency table | Fisher exact test | Study design and intended effect measure |
| Two numerical variables with a linear pattern | Pearson correlation | Scatterplot, outliers, subgroup structure |
| Binary outcome with predictors | Logistic regression | Model specification, sparse events, validation |
Statistical Test Comparison Table
| Statistical method | Research purpose | Required data | Main assumptions or dependencies | Example |
|---|---|---|---|---|
| One-sample t-test | Compare a mean with a reference | One continuous sample | Independent observations and suitable sampling behavior | Is mean package weight different from 500 g? |
| Welch t-test | Compare two independent means | Continuous outcome, two groups | Independent units; does not assume equal variances | Scores in two classes with different variability |
| Paired t-test | Estimate mean within-pair change | Continuous paired differences | Correct pairing; suitable distribution of differences | Blood pressure before and after treatment |
| One-way ANOVA | Compare means across groups | Continuous outcome, three or more groups | Independent errors and suitable residual behavior | Scores under three teaching methods |
| Repeated-measures ANOVA | Compare repeated means | Continuous repeated outcome | Within-unit dependence and covariance assumptions | Symptoms at three visits |
| Mann-Whitney U | Compare ordered distributions or ranks | Ordinal or numerical outcome, two independent groups | Independent units; interpretation depends on distribution shapes | Pain ratings under two treatments |
| Wilcoxon signed-rank | Compare paired ranks | Ordinal or numerical paired outcome | Paired observations and appropriate difference structure | Anxiety ratings before and after therapy |
| Kruskal-Wallis | Compare ranks across groups | Ordinal or numerical outcome, three or more groups | Independent units and appropriate interpretation | Satisfaction across departments |
| Chi-square independence | Test categorical association | Frequency counts in a contingency table | Independent counts and adequate approximation | Department and work preference |
| Fisher exact | Exact categorical association test | Small contingency table | Fixed-margin exact formulation in the conventional test | Response in a small treatment study |
| Pearson correlation | Measure linear association | Two numerical variables | Linear pattern and no dominating outliers | Study hours and exam score |
| Spearman correlation | Measure monotonic rank association | Ordinal or numerical variables | Monotonic relationship | Class rank and salary rank |
| Linear regression | Model a continuous outcome | Continuous outcome plus predictors | Appropriate functional form, residual behavior, independence | Predict salary from experience |
| Logistic regression | Model a binary outcome | Binary outcome plus predictors | Appropriate specification and enough outcome information | Predict pass or fail |
Parametric vs Non-Parametric Tests
What Parametric and Non-Parametric Mean
A parametric method uses a model described by parameters. t-tests, ANOVA, Pearson correlation, and linear regression estimate quantities such as mean differences and regression coefficients. A non-parametric method usually relies less on a specific distributional form; many familiar examples replace the original values with ranks.
The labels do not mean that parametric tests are always risky and non-parametric tests are assumption-free. Rank tests still depend on the observation structure and on the interpretation of their null hypothesis.
| Research situation | Parametric method | Common non-parametric alternative |
|---|---|---|
| Two independent groups | Welch or independent t-test | Mann-Whitney U |
| Two paired measurements | Paired t-test | Wilcoxon signed-rank |
| Three or more independent groups | One-way or Welch ANOVA | Kruskal-Wallis |
| Three or more repeated measurements | Repeated-measures ANOVA | Friedman |
| Relationship between two variables | Pearson correlation | Spearman correlation |
Why Non-Normal Data Does Not Automatically Mean a Rank Test
The conventional rule that non-normal data always require a non-parametric test is incomplete. The relevant issue may be the distribution of paired differences or model residuals rather than the raw scores. The consequences of skewness also depend on sample balance, tail behavior, outliers, variance differences, and the quantity being estimated.
A rank-based test may answer a different question from a mean comparison. A transformation, Welch method, robust estimator, generalized model, permutation procedure, or bootstrap confidence interval may preserve the research target more directly.
Reality check
The best method is not the one with the fewest assumptions on paper. It is the method whose assumptions, estimand, and observation structure fit the real study well enough to support the intended conclusion.
Statistical Assumptions You Must Check
Independence and Observation Structure
Independence is mainly a design property. Measurements from the same participant, customer, school, hospital, household, or specimen are connected. No normality test can repair an analysis that ignores those connections.
Normality of Differences or Residuals
For a paired t-test, the relevant distribution is normally the within-pair difference. For ANOVA and regression, diagnostics focus on errors or residuals under the model. This distinction prevents the common mistake of testing every raw group separately and treating the result as an automatic method selector.
Equality of Variances
Classical pooled-variance procedures assume a common variance. Levene's test is one formal check, but a non-significant result does not prove exact equality. Visual diagnostics, group sizes, scientific context, and the availability of Welch procedures should also influence the choice. (NIST/SEMATECH Levene Test guidance)
Linearity and Model Form
Pearson correlation and ordinary linear regression summarize linear patterns. A scatterplot may reveal curvature, thresholds, saturation, or subgroups. A near-zero Pearson coefficient can coexist with a strong nonlinear relationship.
Outliers and Influential Observations
An unusual value may be an error, a valid extreme case, or evidence that the proposed model is inadequate. Removing it only because it changes significance is not defensible. Verify the record, document any exclusion, and compare results with and without influential observations when appropriate.
Expected Cell Frequencies
Chi-square methods rely on an approximation whose quality is related to the expected frequencies and table structure. The familiar threshold of five is a guideline rather than a universal law. When the approximation is questionable, exact or resampling methods may be preferable. (SciPy contingency-table documentation)
Multicollinearity and Model-Specific Assumptions
Regression predictors that contain heavily overlapping information can make individual coefficients unstable. Other models introduce their own requirements: ordinal regression may use a proportional-odds assumption, count models require a defensible mean-variance relationship, and Cox regression requires a proportional-hazards assessment. An AI selector should either evaluate these conditions or mark them as unresolved.
How to Check Normality Before Choosing a Test
Use the Shapiro-Wilk Test as One Diagnostic
The Shapiro-Wilk test evaluates whether a sample is compatible with a normal distribution under its null hypothesis. The official R documentation describes the test and its input limits. It does not say that the result should independently choose the final statistical procedure. (R documentation)
Read a Q-Q Plot and Distribution Plot
A Q-Q plot compares observed quantiles with those expected under a reference distribution. Systematic curvature can indicate skewness or tail differences, while isolated departures can reveal unusual observations. A histogram or density plot can expose multiple peaks, floor effects, ceiling effects, and gaps, although its appearance depends on plotting choices.
Interpret Sample Size Carefully
Small samples provide limited information about distribution shape. Very large samples can make formal tests sensitive to minor departures. Sample size also affects precision, power, model stability, and the quality of asymptotic approximations, but there is no universal sample-size threshold that makes every parametric method automatically valid.
Do Not Rely on One Normality P-Value
Combine the design, plots, residual diagnostics, outlier assessment, variance structure, sample information, and the scientific estimand. Normality is one part of model evaluation, not the master switch for statistical test selection.
Common Research Scenarios and Recommended Tests
Two Independent Groups
When two groups contain different participants and the outcome is continuous, a Welch t-test is often a practical starting point for a mean comparison because it does not require equal variances. Mann-Whitney U may be appropriate for an ordinal or rank-focused comparison, but it should not automatically be described as a median test.
The Same Participants Before and After Treatment
The observations are paired, so the analysis should use each participant's change. A paired t-test estimates the mean change. Wilcoxon signed-rank provides a rank-based paired analysis when its assumptions and interpretation fit.
Three or More Independent Groups
One-way ANOVA compares means across independent groups. Welch ANOVA is useful when group variances are not reasonably equal. Kruskal-Wallis is a rank-based alternative. A significant overall result does not identify every differing pair, so planned contrasts or suitable post-hoc comparisons are normally required.
Three or More Repeated Measurements
Repeated-measures ANOVA may fit complete and regularly measured data under its assumptions. Friedman provides a rank-based repeated comparison. A mixed-effects model is often more realistic when follow-up is incomplete, observation times differ, or the data contain additional levels of clustering.
Categorical Association and Small Tables
Use a chi-square test for independent categorical counts when the approximation is suitable. Use an exact method when sparse counts make that approximation doubtful. Use McNemar's test when binary observations are paired.
Ordinal and Likert-Scale Outcomes
A single Likert item is ordinal. A composite score created from several validated items may sometimes be treated as approximately continuous when its construction and use are justified. The phrase “Likert data” is therefore not enough to determine the test.
Worked Examples of Statistical Test Selection
Exam Scores in Two Classes
Class A and Class B contain different students, and the outcome is a numerical score. The question is whether the mean scores differ. A Welch independent-samples t-test is a reasonable starting point. A rank-based or robust method may be considered if the mean is not the right target or extreme values make it unstable.
Blood Pressure Before and After Medication
The same patients are measured twice. The paired t-test estimates the mean within-patient change. Wilcoxon signed-rank may be appropriate for a rank-based paired comparison. An independent t-test would discard the pairing and answer the wrong design question.
Three Teaching Methods With Unequal Variances
Different students receive one of three methods. Welch ANOVA can compare means without imposing a common variance. A conventional one-way ANOVA may still be reasonable in some balanced settings, but the variance issue should not be ignored. A significant result needs planned or adjusted follow-up comparisons.
Gender and Voting Preference
Both variables are categorical, and each participant contributes to one cell. A chi-square test can assess association when expected counts support the approximation. Fisher's exact test is a standard option for a small 2 by 2 table. Neither test establishes that one variable causes the other.
Predicting Pass or Fail
Pass or fail is binary. Logistic regression can estimate the probability or odds of passing from study hours, attendance, and previous grades. The model should report uncertainty and be validated if it will be used for prediction.
Website Conversion Has More Than One Possible Outcome
The same e-commerce experiment can require different models. Order value is continuous, purchase is binary, the number of purchases is a count, and time until purchase is a time-to-event outcome. A selector that asks only how many groups are present will miss these distinctions.
How to Use the AI Statistical Test Selector
Enter one complete research question that names the outcome and the comparison, relationship, or prediction. Then identify what the outcome values represent, not merely how the column is formatted. State the number of groups, conditions, time points, and predictors, and explain whether the records come from different units, the same units, matched units, or clusters.
Report what is known about missingness, outliers, skewness, variance differences, expected counts, and residual behavior. Choose “unknown” rather than guessing. After the recommendation appears, confirm that the selector has interpreted the variables and observation structure correctly.
The final verification should answer four questions: Does the method estimate what the research question asks? Does it represent the dependence among observations? Are the remaining assumptions reasonable? Will the planned report include an effect estimate and uncertainty rather than only a significance label?
What an AI Statistical Test Selector Can and Cannot Do
What the Tool Can Do Well
For a clear, standard design, the tool can shortlist suitable methods, explain the selection logic, identify common assumptions, suggest a robust or non-parametric alternative, and provide a reporting template. It can also reveal missing information by asking whether the same people appear in both groups or whether the outcome is a count rather than a continuous measurement.
What the Tool Cannot Repair
A selector cannot fix a biased sample, invalid measurement, uncontrolled confounding, or a study that cannot support the claimed causal conclusion. It may not detect hidden clustering, informative missingness, or data-entry problems unless those issues are disclosed or found during a deeper analysis.
When a Statistician Is the Better Next Step
Qualified review is especially important for complex sampling, longitudinal or nested observations, substantial missing data, multiple outcomes, rare events, survival data, adaptive decisions, causal inference, or high-stakes clinical, regulatory, financial, and policy conclusions. In those settings, the best AI response may be to request more information rather than force a single test name.
Common Statistical Test Selection Mistakes
| Mistake | Why it fails | Better approach |
|---|---|---|
| Choosing from sample size alone | Sample size does not define the outcome, design, or research goal | Start with the question and observation structure |
| Testing each raw group separately for normality | The relevant assumption may concern differences or residuals | Use model-specific diagnostics and plots |
| Treating paired records as independent | It ignores within-unit dependence | Use paired, repeated, or mixed methods |
| Running many t-tests across several groups | It increases multiplicity and fragments one design | Use an overall model with planned or adjusted comparisons |
| Assuming correlation proves causation | Association may reflect confounding, selection, or reverse direction | Match claims to the study design |
| Ignoring unequal variances | Pooled standard errors may be misleading | Use Welch-type or variance-aware methods |
| Using chi-square with sparse counts | The approximation may be poor | Inspect expected counts and consider exact or resampling methods |
| Selecting the test after seeing the desired result | It increases analytical flexibility and false-positive risk | Specify the primary analysis before inspecting outcomes where possible |
| Reporting only a p-value | It omits magnitude, precision, and practical relevance | Report effect estimates, confidence intervals, diagnostics, and limitations |
How to Interpret and Report Statistical Results
P-Values Are Not Effect Sizes
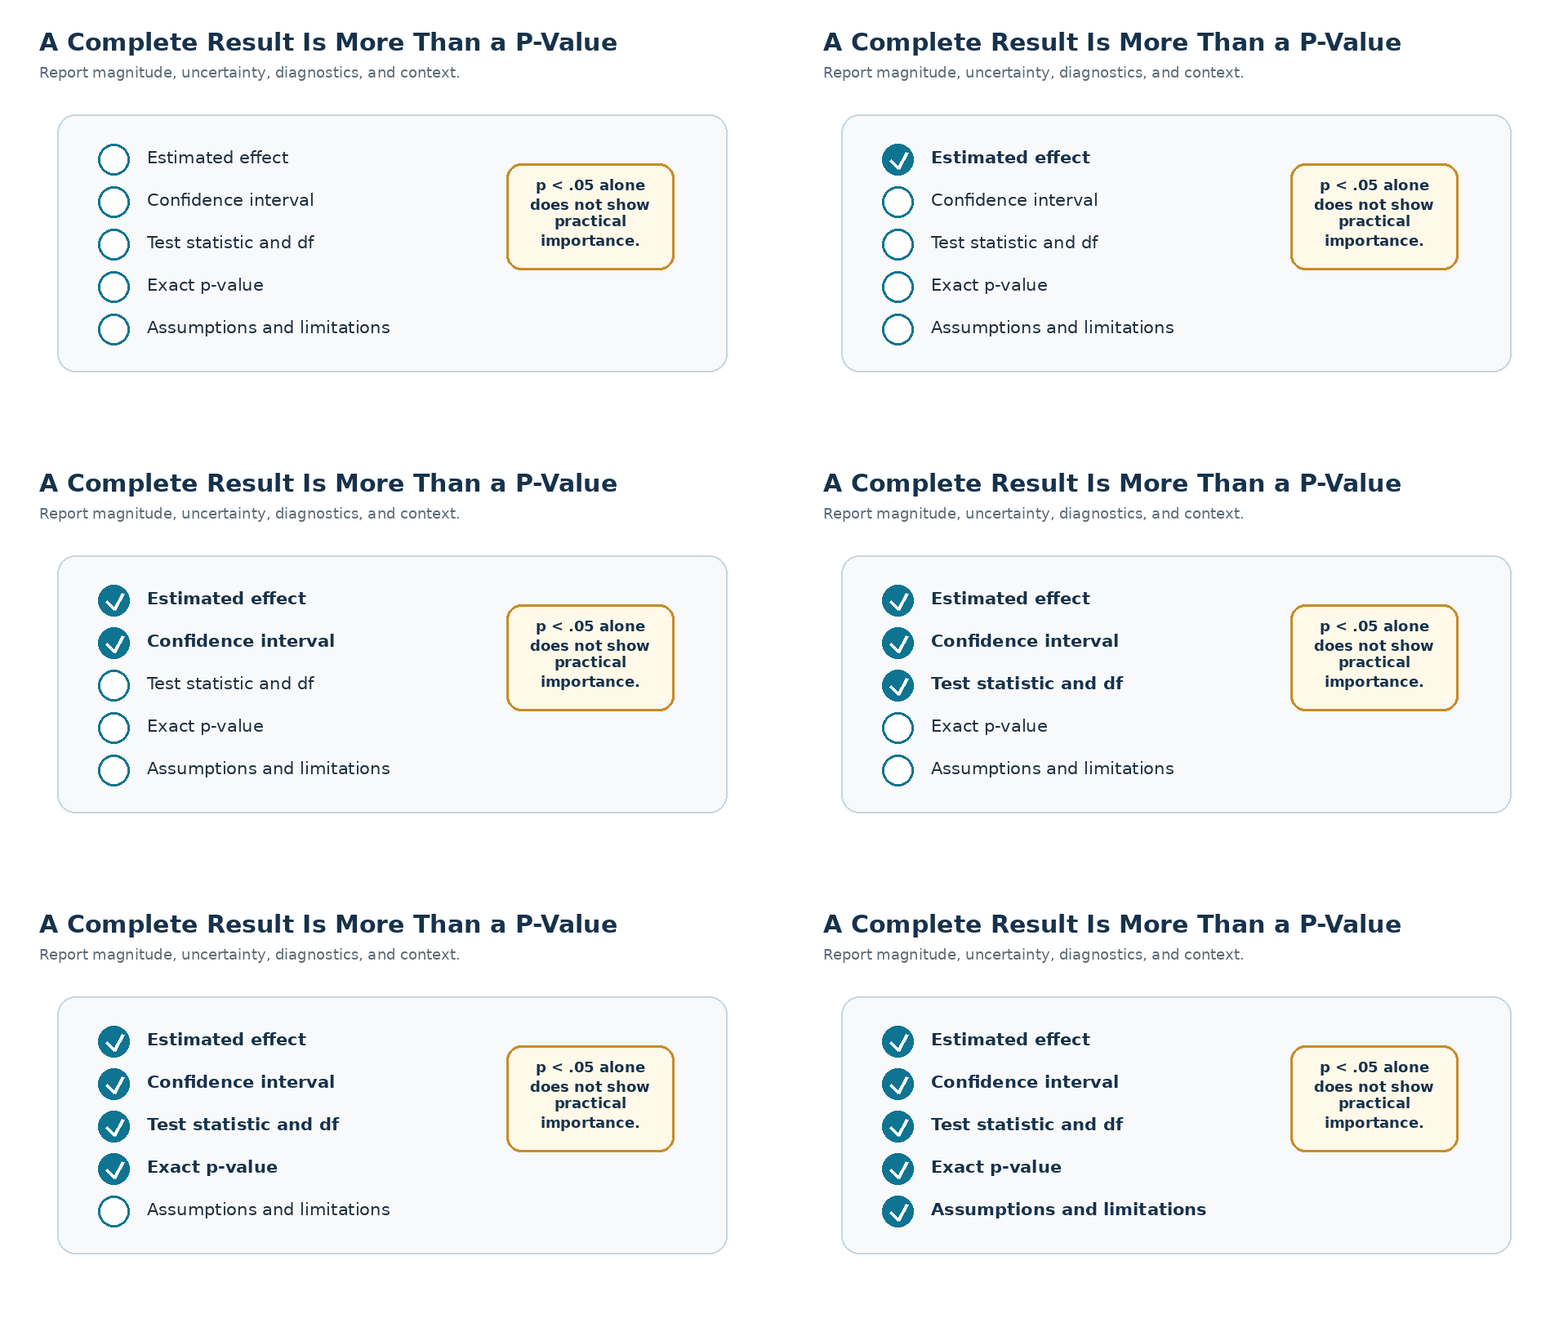
The American Statistical Association states that a p-value does not measure the probability that the research hypothesis is true, does not measure effect size or importance, and should not be the sole basis for scientific or policy conclusions. (American Statistical Association Statement on p-Values)
Report the Estimate and Confidence Interval
The estimate communicates magnitude: a mean difference, correlation, odds ratio, risk difference, rate ratio, or regression coefficient. The confidence interval shows the uncertainty produced by the method and data under the model assumptions.
Include the Test Statistic, Degrees of Freedom, and Diagnostics
A complete report normally gives the test statistic and degrees of freedom when applicable, the exact p-value, the effect size, and relevant assumption checks. After ANOVA, planned contrasts or post-hoc methods should be reported with the adjustment strategy.
Example Reporting Sentence
A concise result might read: “Students using Method A scored an estimated 6.4 points higher than students using Method B, 95% confidence interval 2.1 to 10.7, Welch t(54.8) = 2.98, p = .004.” The report should add an appropriate standardized effect when useful and should not imply that statistical significance proves practical importance.
AI Statistical Test Selector vs General AI Statistics Tools
A purpose-built selector answers a narrow question: which statistical method fits the stated design? General AI analysis tools can also inspect files, write or execute code, create charts, and explain results. That broader scope is useful, but it increases the need to verify that the generated model represents the scientific design.
| Tool type | Best use | Test selection | Data analysis and charts | Main limitation |
|---|---|---|---|---|
| Purpose-built AI Statistical Test Selector | Fast, transparent method recommendation | Core function | Usually limited | Depends on accurate study details |
| ChatGPT data analysis | Flexible analysis of uploaded structured data | Prompt-dependent | Can analyze files and create tables or charts | Scientific design may not be inferable from a spreadsheet |
| Julius AI | Conversational analysis and visualization | Prompt-dependent | Supports uploaded data, analysis, visualizations, and exports | Method choice still requires clear study context |
| XLSTAT AI Assistant | Guidance inside Excel-based statistical workflows | Recommends methods from objectives and data | Integrated with XLSTAT analyses | Capabilities depend on the installed product and edition |
| Traditional software such as R, SPSS, Stata, SAS, jamovi, or JASP | Formal analysis and reproducibility | Usually user-led or menu-guided | Broad statistical functionality | Learning curve and user responsibility remain |
| Statistical consultant | Complex or high-stakes design and inference | Expert-led | Full analysis as required | Cost and access |
OpenAI's current documentation says ChatGPT can analyze uploaded files and create tables or charts, while Julius documents natural-language analysis and visualization of uploaded data. XLSTAT describes an AI assistant that explores data, recommends a statistical method, and interprets results in plain language. These are current product capabilities, not evidence that any tool can automatically infer an undisclosed study design. (OpenAI Help, Julius Documentation, and XLSTAT AI Assistant)
Is an AI Statistical Test Selector Reliable?
When the Recommendation Is Most Dependable
Reliability is highest when the research question is precise, the outcome is classified correctly, the group relationship is known, and the study uses a standard design. The selector should summarize its interpretation before giving the answer so the user can correct any misunderstanding.
When Additional Review Is Necessary
Reliability decreases when the data are clustered, longitudinal, censored, highly incomplete, sparsely distributed, or tied to causal claims. It also decreases when many outcomes or subgroups are tested. These situations may require a model family, sensitivity analysis, or expert review rather than a single familiar test.
How to Verify the Suggested Test
Confirm that the proposed method answers the stated research question, classifies the outcome correctly, represents pairing or clustering, identifies the relevant diagnostics, and produces an effect estimate that can be interpreted. Reproducible code and a saved decision summary make that verification easier.
FAQs
What is the best statistical test for two groups?
Use an independent-group method when the groups contain different units and a paired method when the same or matched units appear in both conditions. For continuous outcomes, the likely choices include Welch or the classical independent t-test, paired t-test, Mann-Whitney U, and Wilcoxon signed-rank.
How do I know whether to use a t-test or ANOVA?
Use a t-test for one primary comparison involving two means. Use ANOVA when comparing three or more means or analyzing several experimental factors. Multi-group analysis normally requires planned contrasts or adjusted follow-up comparisons.
What test should I use for categorical data?
Use a chi-square goodness-of-fit test for one categorical variable compared with expected proportions. Use a chi-square independence test for two independent categorical variables, and consider an exact method when sparse counts make the approximation doubtful.
Should I use Pearson or Spearman correlation?
Use Pearson for a reasonably linear relationship between numerical variables. Use Spearman for ordinal variables or a monotonic relationship better represented by ranks. Inspect a graph before relying on either coefficient.
Which test should I use for before-and-after data?
Use a paired t-test for a suitable continuous change score or Wilcoxon signed-rank for an appropriate rank-based paired analysis. With more than two time points, consider repeated-measures ANOVA, Friedman, or a mixed-effects model.
Can AI choose a statistical test accurately?
AI can shortlist suitable methods for clearly described standard designs. Accuracy depends on the user's description, the transparency of the decision rules, and the complexity of the study. A responsible tool should not promise the correct test for every dataset.
Do I need to test for normality?
Evaluate the relevant distributional assumptions, but do not let one normality p-value choose the method. Use the design, plots, residuals or paired differences, outliers, variance structure, sample information, and the target effect together.
What should I do when variances are unequal?
For two independent means, Welch's t-test is a common variance-aware choice. For three or more independent groups, consider Welch ANOVA or another model that allows unequal variances. Do not switch automatically to a rank test unless that method answers the intended question.
Choose the Right Statistical Test for Your Study
An AI Statistical Test Selector can remove much of the initial confusion by converting a clear study description into a structured recommendation. Its real value is not speed alone. It is the ability to make the selection logic visible, expose assumptions, offer meaningful alternatives, and recognize when the information supplied is not enough.
Begin with the research goal, outcome meaning, observation structure, and groups or predictors. Then verify the diagnostics and confirm that the method estimates the quantity you actually need. Straightforward comparisons, associations, and regression problems may lead directly to a familiar test. Clustered, repeated, censored, highly incomplete, or high-stakes data may require an advanced model or statistical review.
Use the AI Statistical Test Selector as a decision aid, not as a substitute for study design. The final analysis should report the estimated effect, uncertainty, assumptions, and limitations rather than only the test name or p-value.
Sources and Verification
| Authority or documentation | Use in this article |
|---|---|
| NIST/SEMATECH Engineering Statistics Handbook | NIST assumptions |
| NIST/SEMATECH: Levene Test for Equality of Variances | NIST Levene |
| American Statistical Association Statement on p-Values | ASA p-values |
| R Documentation: Shapiro-Wilk Normality Test | R Shapiro |
| SciPy Documentation: chi2_contingency | SciPy chi-square |
| SciPy Documentation: fisher_exact | SciPy Fisher |
| OpenAI Help: Data analysis with ChatGPT | OpenAI analysis |
| Julius Documentation: Getting Started | Julius docs |
| XLSTAT AI Assistant | XLSTAT AI |