
AI vs SPSS for Statistical Analysis: Which Is Better?
AI cannot completely replace SPSS for every research project. The practical choice is to use AI for speed and assistance, while preserving controlled execution, verification and accountability.
AI vs SPSS for Statistical Analysis: Differences, Uses, and the Best Choice
AI cannot completely replace SPSS for every research project. The practical choice is to use AI for speed and assistance, while preserving controlled execution, verification and accountability.
AI cannot completely replace SPSS for every research project. It can perform many routine analyses, generate code, explore data and explain results, while SPSS remains stronger when the work requires controlled procedures, structured data management, reusable syntax or a formal audit trail.
For most researchers, the practical answer to AI vs SPSS for statistical analysis is to use each tool for the part of the workflow it handles best. AI can accelerate planning and communication; SPSS or another controlled statistical environment can execute and preserve the analysis that supports the final claim.
AI vs SPSS for Statistical Analysis
AI and SPSS overlap, but they are not interchangeable. SPSS is purpose-built statistical software with documented procedures, menus, syntax, data-management functions and output tables. AI analysis tools accept natural-language instructions and may recommend a test, write code, execute that code, create visualisations or explain supplied output.
The comparison becomes clearer when statistical work is divided into methodological reasoning, computational execution and research governance. AI is often strongest in reasoning support and communication. SPSS is often strongest in controlled execution and structured records. Governance, including privacy, approval and accountability, remains a human and organisational responsibility.
The best choice therefore changes by use case. Exploratory business analysis may begin in a conversational tool. A dissertation may use AI to draft syntax but retain SPSS output and methods documentation. Clinical, government or regulated work may restrict AI use to approved environments and require specialist review.
What Is SPSS and How Does It Support Statistical Analysis?
How IBM SPSS Statistics Works
IBM SPSS Statistics combines a spreadsheet-style Data Editor, graphical menus, command syntax and an Output Viewer. A user can select a procedure through menus or save the same operation as syntax, which records the variables, filters, transformations and options used.
Current SPSS Statistics documentation also describes an AI Output Assistant that uses IBM watsonx.ai to provide contextual guidance and explain selected output. This makes the simple “traditional software versus AI” framing incomplete because SPSS itself now includes an AI-assisted interpretation layer. See IBM’s SPSS v32 documentation and AI Output Assistant guide.
Common Statistical Tests Available in SPSS
SPSS supports descriptive statistics, frequencies, cross-tabulation, t-tests, chi-square tests, correlations, analysis of variance, linear and logistic regression, reliability analysis, factor analysis and non-parametric procedures. Additional editions and modules extend the platform into forecasting, complex samples, missing-data analysis, exact tests, neural networks, conjoint analysis and other specialised work. The exact feature set depends on the edition or licence. IBM provides a current overview in its SPSS feature catalogue and commercial edition comparison.
How SPSS Manages Variables, Labels and Missing Data
SPSS is particularly useful for structured research data because an .sav file can preserve variable labels, value labels, formats, measurement levels, user-defined missing values, case weights and other metadata. Those details can be lost when a file is converted to CSV without a separate codebook.
Missing-data treatment is not a minor technical setting. Listwise deletion, pairwise deletion, user-defined missing codes and multiple imputation can produce different samples and conclusions. IBM offers dedicated missing-value procedures rather than treating every blank cell as an instruction to delete the row. See IBM SPSS Missing Values.
Why Universities and Research Institutions Use SPSS
SPSS fits many established teaching and research workflows because users can run recognised procedures without building a programming environment from scratch. Supervisors, methods instructors and research teams may already know how to inspect its syntax and output.
That familiarity should not be mistaken for automatic scientific validity. A poor sample, weak measure or inappropriate model remains poor regardless of the software that calculates the p-value.
Main Strengths and Limitations of SPSS
SPSS is strongest when the analysis uses structured data, established procedures and repeatable syntax. It is also useful when a team needs a common interface or when labelled survey variables, weights and missing-value rules must remain visible.
Its practical limitations include commercial licensing, a learning curve that still requires statistical knowledge and less freedom than open programming environments for unusual or newly developed methods. Menu access makes a test easier to run, not easier to justify.
What Are AI Tools for Statistical Analysis?
How Conversational AI Data Analysis Works
Conversational AI tools allow a user to describe an analytical task in ordinary language. The system may inspect an uploaded dataset, propose a method, generate Python or R code, execute the code and return a table, chart or explanation.
These stages are different. A generated answer is a statement from the model. Generated code is a proposed computational procedure. Executed code is a procedure actually run against the data. A validated analysis is one in which a qualified person has confirmed the data, design, settings, assumptions and interpretation.
General AI Assistants and Dedicated Analytics Platforms
General assistants such as ChatGPT and Claude can work across research questions, code, files, tables and narrative reporting. OpenAI documents file-backed data analysis, tables, charts and access to code used in the analysis. Anthropic documents a sandboxed code-execution tool that can run Python and Bash for data analysis, visualisation and file generation. See OpenAI’s data-analysis guide and Anthropic’s code-execution documentation.
Dedicated platforms such as Julius AI organise the experience around data analysis and natural-language questions. Their convenience can be valuable, but suitability still depends on what code is run, what defaults are chosen and whether the result can be exported and reproduced. Julius describes R-based support for common analyses on its AI R analysis page.
Statistical Tasks AI Tools Can Perform
Current AI analysis tools can help detect missing values and duplicates, create descriptive summaries, compare groups, calculate correlations, fit regression models, explore time series, generate charts and draft interpretations. OpenAI’s official guidance includes aggregation, dataset merging, anomaly detection and common inferential procedures among supported workflows. See Extracting insights with ChatGPT data analysis.
Capability does not equal suitability. A tool can execute a mathematically correct t-test while misunderstanding that the observations are paired, or fit ordinary regression when the data are clustered. The researcher must supply design information that is not visible in the spreadsheet.
How AI Generates Python, R and SPSS Syntax
An AI assistant can translate a research request into Python, R or SPSS syntax and explain each command. SPSS is not isolated from open-source languages: IBM provides integration plug-ins for Python and R, allowing code to interact with SPSS data, procedures and output. See IBM’s integration plug-in documentation.
This creates a useful middle path. AI can draft syntax, an analyst can review it, and SPSS can run the approved commands in a repeatable environment.
Main Strengths and Limitations of AI Analytics
AI reduces the effort required to move from a research question to an initial analysis. It can ask clarifying questions, explain terminology, produce code and translate dense output for non-technical readers.
Its main weakness is that fluent language can conceal missing information. An answer may look complete even when the model has guessed a variable role, omitted a diagnostic or interpreted an association as causation.
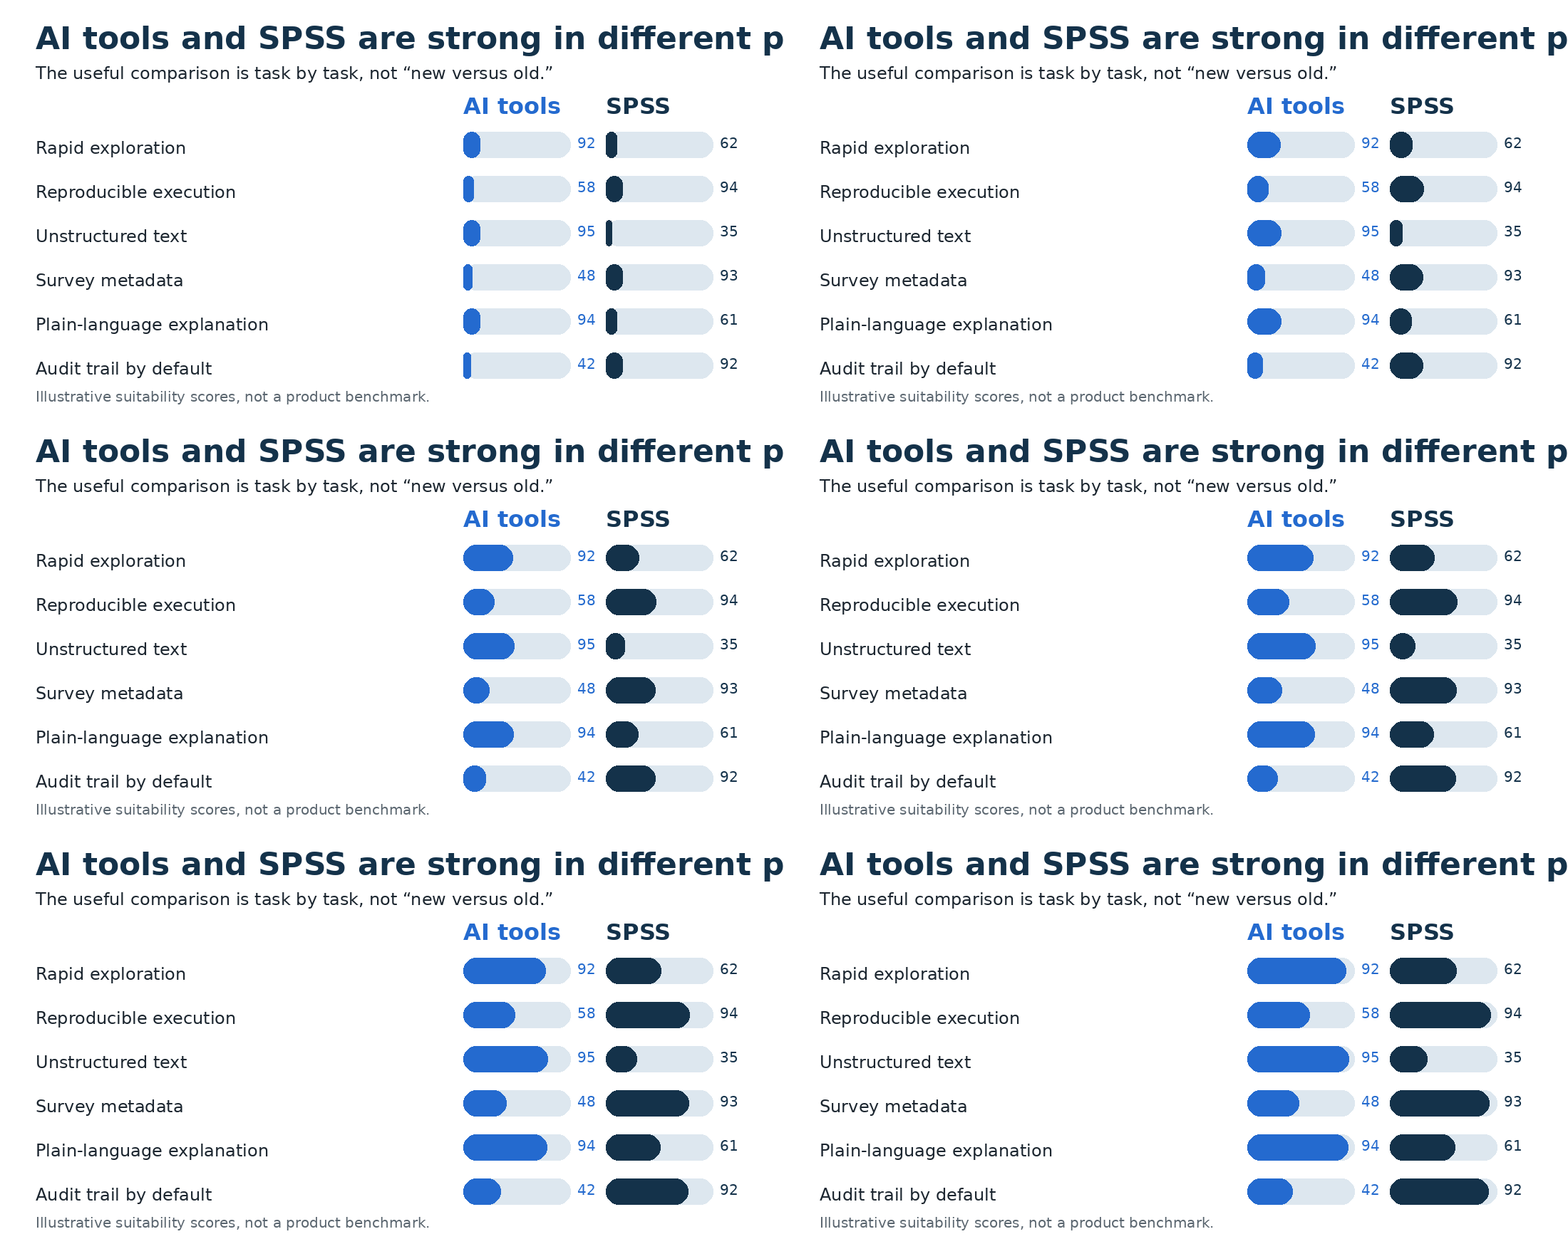
AI vs SPSS: Key Differences at a Glance
| Decision factor | IBM SPSS Statistics | AI data-analysis tools |
|---|---|---|
| Primary interface | Menus, Data Editor, output tables and syntax | Natural-language prompts, often linked to generated or executed code |
| Ease of entry | Menu-driven, but the user must understand statistical choices | Easy to ask a first question; difficult errors may be hard for beginners to detect |
| Statistical control | Documented procedures and explicit options | Depends on the generated code, libraries, defaults and review |
| Reproducibility | Strong when syntax, data, version and settings are preserved | Possible when prompts, code, files, versions, settings and seeds are preserved |
| Data preparation | Strong support for labels, recoding, missing values, weights and survey metadata | Fast for common cleaning tasks but may misunderstand metadata or intent |
| Unstructured data | Limited compared with general-purpose AI | Strong for open-text coding, extraction and summarisation |
| Advanced modelling | Broad established procedures plus optional modules and language integration | Potentially extensive through Python or R, but expertise is needed to validate it |
| Visualisation | Reliable standard charts and editable output | Fast conversational chart generation and explanation |
| Interpretation | Formal output, documentation and an AI assistant in current versions | Strong plain-language explanation with a risk of unsupported conclusions |
| Audit trail | Strong when syntax and output are retained | Variable unless the full conversation and execution record are saved |
| Cost | Commercial licensing, with academic and institutional options | Free and paid plans vary; review time is a hidden cost |
| Ideal use | Controlled, repeatable and structured statistical work | Exploration, coding support, text analysis and communication |
Natural-Language Prompts vs Menus and Syntax
A prompt is useful when the user does not know the command or wants to explore several approaches. Menus and syntax are useful when the procedure is already defined and must be inspected or rerun. A precise prompt can still produce incorrect code, while a syntax file can still encode a poor methodological decision.
Probabilistic Responses vs Deterministic Calculations
The common claim that AI only guesses while SPSS performs real mathematics is too simple. Modern AI tools can execute actual Python or R code. The more important distinction is whether the computational steps, versions, settings and data transformations are visible and controlled.
Flexible Exploration vs Standardised Procedures
AI is valuable while the question is developing because it can rapidly compare summaries, transformations and visualisations. SPSS becomes more valuable once the analysis plan is settled and the same procedure must be applied consistently.
Speed of Analysis vs Control Over Execution
AI can produce a first answer quickly. The realistic cost appears during review. If an analyst must reconstruct undocumented transformations, correct variable coding and rerun every test, the apparently faster route may become slower than a controlled workflow from the beginning.
Can AI Replace SPSS for Statistical Analysis?
When AI Can Perform the Same Tasks as SPSS
AI can substitute for some SPSS tasks when the data are clean, the design is simple, the test is standard and the result is independently checked. Descriptive statistics, straightforward correlations, common t-tests, simple one-way ANOVA, basic regression and exploratory charts are realistic examples.
When AI Cannot Reliably Replace SPSS
AI-only analysis becomes less suitable when the project involves complex sampling, survey weights, custom missing-value rules, repeated or clustered observations, specialised procedures, strict confidentiality, regulatory review or a requirement that another analyst reproduce the work months later.
Why Correct Calculations Can Still Produce Incorrect Conclusions
A correct correlation between advertising spend and sales does not show that advertising caused the increase if both rose during a seasonal peak. A correct p-value does not prove that the sample was representative, the variables were measured well or the reported effect matters in practice.
The Importance of Statistical Assumptions and Research Design
Test selection may depend on independence, distribution, sample size, repeated measurements, clustering, measurement level, missingness and the purpose of the study. AI can identify assumptions to examine, but it cannot recover design facts that the researcher never provides.
Why High-Stakes Analysis Still Requires Validation
Clinical, financial, legal, public-policy and regulatory decisions can affect people directly. In those settings, the dataset, code, model specification, diagnostics, output and narrative should be reviewed by someone qualified to understand the consequences of an error.
Which Statistical Tests Can AI and SPSS Perform?
| Statistical task | SPSS support | Common AI support | AI-only suitability | Verification need |
|---|---|---|---|---|
| Frequencies and descriptives | Easy | Common | Often acceptable for low-risk exploration | Recommended |
| Independent and paired t-tests | Easy | Common | Sometimes | Recommended |
| Chi-square tests | Easy | Common | Sometimes | Recommended |
| Pearson and Spearman correlation | Easy | Common | Sometimes | Recommended |
| One-way ANOVA | Easy | Common | Sometimes | Recommended |
| Repeated-measures ANOVA | Available | Common through code | Rarely suitable for formal work | Strong |
| Linear regression | Easy | Common | Sometimes for exploration | Strong |
| Logistic regression | Available | Common through code | Rarely without review | Strong |
| Reliability and factor analysis | Available | Common through code | Not for formal conclusions | Required |
| Complex survey analysis | Specialised capability | Depends on package and code | No | Required |
| Mixed or multilevel models | Procedure or language integration | Possible through R or Python | No | Required |
| Custom or emerging models | May require extensions | Potentially broad through code | No | Required |
Descriptive Statistics and Frequency Analysis
Both approaches can calculate counts, percentages, means, medians, standard deviations and ranges. The larger risk is often upstream: duplicated records, miscoded categories, excluded cases or summaries that do not fit the distribution.
T-Tests, Chi-Square Tests and Correlation
The user must specify whether observations are independent or paired, how unequal variances will be handled and whether the hypothesis is one-sided or two-sided. Chi-square tests also require attention to small expected counts, while correlation requires a reasoned choice between Pearson, Spearman or a design-specific alternative.
ANOVA and Repeated-Measures Analysis
One-way ANOVA is widely supported. Repeated-measures and mixed designs require more care because within-subject structure, sphericity, missing observations, contrasts and post-hoc decisions affect the result.
Linear and Logistic Regression
Both SPSS and code-backed AI tools can fit regression models. Verification should include residual behaviour, influential observations, multicollinearity, reference categories, calibration, separation and whether the model specification matches the study question.
Factor Analysis, Reliability and Specialised Models
AI can generate code for Cronbach’s alpha, exploratory factor analysis and related procedures, but it may miss reverse-coded items, ordinal measurement issues, weak factorability or unsuitable retention and rotation choices. Specialised models require deeper review because package defaults and implementation details matter.
Where SPSS Is Stronger Than AI Tools
Academic Workflows and Reproducible Syntax
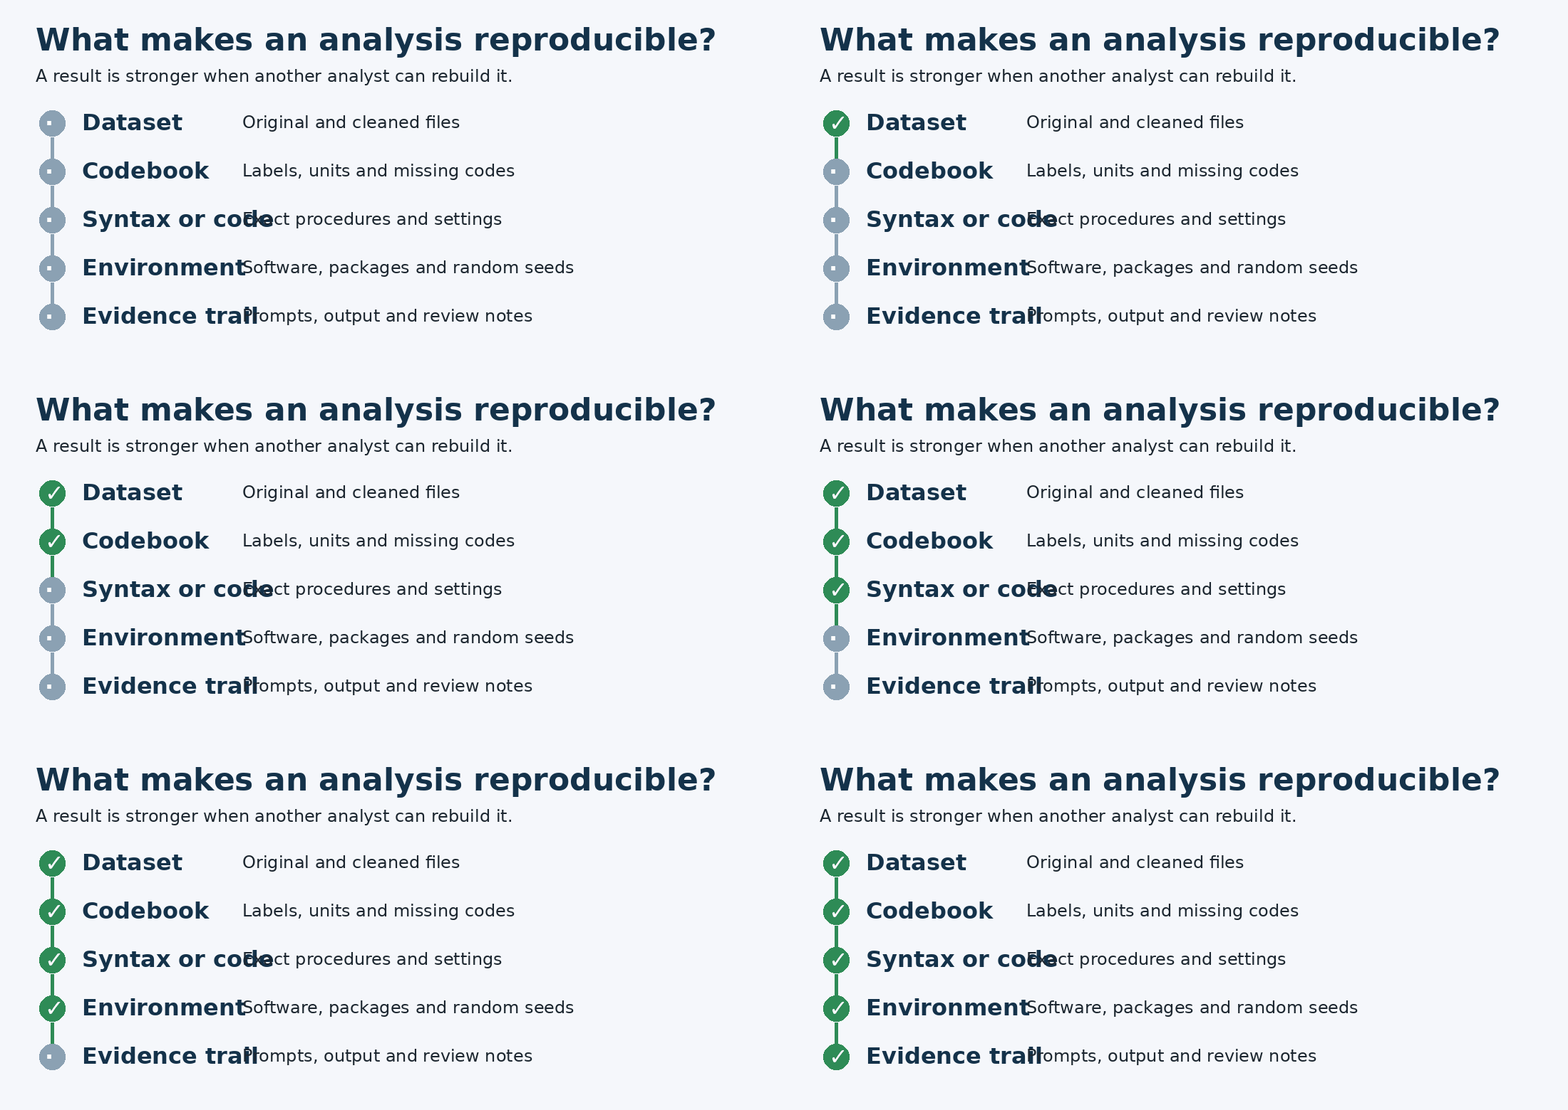
SPSS fits established academic workflows because the syntax and output can be shared with a supervisor, collaborator or reviewer. The strongest record also includes the codebook, original and cleaned data, software version, random seed where relevant and a log of manual decisions.
Structured Survey and Questionnaire Data
Value labels, Likert-type responses, weights, custom tables, reliability analysis and factor analysis are central to many social-science and market-research projects. SPSS keeps those structures visible rather than reducing the dataset to unlabeled values.
Missing Values, Weighting and Complex Samples
A conversational request such as “remove missing rows and analyse the survey” may discard meaningful information or ignore the sampling design. SPSS offers explicit procedures and modules for missing values and complex samples, which makes important assumptions easier to inspect.
Institutional Support and Repeatable Production
Organisations may prefer a supported statistical platform because licences, documentation, training, access controls and established operating procedures are easier to govern than a collection of changing AI tools.
Where AI Tools Are Stronger Than SPSS
Choosing Tests and Explaining Statistical Code
AI can act as an interactive tutor by asking about the outcome, predictors, design and sample structure before suggesting possible methods. It can then draft SPSS syntax, R or Python and explain the logic line by line. The suggestion remains a starting point rather than an approval.
Analysing Open-Ended and Unstructured Text
General-purpose AI models are stronger than traditional SPSS workflows at summarising or categorising open-text responses. A defensible qualitative workflow still needs a documented coding framework, consistency checks and attention to minority or contradictory views.
Plain-Language and APA-Style Reporting
AI can turn verified output into a readable explanation or draft an APA-style results paragraph. The researcher should compare every statistic, degree of freedom, sign, confidence interval and conclusion with the original output.
Rapid Exploratory Analysis
Conversational prompts make it easy to request distributions, missingness checks, group comparisons and visualisations. This is useful for discovering problems before the confirmatory analysis is locked.
Risks and Limitations of Using AI for Data Analysis
Hallucinated Results and Unsupported Interpretations
An AI system may state a number that was never calculated, refer to a nonexistent variable or infer a result from an incomplete table. Never report a sample size, p-value, coefficient, effect size or confidence interval unless it can be traced to executed code or verified output.
Incorrect Test Selection and Missing Assumption Checks
A model may recommend an independent t-test for paired observations or ordinary regression for clustered data. Explicit prompts can improve the response, but they do not replace understanding of the design.
Prompt Variation and Reproducibility
Different wording can change the proposed method, code or interpretation. Reproducibility therefore requires more than saving a screenshot. The prompt, generated code, tool version, package versions, settings, random seeds and output should remain together.
Privacy Risks When Uploading Sensitive Data
Privacy cannot be described as one universal property of “AI.” OpenAI states that content from individual services may be used to improve models unless the user opts out, while inputs and outputs from business products are not used for training by default unless an organisation opts in. Uploaded-file retention also depends on the product and plan. See OpenAI’s data-use policy and File Uploads FAQ.
Researchers should not upload identifiable patient, student, employee or customer data merely because a platform accepts spreadsheets. The account type, contract, retention policy, institutional approval and applicable local law must be checked first. De-identification also requires more than removing names when combinations of variables can reveal a person.
Fabricated Citations and Overreliance
A generated reference may look convincing while being nonexistent or unrelated. Every citation should be opened and checked against the specific claim. The easier the software is to operate, the easier it becomes to create a polished but invalid analysis.
Common Misconceptions About AI and SPSS
“AI Is Faster, So It Must Be Better”
AI is often faster at producing a first answer. It may not be faster at producing a verified and publication-ready result once review, correction and documentation are included.
“SPSS Automatically Makes an Analysis Scientifically Valid”
SPSS executes the selected procedure. It cannot determine whether the sample is biased, the measure is weak or the causal language exceeds the design.
“Matching P-Values Prove the Analysis Is Correct”
Two tools can produce the same p-value while sharing the same coding mistake or unsuitable model. Verification must cover the research question, sample, transformations, assumptions, effect size, uncertainty and interpretation.
“AI Removes the Need to Understand Statistics”
AI reduces the coding barrier. It does not remove the need to recognise a wrong test, a violated assumption or an unsupported conclusion.
“SPSS Cannot Work With AI-Generated Code”
AI can generate SPSS syntax, and IBM provides Python and R integration. Current SPSS versions also include an AI-assisted output feature, so the practical future is integration rather than complete replacement.
“A Conversational Explanation Is Reproducible Evidence”
A clear paragraph is communication. Reproducible evidence requires the data, computational procedure, settings, output and documentation needed to recreate the result.
How to Use AI and SPSS Together
| Workflow stage | Recommended action | Verification checkpoint |
|---|---|---|
| Define the question | State the population, outcome, predictors, design and whether the work is exploratory or confirmatory | Confirm that the question can be answered by the available data |
| Build the codebook | Document variable names, meanings, units, valid ranges and missing codes | Check labels against the source instrument |
| Consult AI | Ask for possible tests, assumptions, alternatives and failure conditions | Treat the response as options, not approval |
| Draft syntax | Request commented SPSS syntax or reproducible R or Python code | Review variables, filters, weights, reference groups and test direction |
| Prepare data | Inspect ranges, duplicates, missingness, coding and distributions | Preserve the untouched source dataset |
| Execute analysis | Run the approved syntax in SPSS or another controlled environment | Save syntax, software version and complete output |
| Check validity | Inspect assumptions, diagnostics, effect sizes and confidence intervals | Do not reduce the result to p < .05 |
| Draft reporting | Use AI to explain only the supplied verified output | Compare every number and conclusion with the source table |
| Archive evidence | Store prompts, code, data versions, output and review notes together | Confirm another analyst could reproduce the work |
Example of an AI-to-SPSS Statistical Workflow
Example Research Question and Variables
Assume a researcher wants to determine whether a six-week training programme improved employee assessment scores. The dataset contains participant ID, group, pre-training score, post-training score, department and age. The same employees completed the assessment before and after the programme.
Prompt for Selecting the Statistical Test
A useful answer might discuss change scores, ANCOVA using the post-score with baseline adjustment, or a repeated-measures model. The researcher must decide which approach matches the design and analysis plan.
Prompt for Generating SPSS Syntax
Running and Verifying the Analysis
Before interpreting the group effect, the researcher should inspect coding, missing cases, baseline differences, group sizes, influential observations, linearity and the relationship between the baseline score and the outcome. If the group-by-baseline interaction is important, the standard ANCOVA interpretation may not be appropriate.
Converting SPSS Output Into an APA-Style Paragraph
The verified output can be supplied to AI with an instruction to report only the values shown. The final paragraph must be checked for group direction, sample size, signs, decimal values, degrees of freedom, p-value, effect size, confidence interval and language that matches the study design.
AI vs SPSS for Different Users and Industries
| Audience or setting | Preferred approach | Decision reason |
|---|---|---|
| Undergraduate student | SPSS, JASP or jamovi with AI tutoring | The procedure remains visible while AI explains unfamiliar concepts |
| Dissertation researcher | AI plus SPSS, R, JASP or jamovi | Planning and writing support can be combined with reproducible execution |
| Journal author | Controlled statistical software plus documented AI assistance | Methods, output and disclosure must remain transparent |
| Clinical or healthcare researcher | Approved software, restricted AI use and specialist review | Sensitive data and high consequences require stronger governance |
| Social-science or market researcher | SPSS or equivalent with AI support | Labels, weights, scales, missing values and complex samples matter |
| Business analyst | AI for exploration plus repeatable code for production | Fast answers are useful, but recurring reports require stable execution |
| Data scientist | R or Python with AI coding support | Custom modelling, automation, version control and deployment are priorities |
| Government or regulated organisation | Approved controlled environment with documented oversight | Auditability, security and long-term maintainability outweigh convenience |
Local requirements can alter the recommendation. Data-protection law, institutional policy, journal guidance, cloud-region availability and software procurement vary by country and organisation. The article’s decision framework should therefore be applied after checking the rules that govern the actual dataset.
SPSS vs ChatGPT, Julius AI, R, Python, JASP and Other Alternatives
SPSS vs ChatGPT and Claude
ChatGPT and Claude are stronger for conversational exploration, code drafting, text analysis and explanation. SPSS is stronger as a dedicated statistical workspace with labelled data, explicit procedures and reusable syntax. The general AI tools become more defensible when they expose the executed code and the analyst preserves it.
SPSS vs Julius AI
Julius AI offers a data-centred conversational interface and promotes support for common analyses through R. It may suit rapid exploratory work, but formal reporting still requires preserved code, settings, data decisions and outputs.
SPSS vs R and Python
R is a free environment for statistical computing and graphics, while Python supports a broad ecosystem for data manipulation, scientific computing, automation and machine learning. Both are more flexible than a menu-only workflow and easier to place under version control, but they demand deliberate choices about packages, procedures and dependencies. See The R Project.
SPSS vs JASP, jamovi and PSPP
JASP is a free, open-source graphical platform that supports frequentist and Bayesian procedures and can import SPSS files. jamovi is a free statistical spreadsheet powered by R. GNU PSPP provides many SPSS-style procedures and syntax without a commercial licence. See JASP, jamovi and GNU PSPP.
These tools may be better than AI-only analysis for students who need a structured interface but cannot access SPSS. Feature coverage should be checked against the required procedure rather than assuming that every alternative reproduces every SPSS module.
How to Choose Between AI and SPSS
Choose SPSS When Reproducibility Is Essential
SPSS is a strong choice when another analyst must rerun the same commands, inspect a syntax file, preserve labels and weights or follow an established institutional workflow.
Choose AI When You Need Rapid Exploration or Guidance
AI is useful while defining the question, comparing methods, learning a concept, drafting code, exploring a dataset or communicating a verified result.
Use Both for Academic and Professional Research
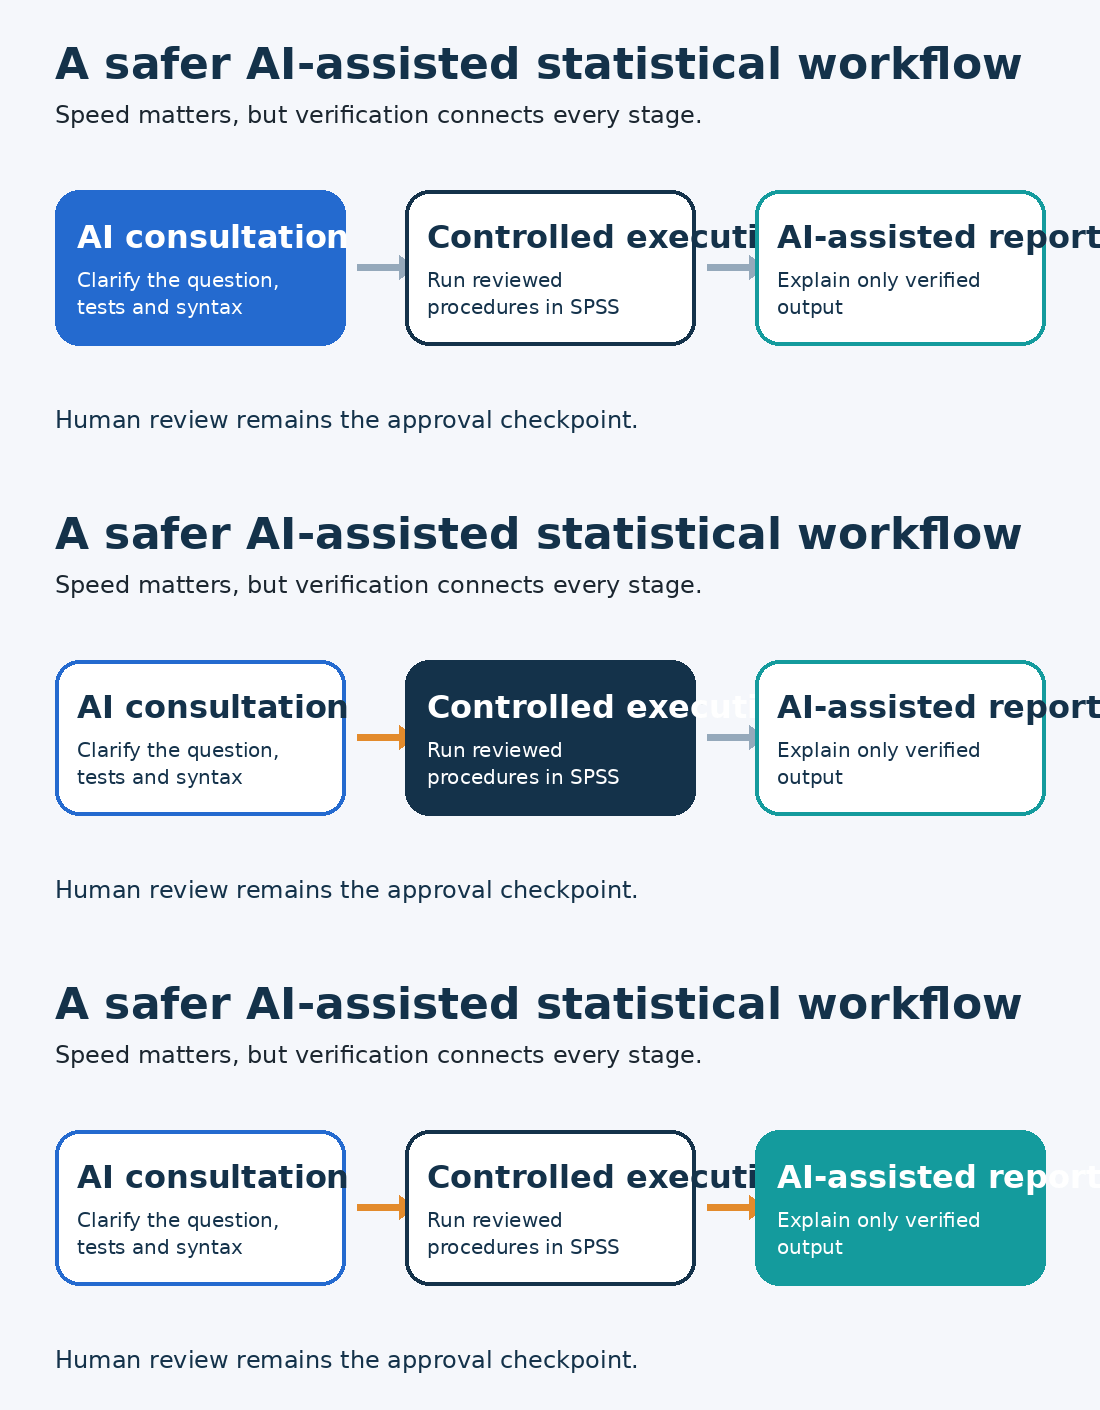
A combined workflow is usually the strongest option when the project must balance speed with accountability. AI consultation can precede reviewed syntax, controlled execution, diagnostic checking and AI-assisted explanation.
Questions to Ask Before Selecting a Tool
Ask whether the work is exploratory or confirmatory, whether the results will be published, whether an audit trail is required and whether the dataset is confidential. Also consider the complexity of the method, the user’s ability to inspect assumptions and whether another person must reproduce the analysis later.
Best Practices for Accurate and Responsible Analysis
Verify Numbers, Preserve Evidence and Protect Data
Never report an AI-generated statistic without tracing it to executed code or original software output. Preserve the untouched dataset, cleaned dataset, codebook, transformations, syntax, software and package versions, random seeds, prompts, output and review notes.
Remove or appropriately de-identify personal information before using an external service, and confirm that the account, contract and institutional policy permit the intended processing.
Report Magnitude and Uncertainty
A p-value does not show whether an effect is important or precisely estimated. Report effect sizes and confidence intervals where appropriate, and explain what the magnitude means in the context of the research question.
Disclose Material AI Use
Disclosure requirements depend on the university, journal, funder and publisher. APA guidance states that relevant generative-AI use may need to be disclosed in the Methods section, author note or another appropriate location. COPE states that AI tools cannot qualify as authors because they cannot take responsibility for the work. See APA Style guidance on generative AI and COPE’s position on authorship and AI tools.
Use Human Statistical Review for High-Stakes Decisions
Expert review is especially important when the model is complex, the dataset is sensitive, the consequences are material or the person running the analysis cannot independently evaluate the output.
The Future of AI and SPSS in Statistical Research
Natural-Language Interfaces and AI-Assisted Syntax
Natural-language interaction is becoming part of both generative AI platforms and established statistical software. The likely direction is not the disappearance of statistical packages but a closer connection between conversational interfaces, explicit code and controlled execution.
Automated Interpretation and Reporting
Draft narratives will become faster and easier to tailor to different readers. Researchers will still need to distinguish association from causation, statistical significance from practical importance and model performance from real-world usefulness.
Why Human Oversight Will Remain Necessary
A model cannot accept responsibility for biased sampling, weak measurement, undisclosed exclusions or the consequences of a decision. Human oversight is not merely a temporary response to imperfect models; it is part of scientific and professional accountability.
FAQs
Can ChatGPT perform SPSS statistical analysis?
ChatGPT can analyse uploaded structured data, execute code-backed statistical workflows and generate SPSS syntax. Formal results should still be checked against the executed code or SPSS output.
Can AI analyse an SPSS .sav file?
Support varies by platform. Some tools and libraries can read .sav files directly, while others require CSV or Excel. Any conversion should preserve variable labels, value labels, missing-value codes, weights and a separate codebook.
Is AI more accurate than SPSS?
Neither category is universally more accurate. SPSS reliably executes a specified procedure, while a code-backed AI tool may execute the same mathematics. Accuracy depends on the data, method, options, assumptions and verification.
Can AI generate reliable SPSS syntax?
Yes, but the syntax should be reviewed before execution. Variable names, filters, weights, reference groups, missing values, test direction and output options are common failure points.
Can AI calculate t-tests, ANOVA and regression?
Yes. Current AI tools commonly perform these analyses through executed Python or R code. The method and assumptions still need independent review.
Is SPSS still relevant in 2026?
Yes. IBM currently documents SPSS Statistics v32, including established statistical procedures, data preparation, language integration and AI-assisted output interpretation.
Which tool is easier for beginners?
AI is easier for asking an initial question. SPSS, JASP or jamovi may be safer for learning a structured procedure because the selected variables and options remain visible. The easiest interface is not always the easiest place to detect an error.
Is SPSS better than AI for a dissertation?
SPSS is generally stronger for executing and documenting a standard quantitative analysis. AI is useful for planning, syntax support and explanation. The final dissertation should preserve a reproducible analysis and follow the institution’s AI policy.
Can AI write an APA-style interpretation of SPSS output?
Yes. Supply verified output, tell the tool not to invent missing values and check every number and conclusion against the source table.
Is it safe to upload research data to an AI tool?
Safety depends on the data, platform, account type, contract, retention controls and institutional policy. Identifiable or confidential records should not be uploaded without formal approval and appropriate safeguards.
Should researchers disclose their use of AI?
Material use should be disclosed according to the relevant institutional, funder or publisher policy. The researcher remains responsible for the analysis and text.
What is the best free alternative to SPSS?
There is no universal winner. JASP is useful for accessible frequentist and Bayesian analysis, jamovi offers an easy R-powered interface, PSPP provides SPSS-style procedures and R offers the greatest flexibility for users willing to code.
Final Verdict: AI, SPSS or Both?
The final decision in AI vs SPSS for statistical analysis should be based on the workflow rather than the age or popularity of the tool. AI may replace individual SPSS tasks, especially exploratory summaries, syntax drafting, visualisation and preliminary interpretation. It does not automatically replace the complete process of data management, controlled execution, reproducibility and governance.
Use AI when you need speed, guidance, coding support or clearer communication. Use SPSS when you need structured data handling, documented procedures and repeatable output. Use both when the work must be efficient and defensible: define the question, build the codebook, use AI to explore or draft syntax, review the method, run the approved analysis in a controlled environment, inspect assumptions and use AI only to explain verified results.
Neither AI nor SPSS can rescue a poorly designed study. The best tool is the one that helps produce an analysis that is valid, reproducible, reviewable, secure and appropriate for the decision it will support.