
ANCOVA: Uses, Steps, and Best Practices
ANCOVA helps researchers compare group outcomes while adjusting for variables such as baseline scores, age, or prior performance. This guide explains when to use ANCOVA, how to check its assumptions, interpret adjusted means, choose the right software, and avoid common statistical mistakes.
ANCOVA: Uses, Steps, and Best Practices
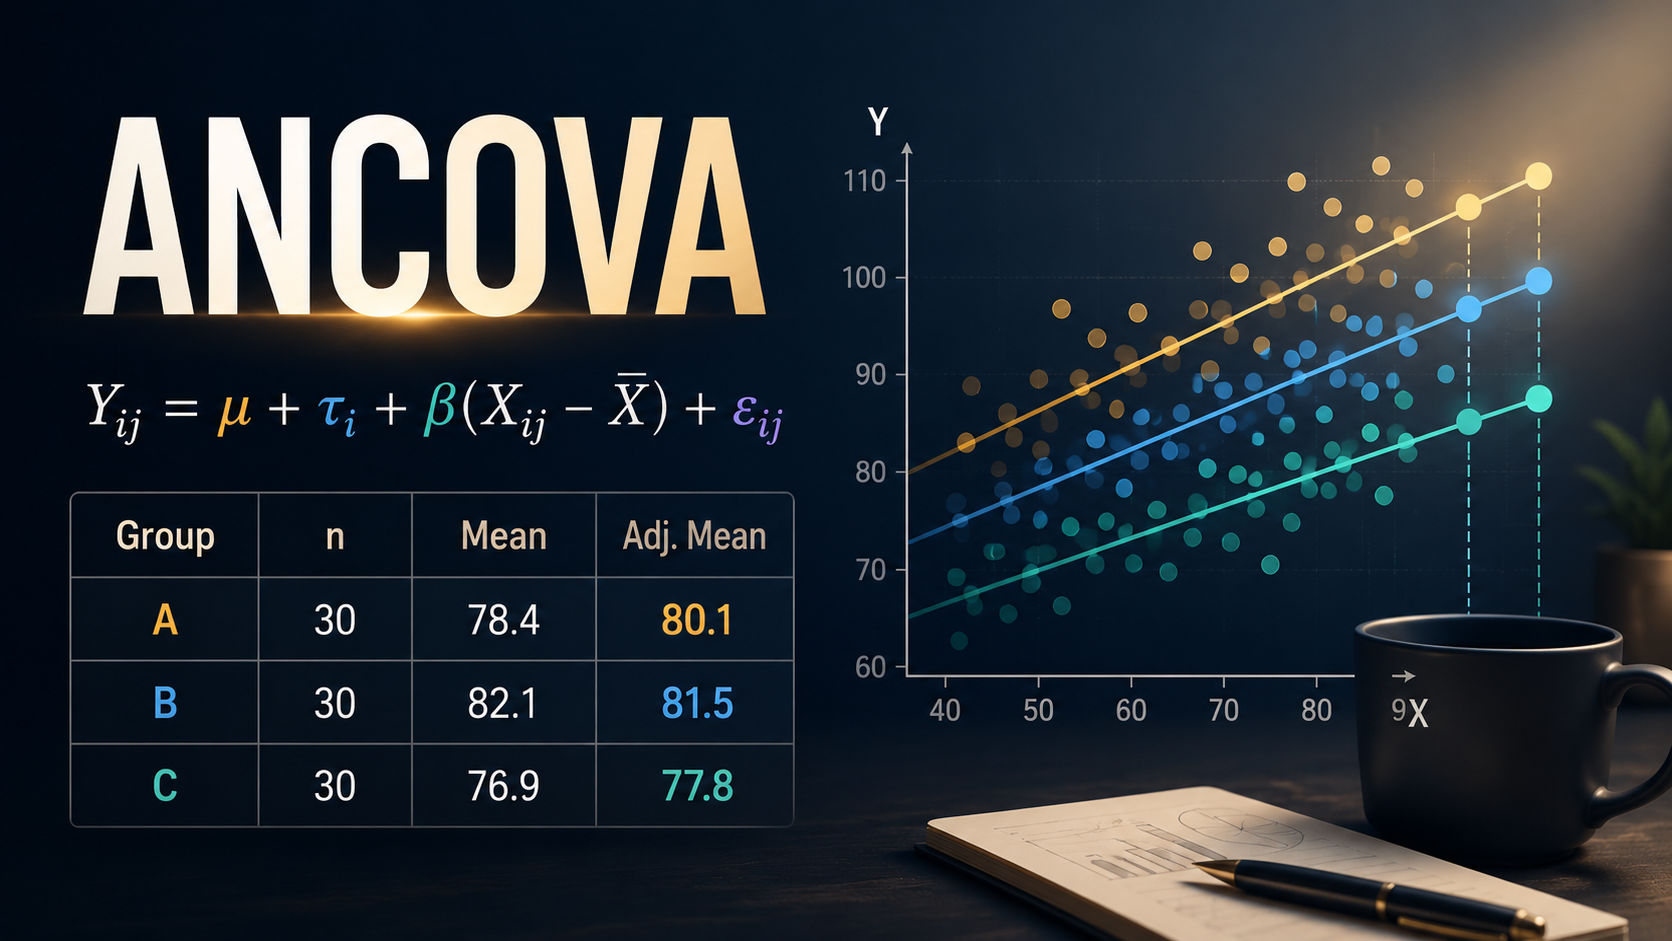
ANCOVA, or Analysis of Covariance, compares outcomes across groups while adjusting for one or more variables that also influence the outcome. It combines the group-comparison logic of ANOVA with the adjustment capabilities of linear regression.
The result is a comparison of adjusted group means, provided the research design and model assumptions support that interpretation.
What Is ANCOVA in Simple Terms?
ANCOVA answers a practical question: do groups still differ after accounting for another relevant variable?
Imagine comparing three teaching methods using final exam scores. Students begin with different levels of prior knowledge, measured through a pre-test. ANCOVA adjusts the final-score comparison for those initial differences.
The dependent variable is the final exam score, the factor is the teaching method, and the pre-test score is the covariate.
ANCOVA compares groups at a statistically common covariate level rather than relying only on their raw averages.
Why ANCOVA Matters in 2026
Real-world groups are rarely perfectly equivalent. Participants in education, healthcare, psychology, marketing, and business studies often differ before an intervention begins.
ANCOVA can improve a comparison when a baseline variable explains meaningful outcome variation. It is particularly useful in pre-test and post-test studies, clinical trials, training evaluations, and experimental research.
From what I’ve seen, ANCOVA is most credible when the covariate is selected from subject knowledge or a pre-established analysis plan, not because it happens to produce a smaller p value.
Core ANCOVA Concepts Explained
A covariate is a quantitative variable related to the outcome but not treated as the primary group effect. Common examples include a baseline score, age, prior spending, initial symptom severity, or previous performance.
Adjusted means, also called estimated marginal means or least-squares means, are model-based group estimates calculated at specified covariate values. Their quality depends on the quality of the fitted model. The R emmeans documentation makes this point directly: weaknesses in the underlying model carry into its estimated marginal means. (CRAN)
The group effect tests whether the adjusted outcomes differ beyond what random sampling variation would reasonably explain.
An adjusted mean is not a corrected raw mean; it is a prediction produced by a statistical model.
How Does ANCOVA Work in Real-World Research?
ANCOVA fits a general linear model containing a categorical group variable and one or more continuous covariates. Researchers may also include a group-by-covariate interaction to determine whether the covariate has a different relationship with the outcome in each group.
In real use, analysts should inspect the data before relying on the final significance table. Scatterplots, group distributions, missing values, influential observations, residual patterns, and covariate overlap can reveal problems that a single p value cannot.
A result may look statistically clean while depending on extrapolation into covariate ranges where a group has little or no actual data.
When Should You Use ANCOVA Instead of ANOVA or Regression?
Use ANCOVA when the outcome is continuous, the main predictor represents two or more groups, and a defensible continuous covariate is related to the outcome.
Choose ANOVA when you want an unadjusted comparison and no relevant covariate is needed. Use regression when the main objective is estimating predictor relationships rather than presenting an adjusted comparison between defined groups.
ANCOVA is often described as a mixture of ANOVA and regression because it includes both qualitative and quantitative predictors within a linear model. (XLSTAT, Your data analysis solution)
Use ANCOVA because adjustment answers the research question, not merely because adjustment creates significance.
How to Perform ANCOVA: A Practical Step-by-Step Guide
Begin by identifying the dependent variable, group factor, covariate, reference group, missing-data rule, and required effect-size measure.
Screen the data, compare descriptive statistics, and plot the outcome against the covariate separately for each group. Fit a model containing the group-by-covariate interaction before assuming common regression slopes.
Next, fit the appropriate ANCOVA model, inspect residual diagnostics, calculate adjusted means with confidence intervals, and conduct planned pairwise comparisons where necessary.
What practitioners often do is preserve the analysis code, software version, output, and decision log so the result can be reproduced rather than merely reported.
What Are the Main Assumptions of ANCOVA?
ANCOVA generally requires a continuous dependent variable, a categorical group variable, independent observations, a reasonably reliable covariate, a linear covariate-outcome relationship, and acceptable residual behavior.
The homogeneity of regression slopes assumption is especially important. It means the relationship between the covariate and outcome should be sufficiently similar across groups for a common adjusted group effect to make sense.
IBM’s SPSS guidance recommends first fitting the interaction between the factor and covariate to assess this condition. (IBM)
Unequal slopes do not automatically make the data unusable, but they change the question the model can answer.
ANOVA vs. ANCOVA vs. Regression: What Is the Difference?
ANOVA compares group means. ANCOVA compares group means after adjusting for covariates. Regression estimates an outcome from continuous or categorical predictors.
Mathematically, all three can be expressed through the general linear model. Their practical differences come from the research question, model specification, and interpretation of coefficients.
ANCOVA should therefore be treated as a complete linear model, not as a simple correction applied after an ANOVA.
Common Misconceptions About ANCOVA
ANCOVA does not automatically remove confounding. It adjusts only for variables included in the model, under assumptions that may or may not be defensible.
A significant covariate is not automatically a good covariate. Selection should consider when the variable was measured, how reliable it is, whether it precedes treatment, and what role it plays in the causal process.
ANCOVA also cannot create randomization, repair weak measurements, or prove that an adjusted group difference is causal.
Top ANCOVA Mistakes and Statistical Risks to Avoid
A common mistake is controlling for a variable measured after treatment. Such a variable may be part of the mechanism through which the treatment affects the outcome. Adjusting for it can remove part of the effect or introduce bias.
Another overlooked risk is poor covariate overlap. If one group contains mostly low baseline scores and another contains mostly high scores, adjusted comparisons may depend heavily on model-based extrapolation.
Theoretical advice often says to check assumptions, but in practice, useful checking means examining plots, influential cases, model stability, and the practical consequences of each violation.
A precise p value cannot rescue an inappropriate covariate or a poorly specified research question.
Best Tools for ANCOVA: XLSTAT vs. SPSS vs. R vs. Python
SPSS is useful for menu-driven analysis, standard output tables, GLM Univariate procedures, and estimated marginal means. XLSTAT brings ANCOVA into Microsoft Excel and supports models containing qualitative and quantitative predictors. (IBM)
R is strong for reproducibility, model diagnostics, contrasts, and adjusted means through packages such as car and emmeans.
Python is useful when ANCOVA must connect with data preparation, automation, notebooks, or larger analytical systems. Statsmodels supports formula-based linear models and ANOVA tables for fitted models. (StatsModels)
The best platform is the one that allows the analyst to inspect, reproduce, and explain the model rather than simply generate a table.
Advanced ANCOVA Strategy: Why More Covariates Can Make a Model Worse
Adding covariates may reduce residual variance, but it can also create multicollinearity, consume degrees of freedom, increase instability, and make the group effect harder to interpret.
A useful contrarian insight is that the largest model is not necessarily the most rigorous. A small, pre-specified set of reliable baseline covariates is often more defensible than a long list selected after examining the outcome.
Measurement error also matters. A poorly measured covariate may fail to provide the adjustment researchers expect and can distort the interpretation of adjusted means.
Covariate quality, timing, and causal relevance matter more than covariate quantity.
Real-World ANCOVA Case Studies
In education, ANCOVA can compare teaching methods while adjusting exam outcomes for pre-test knowledge. In healthcare, it can compare treatment groups while accounting for baseline symptom severity.
Psychology researchers may adjust post-intervention anxiety for initial anxiety. A business analyst may compare campaign conversions after controlling for prior customer engagement.
A useful case study should report the sample, group variable, outcome, covariate, raw means, adjusted means, interaction test, effect size, confidence intervals, and limitations. Showing only the final p value hides the decisions that determine whether the result is trustworthy.
Conclusion
ANCOVA is a practical way to compare groups while accounting for relevant variables that may influence the outcome. It is most useful when the covariate is chosen carefully, the assumptions are checked, and the adjusted means are interpreted within the limits of the research design.
The key is not simply to run the model, but to understand what is being adjusted, why the adjustment is justified, and whether the data support the comparison. Reliable results depend on good covariate selection, adequate group overlap, sound diagnostics, and transparent reporting.
In 2026, tools such as SPSS, XLSTAT, R, Python, and AI agents can make ANCOVA faster and easier to perform. However, software and automation do not replace statistical judgment. The best ANCOVA analysis is one that is reproducible, clearly explained, and aligned with the real research question.
FAQs
What is ANCOVA?
ANCOVA, or Analysis of Covariance, compares group outcomes while adjusting for one or more continuous variables called covariates.
When should ANCOVA be used?
Use ANCOVA when you want to compare groups on a continuous outcome while controlling for a relevant baseline or background variable.
What does a covariate do in ANCOVA?
A covariate explains part of the variation in the dependent variable, allowing ANCOVA to estimate adjusted group means.
How is ANCOVA different from ANOVA?
ANOVA compares raw group means, while ANCOVA compares group means after adjusting for covariates such as pre-test scores or baseline measurements.
What are the main assumptions of ANCOVA?
ANCOVA assumes linearity, independent observations, acceptable residuals, reliable covariates, and similar regression slopes across groups.
What happens if regression slopes are unequal?
If the covariate affects groups differently, the standard ANCOVA group effect may be misleading. A group-by-covariate interaction or another model may be more appropriate.
Can ANCOVA prove causation?
ANCOVA can adjust for measured variables, but it cannot create randomization or remove all confounding. Causal conclusions still depend on the research design.
How are ANCOVA results interpreted?
Researchers examine the adjusted group effect, F statistic, p value, effect size, confidence intervals, and estimated marginal means.
What is a common mistake when using ANCOVA?
A common mistake is selecting covariates only because they improve statistical significance. Covariates should be chosen using research logic, timing, and measurement quality.
Which software can perform ANCOVA?
ANCOVA can be performed in SPSS, R, Python, XLSTAT, SAS, Stata, jamovi, and JASP. The best tool is one that supports diagnostics, reproducibility, and clear reporting.
Can AI agents perform ANCOVA?
AI agents can generate code, inspect data, and explain ANCOVA output, but their model choices and interpretations still need human verification.
Is ANCOVA still useful in 2026?
ANCOVA remains useful for baseline-adjusted group comparisons in education, healthcare, psychology, and business. It works best when assumptions, covariate overlap, and model limitations are checked carefully.