
How to Calculate Real Wage Growth Using CPI Data
Learn how to calculate real wage growth using CPI data with a simple formula, a BLS example, clear tables, and charts that show changes in purchasing power.
Real wage growth tells you whether pay is rising faster than consumer prices. To calculate it, compare the change in wages with the change in the Consumer Price Index for the same period. The exact method divides the wage growth factor by the CPI growth factor, then subtracts 1. A positive result means average purchasing power increased. A negative result means prices rose faster than wages. For a U.S. example, BLS data for July 2025 and July 2026 show a small decline in real hourly earnings.
Quick formula
Nominal wage growth percent = ((current wage / earlier wage) − 1) × 100
CPI inflation percent = ((current CPI / earlier CPI) − 1) × 100
Exact real wage growth percent = (((current wage / earlier wage) / (current CPI / earlier CPI)) − 1) × 100
Approximate real wage growth percent = nominal wage growth percent − CPI inflation percent
Real wage in base period dollars = current nominal wage × (base period CPI / current CPI)
The subtraction method is useful for a quick check. The ratio method is the better choice when you want the exact CPI based change.
What real wage growth means
A wage can rise in dollars and still lose buying power. That is the basic idea behind real wage growth.
Your nominal wage is the amount you are paid in current dollars. If your hourly pay rises from $30 to $31, your nominal wage went up. But that does not tell you whether $31 buys more than $30 bought before.
Real wages adjust pay for changes in consumer prices. The Consumer Price Index measures the average change over time in prices paid by urban consumers for a market basket of goods and services. When wage growth is faster than CPI growth, real wages rise. When CPI growth is faster, real wages fall.
This difference matters because people use pay to buy housing, food, transportation, health care, and many other goods and services. A larger paycheck can feel smaller if prices have risen even faster.
What data you need
You need an earlier wage value, a current wage value, a CPI value for each of those periods, and a clear choice about seasonal adjustment.
The dates must match. If you use July 2025 wages, use July 2025 CPI. If you use July 2026 wages, use July 2026 CPI. Mixing July wages with June CPI can change the answer and make the comparison hard to defend.
You should also use a wage series that fits your question. In this guide, the main example uses average hourly earnings for all employees on private nonfarm payrolls from the BLS Current Employment Statistics program. The series ID is CES0500000003.
Choose the right CPI for wage analysis
For a broad U.S. comparison, CPI U is usually the best starting point. It covers all urban consumers and is the index BLS uses to deflate earnings for its all employee real earnings series. BLS Real Earnings source.
BLS uses CPI W for its real earnings series for production and nonsupervisory employees. That worker group is narrower, so the wage measure and the price index should not be mixed without an explanation.
Seasonal adjustment matters too. The July 2026 BLS Real Earnings table uses seasonally adjusted average hourly earnings and seasonally adjusted CPI U values. That table shows 3.2 percent nominal hourly earnings growth, 3.3 percent CPI growth, and a 0.2 percent decline in real average hourly earnings from July 2025 to July 2026.
The headline CPI release reports 3.4 percent inflation over the same 12 month span before seasonal adjustment. Both numbers come from BLS, but they use a different adjustment basis. This is why you should keep the wage and CPI series consistent from start to finish.
Step 1: Get wage data from BLS
For this example, use BLS Current Employment Statistics series CES0500000003, which is average hourly earnings of all employees in the total private sector, seasonally adjusted. BLS Employment Situation source.
The values are $36.47 per hour in July 2025 and $37.62 per hour in July 2026. The July 2026 value is preliminary in the BLS Real Earnings table. BLS may revise recent payroll data, so a monthly article should be checked after each new release.
Step 2: Get matching CPI data
To match the seasonally adjusted wage series, use the seasonally adjusted CPI U U.S. city average, All items series. Its series ID is CUSR0000SA0. BLS CPI series ID guide.
The values are 322.169 in July 2025 and 332.813 in July 2026. These are index values, not percentages. You use the index levels to calculate the percentage change between the two months.
Step 3: Calculate nominal wage growth
Start with the wage ratio. Divide 37.62 by 36.47. The result is 1.0315328. Now subtract 1 and multiply by 100. Nominal hourly wage growth was 3.1533 percent, or 3.15 percent when rounded to two decimal places.
Step 4: Calculate CPI inflation
Now do the same with CPI. Divide 332.813 by 322.169. The result is 1.0330386. Subtract 1 and multiply by 100. CPI inflation was 3.3039 percent, or 3.30 percent when rounded to two decimal places.
Step 5: Calculate exact real wage growth
Divide the wage growth factor, 1.0315328, by the CPI growth factor, 1.0330386. The result is 0.9985424. Subtract 1 and multiply by 100. Real hourly wage growth was about -0.1458 percent, or -0.15 percent when rounded to two decimal places.
The quick subtraction method gives almost the same result. Subtract 3.3039 percent from 3.1533 percent and you get -0.1506 percent. That shortcut is close here because both rates are small. It is still an approximation. For a reproducible calculation, use the ratio formula.
Worked BLS example
| Measure | July 2025 | July 2026 | Change |
|---|---|---|---|
| Average hourly earnings | $36.47 | $37.62 | 3.15 percent from displayed values |
| Seasonally adjusted CPI U | 322.169 | 332.813 | 3.30 percent from displayed values |
| Exact real hourly wage growth | Not applicable | Not applicable | −0.15 percent |
| BLS published real average hourly earnings | $11.32 | $11.30 | −0.2 percent |
The hand calculation is slightly different from the BLS published change because the displayed values are rounded and BLS applies seasonal adjustment and revision procedures. Small differences at the second decimal place are normal when you rebuild a published statistic from rounded table values.
How to interpret the result
A positive real wage growth rate means wages rose faster than the chosen CPI measure. On average, the wage has more purchasing power than it had in the earlier period.
A result near zero means wage growth and consumer price growth were close. The paycheck may be larger, but broad purchasing power changed very little.
A negative result means consumer prices rose faster than wages. In the July 2025 to July 2026 example, the exact result is about -0.15 percent from displayed BLS values. That is a small decline, but it still means average hourly pay did not quite keep pace with the selected CPI measure.
Real wage growth does not tell you whether every household is better or worse off. CPI is an average measure, and people spend their money in different ways.
What real wage growth can affect
Purchasing power is the clearest effect. If real wages rise, workers can generally buy more of the average CPI basket with an hour of pay. If real wages fall, an hour of pay buys a little less of that broad basket.
Household budgets can also feel the change. When essential costs rise faster than pay, a household may have less room after paying for housing, food, transportation, and health care. The effect can be larger or smaller than the national CPI suggests because each household has its own spending mix.
Saving and debt payments can be affected too. If real pay weakens while fixed bills stay high, some households may have less money available for savings or extra debt payments. This is a possible effect, not a rule for every person.
Employers and workers can use real wage measures as one input when discussing raises and compensation. A nominal raise can look strong until it is compared with inflation. Real wage growth helps show whether the raise improved broad purchasing power.
Real earnings also help researchers separate changes in money wages from changes in prices. They are useful when studying living standards, labor markets, and consumer demand. Still, averages can move when the mix of jobs, hours, and workers changes, so real wage data should be read with other labor market measures.
How to convert a wage into constant dollars
Sometimes you want a real wage level instead of a growth rate. In that case, choose a base period and express the current wage in the purchasing power of that period.
Using July 2025 as the base period, multiply $37.62 by 322.169 divided by 332.813. The result is about $36.42 in July 2025 dollars. That means $37.62 in July 2026 had about the same broad purchasing power as $36.42 in July 2025, using the selected CPI U series.
Common mistakes to avoid
- Using different months. Wage and CPI dates need to match.
- Mixing seasonal adjustment. Do not compare a seasonally adjusted wage series with a not seasonally adjusted CPI rate unless you have a clear reason and explain it.
- Treating a CPI index level as an inflation rate. A CPI value such as 332.813 is an index. Inflation is the percentage change between two index values.
- Using subtraction as the exact formula. Nominal wage growth minus inflation is a useful shortcut, but the exact result comes from the ratio of growth factors.
- Mixing worker groups. The all employee wage series and the production and nonsupervisory series cover different groups. BLS also uses different CPI deflators for those real earnings series.
- Ignoring revisions. Recent Current Employment Statistics values can be revised. Seasonally adjusted CPI values can also change when seasonal factors are updated.
- Filling a missing CPI month without disclosure. BLS did not publish an all items CPI value for October 2025 because it could not collect the needed survey data during a lapse in federal appropriations. If a project requires an estimate for that month, label the estimate clearly and do not present it as an official published CPI value.
Limits of CPI based wage analysis
CPI based real wage growth is useful, but it is not a complete measure of personal financial well being.
CPI tracks average consumer price change. Your own cost of living can be different. A renter facing a large rent increase may feel more inflation than the national average. A homeowner with a fixed mortgage may feel less.
The calculation also leaves out taxes, bonuses, benefits, health insurance value, retirement contributions, and changes in hours worked. If you are studying total compensation, a wage only measure can miss an important part of the picture.
Regional prices can differ too. The national CPI U is useful for a broad U.S. view, but it does not mean every city or region had the same price change.
Finally, average hourly earnings can change because the mix of jobs changes. If more workers move into higher paying or lower paying industries, the average can shift even when individual workers receive no raise.
How to update this calculation every month
First, check the newest BLS Real Earnings, Employment Situation, and CPI releases. Record the data month, release date, series IDs, units, and seasonal adjustment status.
Next, replace the latest wage and CPI values in the worked example and data table. Recalculate nominal wage growth, CPI inflation, exact real wage growth, and the subtraction approximation.
Then update the chart and confirm that the chart and table use the same numbers. Mark preliminary wage data when BLS marks it preliminary. If BLS revises an earlier value, update the historical row too.
Change the page modified date only when the data or article meaningfully changes. A new date by itself does not make a page more useful.
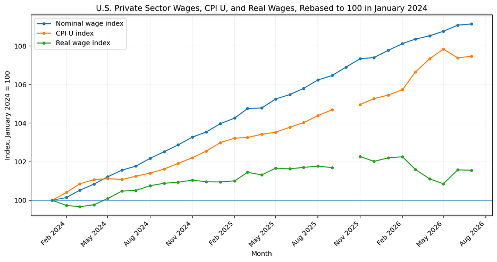
Monthly U.S. wage, CPI, and real wage trend
The chart rebases nominal average hourly earnings, seasonally adjusted CPI U, and the calculated real wage level to 100 in January 2024. Use Play to move through the months. October 2025 CPI is left missing because BLS did not publish the all items value for that month.
Latest 12 month comparison
These rates are calculated from the displayed seasonally adjusted series values for July 2025 and July 2026. BLS publishes rounded changes of 3.2 percent for hourly earnings, 3.3 percent for CPI U in the Real Earnings table, and −0.2 percent for real average hourly earnings.
Chart data table
| Date | Nominal wage | CPI U | Nominal wage growth | CPI inflation | Exact real wage growth | Approximate real wage growth |
|---|---|---|---|---|---|---|
| Jan 2024 | $34.47 | 309.698 | 4.39% | 3.09% | 1.26% | 1.30% |
| Feb 2024 | $34.52 | 310.967 | 4.13% | 3.16% | 0.95% | 0.98% |
| Mar 2024 | $34.65 | 312.345 | 4.15% | 3.49% | 0.64% | 0.66% |
| Apr 2024 | $34.76 | 313.023 | 3.98% | 3.36% | 0.60% | 0.62% |
| May 2024 | $34.89 | 313.175 | 4.15% | 3.24% | 0.88% | 0.90% |
| Jun 2024 | $35.01 | 313.044 | 3.92% | 2.97% | 0.92% | 0.95% |
| Jul 2024 | $35.08 | 313.569 | 3.63% | 2.94% | 0.67% | 0.69% |
| Aug 2024 | $35.22 | 314.062 | 3.92% | 2.61% | 1.28% | 1.32% |
| Sep 2024 | $35.34 | 314.732 | 3.91% | 2.43% | 1.45% | 1.48% |
| Oct 2024 | $35.46 | 315.631 | 4.05% | 2.58% | 1.43% | 1.47% |
| Nov 2024 | $35.60 | 316.528 | 4.18% | 2.72% | 1.43% | 1.47% |
| Dec 2024 | $35.69 | 317.604 | 4.08% | 2.87% | 1.18% | 1.21% |
| Jan 2025 | $35.84 | 318.961 | 3.97% | 2.99% | 0.95% | 0.98% |
| Feb 2025 | $35.94 | 319.679 | 4.11% | 2.80% | 1.28% | 1.31% |
| Mar 2025 | $36.11 | 319.785 | 4.21% | 2.38% | 1.79% | 1.83% |
| Apr 2025 | $36.12 | 320.302 | 3.91% | 2.33% | 1.55% | 1.59% |
| May 2025 | $36.28 | 320.620 | 3.98% | 2.38% | 1.57% | 1.61% |
| Jun 2025 | $36.36 | 321.435 | 3.86% | 2.68% | 1.14% | 1.18% |
| Jul 2025 | $36.47 | 322.169 | 3.96% | 2.74% | 1.19% | 1.22% |
| Aug 2025 | $36.62 | 323.291 | 3.98% | 2.94% | 1.01% | 1.04% |
| Sep 2025 | $36.70 | 324.245 | 3.85% | 3.02% | 0.80% | 0.83% |
| Oct 2025 | $36.85 | Missing | 3.92% | Missing | Missing | Missing |
| Nov 2025 | $37.00 | 325.063 | 3.93% | 2.70% | 1.20% | 1.24% |
| Dec 2025 | $37.02 | 326.031 | 3.73% | 2.65% | 1.05% | 1.07% |
| Jan 2026 | $37.15 | 326.588 | 3.66% | 2.39% | 1.23% | 1.26% |
| Feb 2026 | $37.27 | 327.460 | 3.70% | 2.43% | 1.24% | 1.27% |
| Mar 2026 | $37.35 | 330.293 | 3.43% | 3.29% | 0.14% | 0.15% |
| Apr 2026 | $37.41 | 332.407 | 3.57% | 3.78% | -0.20% | -0.21% |
| May 2026 | $37.49 | 333.979 | 3.34% | 4.17% | -0.80% | -0.83% |
| Jun 2026 | $37.60 | 332.568 | 3.41% | 3.46% | -0.05% | -0.05% |
| Jul 2026 | $37.62 | 332.813 | 3.15% | 3.30% | -0.15% | -0.15% |
Growth columns show change from the same month one year earlier. October 2025 CPI and real wage calculations are missing because BLS did not publish the all items CPI value for that month.
Frequently asked questions
What is real wage growth?
Real wage growth is the percentage change in wages after adjusting for inflation. It shows whether wages gained or lost broad purchasing power. If wages rise 4 percent while consumer prices rise 3 percent, real wage growth is positive. For an exact answer, compare the wage growth factor with the CPI growth factor.
How do you calculate real wage growth from CPI data?
Divide the current wage by the earlier wage. Divide the current CPI by the earlier CPI. Then divide the wage ratio by the CPI ratio, subtract 1, and multiply by 100. Use the same dates and a consistent seasonal adjustment basis for both series.
What is the difference between nominal wage growth and real wage growth?
Nominal wage growth measures how much pay changed in current dollars. Real wage growth adjusts that change for inflation. A worker can get a nominal raise while real wages fall if consumer prices rise even faster.
Which CPI should I use to adjust wages for inflation?
For broad U.S. analysis of all employees, CPI U is a common choice and is the index BLS uses for its all employee real earnings series. BLS uses CPI W for production and nonsupervisory employees. Choose the index that fits the worker group and question you are studying.
What does negative real wage growth mean?
Negative real wage growth means consumer prices rose faster than wages over the period being compared. It suggests that the average wage bought less of the selected CPI basket than before. It does not mean every household had the same experience.
Should CPI and wage data both be seasonally adjusted?
They should use a consistent basis. If you use seasonally adjusted wage data, use a matching seasonally adjusted CPI series when you want to reproduce the BLS style real earnings comparison. For some long term personal comparisons, not seasonally adjusted same month values or annual averages may be easier to explain. Do not mix the two without a reason.
Can I use this method to adjust my own salary for inflation?
Yes. Use your salary or hourly wage for two matching dates and CPI values for those same dates. The result gives a broad inflation adjustment. Your personal cost of living may differ because your housing, food, health care, transportation, taxes, and other costs may not move like the national average.
Conclusion
Real wage growth is easier to calculate when you keep the method consistent. Use wage and CPI values for the same periods. Calculate both growth factors. Then divide the wage factor by the CPI factor to get the exact real wage change.
For July 2025 to July 2026, displayed BLS seasonally adjusted values show nominal hourly wages rising about 3.15 percent while CPI U rose about 3.30 percent. The exact real wage result is about -0.15 percent, close to the BLS published decline of 0.2 percent.
The number is small, but the meaning is clear. Pay rose in dollars, yet consumer prices rose a little faster.
Methodology note
This article uses BLS Current Employment Statistics series CES0500000003 for average hourly earnings of all employees in the total private sector, seasonally adjusted. It uses seasonally adjusted CPI U, U.S. city average, All items, series CUSR0000SA0. The worked example compares July 2025 with July 2026. Exact real wage growth is calculated by dividing the wage ratio by the CPI ratio, subtracting 1, and multiplying by 100. Calculations use source values displayed by BLS and round final displayed results. The chart uses monthly BLS data from January 2024 through July 2026. The October 2025 all items CPI value is left missing because BLS did not publish it.
Primary sources
- BLS Real Earnings, July 2026
- BLS Employment Situation, July 2026
- BLS Consumer Price Index, July 2026
- BLS CPI series ID codes
- BLS handling of missing October 2025 data
- BLS Current Employment Statistics bulk data
- BLS CPI bulk data, All items
Data source: U.S. Bureau of Labor Statistics. This guide explains a broad CPI based wage adjustment and is not a measure of any one household's personal cost of living.
Downloads
Files attached to this article for your reference.