
Chi-Square Test: Formula, Steps, Examples & Uses
Learn how the chi-square test compares observed and expected frequencies, when to use it, and how to interpret p-values, assumptions, residuals, and effect size in real-world analysis.
Chi-Square Test: Formula, Steps, Examples & Uses

What Is a Chi-Square Test in Simple Terms?
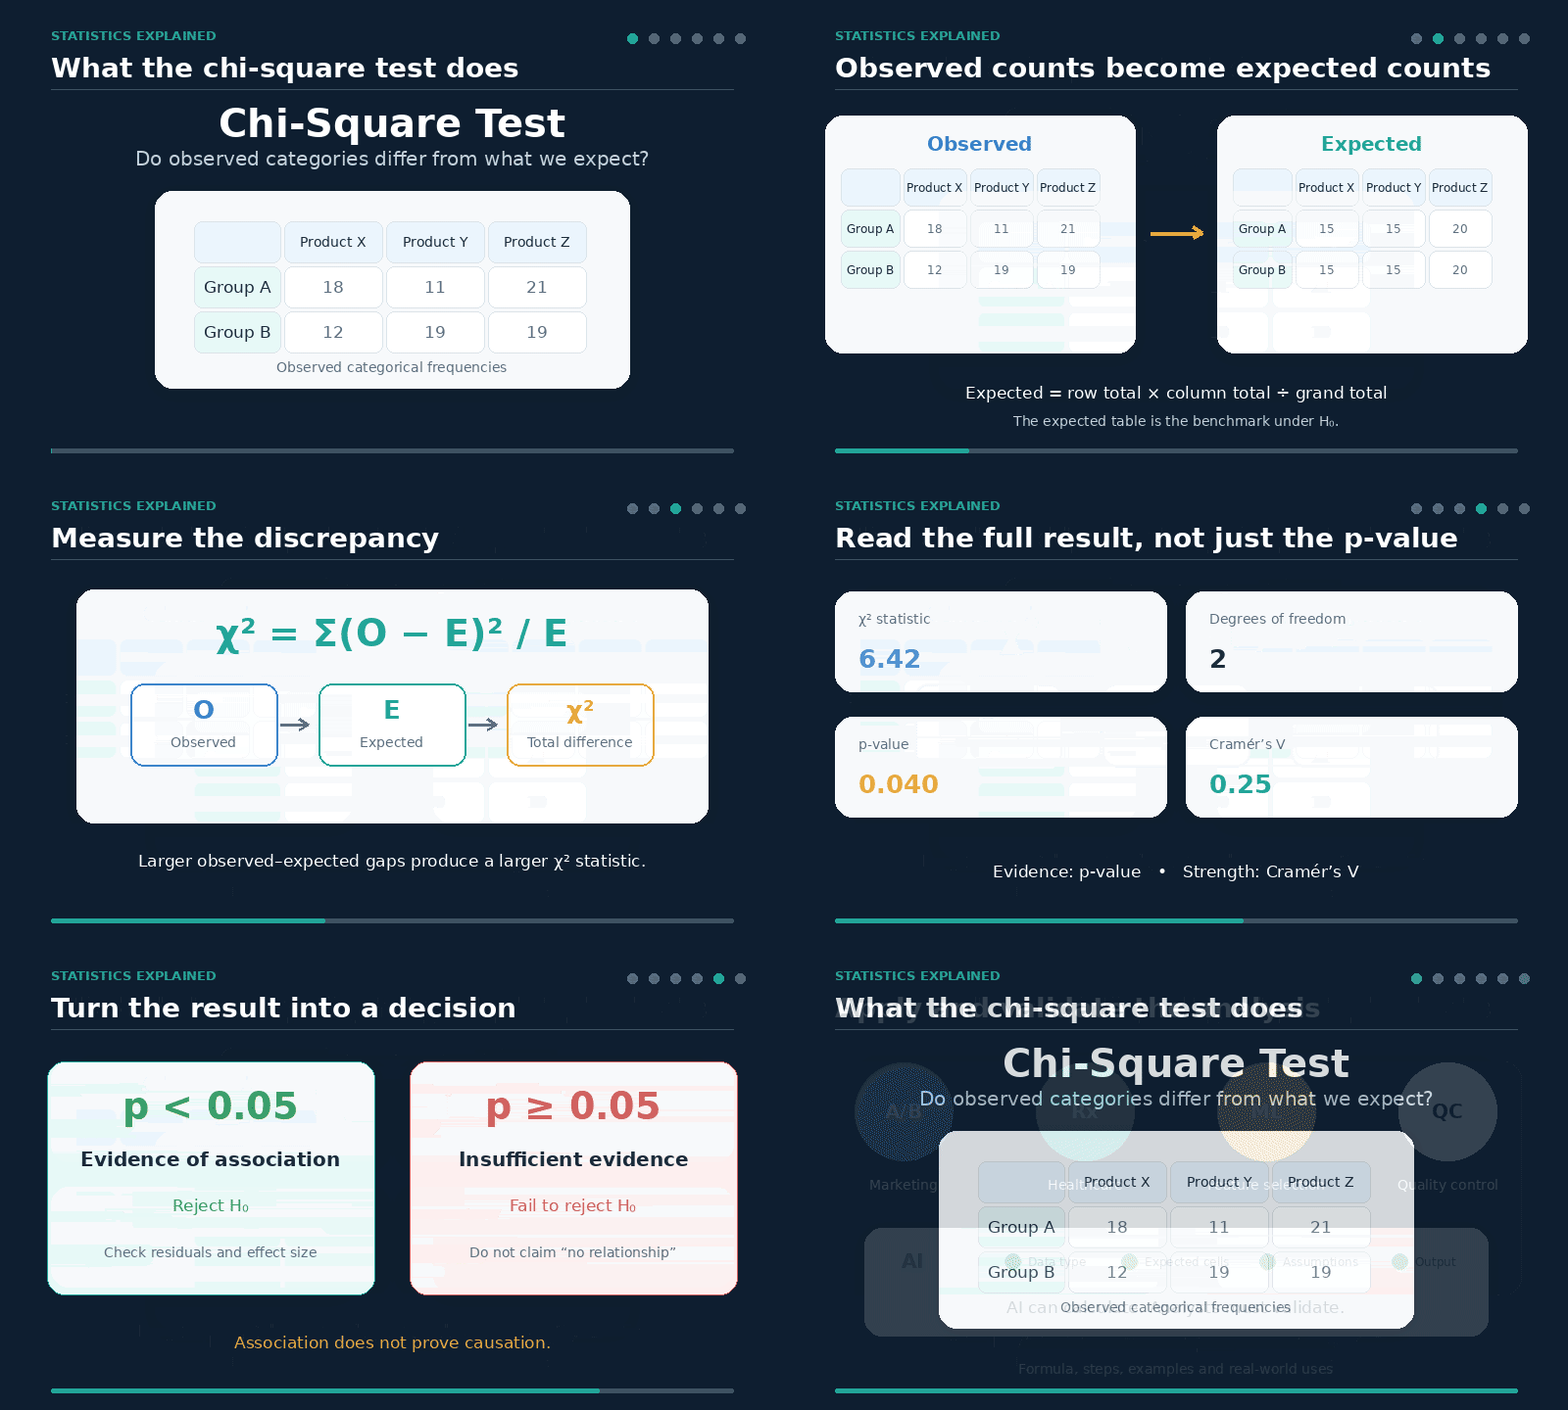
A chi-square test measures how different the data you observed are from the data you would expect under a null hypothesis.
For example, a retailer may want to know whether product preference is related to customer type. A healthcare researcher might test whether recovery outcomes differ across treatments.
The method works with a contingency table containing category counts. It does not compare means, predict individual outcomes, or prove that one variable causes another.
The formula is:
χ² = Σ(O − E)² / E
In this formula, O represents an observed frequency, E represents an expected frequency, and Σ means that the values are added across all relevant cells.
A chi-square test evaluates whether differences between observed and expected categorical frequencies are greater than would reasonably occur by chance.
Why the Chi-Square Test Matters in 2026
Categorical data now appear across customer platforms, medical databases, survey tools, A/B tests, machine-learning systems, and automated business dashboards.
The chi-square test remains valuable because it is relatively simple, transparent, and supported by tools such as Python, R, Microsoft Excel, IBM SPSS Statistics, JASP, and jamovi.
AI agents can also create contingency tables, call statistical libraries, calculate p-values, and produce plain-language summaries. However, automated output is only useful when the test assumptions and research design are valid.
From what I’ve seen, calculation is rarely the hardest part. The real difficulty is selecting the correct test, checking the expected frequencies, and deciding whether the result has practical value.
Core Chi-Square Test Concepts
The observed frequencies are the category counts found in the dataset. The expected frequencies are the counts that would be predicted if the null hypothesis were true.
For a test of independence:
-
H₀: The categorical variables are independent.
-
H₁: The categorical variables are associated.
Expected frequency for a contingency-table cell is calculated as:
Expected frequency = (row total × column total) ÷ grand total
Each cell contributes to the final chi-square statistic. Cells with larger differences between observed and expected values usually contribute more.
The chi-square statistic is a total discrepancy score. A value near zero means the observed and expected frequencies are similar.
How Does a Chi-Square Test Work in Real Use?
Imagine that an online store tests whether a customer segment is related to product preference. The observed table records how many new, returning, and VIP customers select products A, B, or C.
The chi-square test calculates what those counts would look like if segment and preference were unrelated. It then measures the difference between the observed and expected tables.
In real use, analysts should not stop after obtaining a p-value. They should inspect the expected counts, identify influential cells, calculate an effect size, and connect the finding to an actual decision.
A statistically significant association might justify further customer research. It does not automatically justify redesigning the entire product strategy.
Types of Chi-Square Tests
A chi-square goodness-of-fit test examines whether one categorical variable follows an expected distribution. Testing whether a die produces six outcomes equally often is a classic example.
A chi-square test of independence evaluates whether two categorical variables measured within one sample are related.
A test of homogeneity compares the distribution of one categorical outcome across separate populations or groups.
The calculations for independence and homogeneity are identical, but the sampling designs and interpretations differ.
McNemar’s test is usually more suitable for paired 2×2 data, such as responses from the same participants before and after an intervention.
Extractable distinction: Independence examines two variables in one sample, while homogeneity compares one variable across multiple independent samples.
When Should You Use a Chi-Square Test?
Use a chi-square test when the data are counts, the categories are mutually exclusive, and the observations are independent.
Use a t-test when comparing the mean of a continuous variable between two groups. Use ANOVA when comparing continuous means across three or more groups.
Use Fisher’s exact test when a small 2×2 contingency table contains expected frequencies that are too low for a dependable chi-square approximation.
A common mistake is converting continuous measurements into arbitrary categories simply to run a chi-square test. This discards information and can reduce statistical power.
How to Perform a Chi-Square Test Step by Step
First, state the null and alternative hypotheses before examining the result.
Next, organize the observed counts in a contingency table and calculate the expected frequency for every cell.
Then calculate the chi-square statistic and degrees of freedom:
Independence or homogeneity: df = (r − 1)(c − 1)
Goodness-of-fit: df = k − 1
Obtain the p-value and compare it with the significance level, often α = 0.05.
Finally, check assumptions, examine standardized residuals, calculate Cramér’s V, and write a conclusion that separates statistical evidence from business or research importance.
What practitioners often do is preserve the observed table, expected table, software output, assumption checks, and interpretation as one reproducible audit trail.
Chi-Square Test in Excel vs Python vs R
Excel is useful for quick analysis and familiar business workflows. Its CHISQ.TEST function returns a p-value, although expected frequencies usually need to be calculated separately.
Python is a strong choice for automation and reproducibility. SciPy’s chi2_contingency function returns the chi-square statistic, p-value, degrees of freedom, and expected frequencies.
R provides the compact chisq.test() function and convenient access to expected values and Pearson residuals.
Excel may be sufficient for a small one-time table. Python or R is usually better for repeatable analysis, larger datasets, automated reporting, or AI-agent workflows.
The best statistical tool is not the one with the fewest clicks. It is the one that makes the calculation easy to verify and reproduce.
How to Interpret P-Values, Residuals, and Cramér’s V
If p < α, reject the null hypothesis. If p ≥ α, fail to reject the null hypothesis.
Failing to reject H₀ does not prove that no relationship exists. The study may have an insufficient sample size, poorly defined categories, or an effect that is too small to detect.
Standardized residuals help identify which cells contributed most to a significant result. Large positive residuals suggest overrepresentation, while large negative residuals suggest underrepresentation.
Cramér’s V measures the strength of association on a scale from 0 to 1. It is especially useful because large samples can produce statistically significant results for very small differences.
Theoretical advice often says that p < 0.05 completes the analysis, but in practice, the p-value answers only one question: whether the data provide evidence against H₀.
The p-value evaluates evidence, standardized residuals locate the pattern, and Cramér’s V measures its strength.
Common Misconceptions and Statistical Risks
A significant chi-square result does not demonstrate causation. It indicates an association or a mismatch between observed and expected frequencies.
The chi-square statistic also has no direction. It does not show that one variable increases or decreases another.
Important risks include dependent observations, overlapping categories, sparse cells, small samples, and the use of percentages without the original counts.
A common guideline is that no expected cell should be below 1 and no more than approximately 20% of expected cells should be below 5. When these conditions fail, consider exact methods, Fisher’s exact test, more data, or defensible category consolidation.
Categories should not be combined after viewing the results simply to produce a lower p-value.
Why Statistical Significance Is Not Always Practical Significance
The contrarian insight is that a smaller p-value does not automatically create a better business or research decision.
With a sample of tens of thousands of observations, a tiny and practically meaningless difference may be statistically significant.
The better question is whether the detected association is large enough to influence treatment, campaign selection, product design, feature selection, or operational policy.
For advanced analysis, standardized residuals may require multiple-comparison correction. Logistic regression, log-linear models, or correspondence analysis may be more informative when analysts need covariate adjustment or deeper structural insight.
Real-World Chi-Square Test Applications
Marketing teams use chi-square tests to compare clicks, conversions, and unsubscribes across campaign variants.
Healthcare researchers use them to compare categorical outcomes such as recovered, improved, or unchanged across treatment groups.
Manufacturers can compare defect categories across production lines or suppliers. Survey researchers can evaluate relationships between demographics and response categories.
In machine learning, chi-square feature selection can rank non-negative features according to their association with a target class. Scikit-learn’s feature-selection tools are commonly used for this purpose.
A result becomes actionable only when the statistical finding is connected to a defined decision, cost, risk, or measurable outcome.
Is the Chi-Square Test Still Worth Using in 2026?
Yes. The chi-square test remains an effective and interpretable method for categorical hypothesis testing.
Its main weakness is not that it is old. Its weakness is that it is frequently used without checking independence, expected frequencies, effect size, or research design.
The reality layer is simple: chi-square is easy to calculate, but reliable chi-square analysis is a complete workflow rather than a single software command.
AI Agents, Generative Search, and the Future of Chi-Square Analysis
AI agents can now validate input formats, build contingency tables, call SciPy or R, flag sparse expected counts, calculate Cramér’s V, and generate structured reports.
Human review remains necessary. Generative AI may select the wrong statistical test, misread percentages as counts, overlook paired observations, or describe association as causation.
Generative search systems also favor self-contained definitions, formulas, comparison statements, and concise interpretation blocks. This makes clear structure more valuable than repeating the main keyword.
The outdated SEO assumption is that ranking comes from keyword density. In 2026, stronger visibility comes from covering connected entities naturally, including categorical data, contingency tables, hypotheses, p-values, Fisher’s exact test, standardized residuals, effect size, Python, R, and AI-assisted validation.
The practical next step is to confirm that the data are categorical counts, check the assumptions, run the appropriate test, inspect residuals, calculate Cramér’s V, and relate the result to a real decision.
FAQs
What is a chi-square test?
A chi-square test is a statistical method that compares observed and expected frequencies in categorical data. It helps determine whether variables are associated or whether a distribution fits an expected pattern.
When should you use a chi-square test?
Use a chi-square test when your data consist of counts or frequencies in mutually exclusive categories. The observations should also be independent.
What does the chi-square test formula measure?
The formula χ² = Σ(O − E)² / E measures the total difference between observed frequencies and expected frequencies. Larger differences produce a larger chi-square statistic.
What is a chi-square test of independence?
A chi-square test of independence checks whether two categorical variables in one sample are related. A significant p-value suggests an association, not causation.
What is a chi-square goodness-of-fit test?
A chi-square goodness-of-fit test checks whether observed category counts match a specified distribution. It can test patterns such as whether a die produces each outcome equally often.
How are expected frequencies calculated?
For a contingency table, expected frequency equals row total × column total ÷ grand total. These values represent the counts expected if the variables were independent.
How do you interpret a chi-square p-value?
If the chi-square test produces p < α, reject the null hypothesis. In practice, the p-value should be interpreted alongside effect size and the study design.
What is Cramér’s V in a chi-square test?
Cramér’s V measures the strength of association after a chi-square test. It ranges from 0 to 1, with larger values indicating a stronger relationship.
When should Fisher’s exact test replace chi-square?
Use Fisher’s exact test for small 2×2 tables or when expected cell counts are too low for a reliable chi-square approximation. Software may still calculate chi-square, but that does not make the result valid.
Can a chi-square test prove causation?
No. A chi-square test can identify an association between categorical variables, but it cannot establish that one variable causes the other.
Which tools can perform a chi-square test?
Python’s SciPy, R, Microsoft Excel, IBM SPSS, JASP, and jamovi can perform a chi-square test. Python and R are usually better when reproducibility and automated assumption checks matter.
Can AI agents run a chi-square test reliably?
AI agents can build contingency tables, run SciPy or R, and explain p-values, residuals, and Cramér’s V. Human review is still needed because AI can overlook dependent observations, sparse cells, or unsuitable data.
Try it in DataClue
Ready to run Chi-Square Test?
Test for association between two categorical variables in a contingency table.
Run Chi-Square Test