
Cohen's d Calculator: Formula, Examples & Interpretation
Cohen's d Calculator: Formula, Examples & Interpretation
Cohen's d Calculator: Formula, Examples & Interpretation
Cohen’s d expresses the difference between two means in standard-deviation units. A Cohen’s d calculator helps quantify how large that difference is, but the calculation is only meaningful when the formula matches the study design and the result is interpreted with its uncertainty and research context.
For example, d = 0.50 means the two means are separated by about half of the standard deviation used as the standardizer. It does not automatically mean the difference is practically important, statistically significant, or causal.
| The high-impact rule: choose the study design before choosing the formula. Independent groups, paired measurements, and one-sample comparisons can use different standardizers, even though all may be described informally as “Cohen’s d.” |
|---|
Cohen’s d Calculator
For two independent groups, enter each group’s mean, standard deviation, and sample size. A strong calculator should return the pooled standard deviation, signed Cohen’s d, Hedges’ g, and a clearly identified confidence interval method.
| Input | Group 1 | Group 2 |
|---|---|---|
| Mean | M1 | M2 |
| Standard deviation | SD1 | SD2 |
| Sample size | n1 | n2 |
| Study-design checkpoint: use the independent-groups calculation only when the groups contain independent observations. For paired/repeated measurements or a one-sample comparison, use the corresponding standardized effect definition. |
|---|
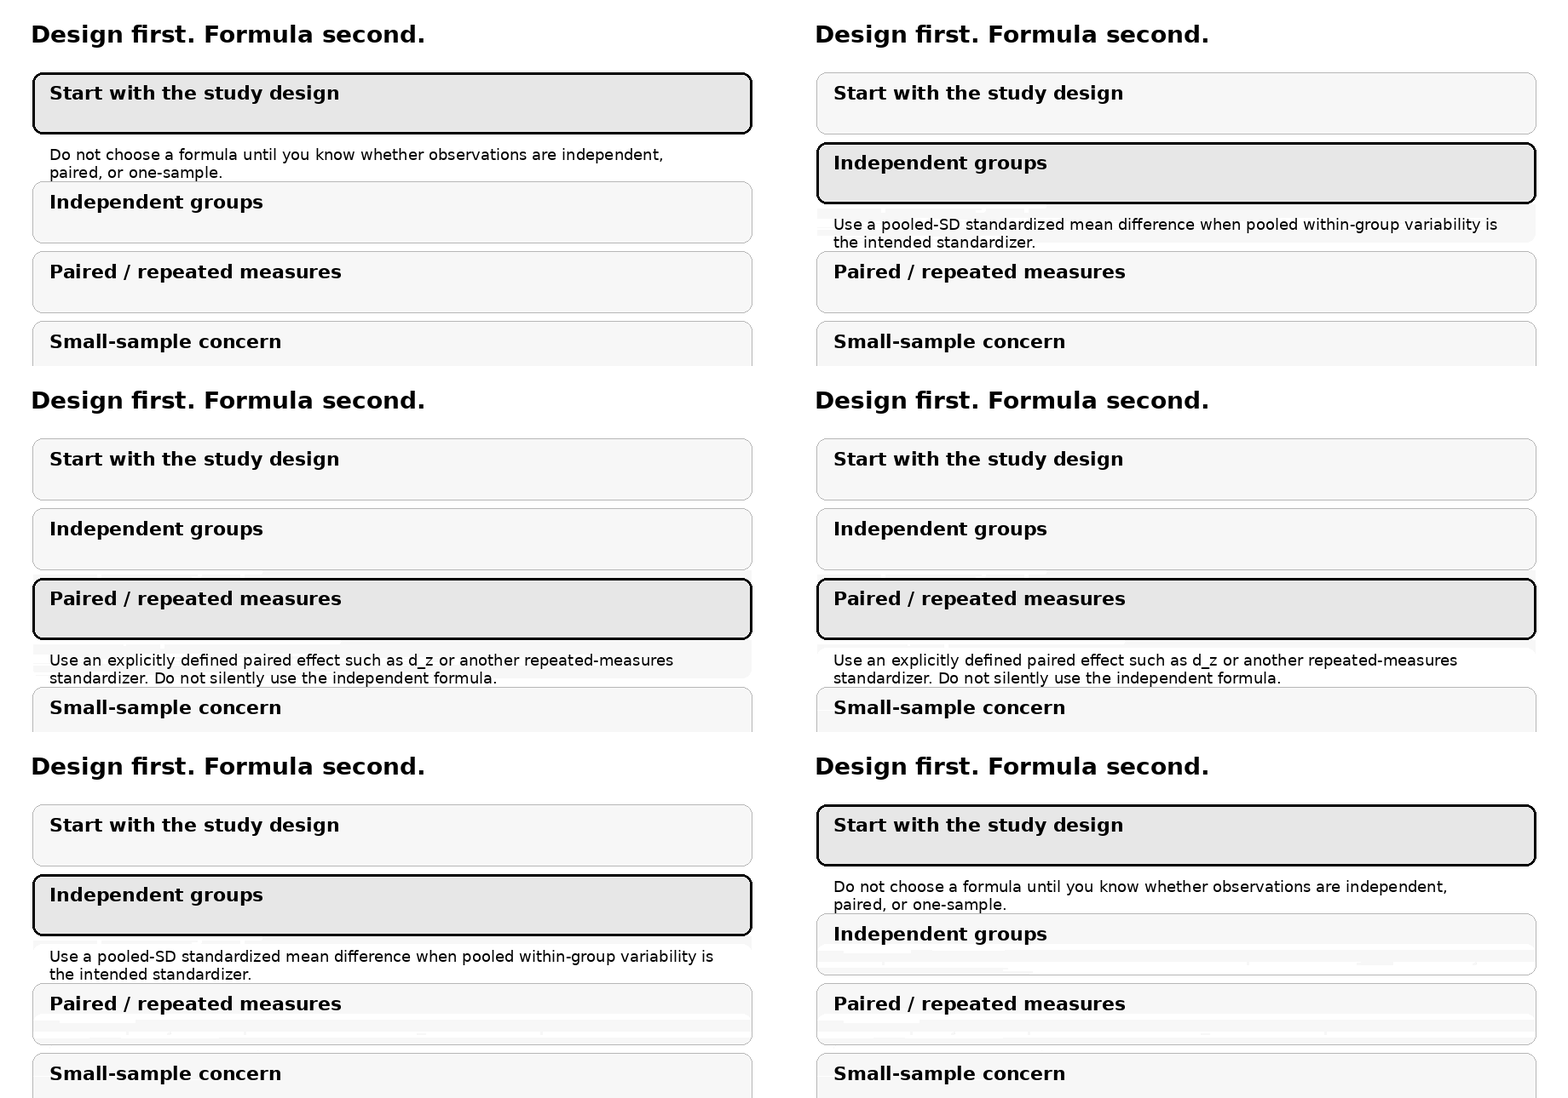
Design first, formula second. A calculator should prevent the most consequential error: applying an independent-groups denominator to paired observations.
What Is Cohen’s d in Simple Terms?
Cohen’s d is a standardized mean difference. It takes a difference between means and expresses that difference relative to variability. That makes the result scale-free: a difference can be described in standard-deviation units rather than the original measurement units.
Suppose one group has a mean of 85 and another a mean of 77. The raw difference is eight points. Whether eight points is modest or substantial depends partly on how spread out the observations are. If the relevant standard deviation is about 12, the standardized difference is roughly 8 / 12 = 0.67.
This is why Cohen’s d is useful in research synthesis and study planning: it can place effects from different measurement scales on a common standardized metric, provided the chosen standardizer is substantively appropriate ().
Cohen’s d Formula for Two Independent Groups
For two independent groups, the commonly used sample standardized mean difference is:
d = (M1 - M2) / SDpooled
The pooled standard deviation is:
SDpooled = sqrt{[(n1 - 1)SD1² + (n2 - 1)SD2²] / (n1 + n2 - 2)}
The numerator gives the direction and raw size of the mean difference. The denominator places that difference on a common scale using within-group variability. Sample sizes enter the pooled variance through the groups’ degrees of freedom, so larger groups contribute more information to the pooled estimate.
A positive value means Group 1 has the higher mean under the subtraction order shown. A negative value means Group 1 has the lower mean. Reversing the group order reverses the sign but leaves the absolute magnitude unchanged.
Worked Example: Treatment vs. Control
| Treatment | Control | |
|---|---|---|
| Mean | 85.5 | 77.2 |
| SD | 12.3 | 11.8 |
| n | 42 | 38 |
The mean difference is 85.5 - 77.2 = 8.3. Using the pooled-variance formula gives a pooled SD of approximately 12.07.
d = 8.3 / 12.07 ≈ 0.69
The most defensible first interpretation is: the treatment mean is about 0.69 pooled standard deviations higher than the control mean.
Using Cohen’s conventional reference values, 0.69 falls between the 0.5 “medium” and 0.8 “large” reference points. That label is secondary to the substantive interpretation. The practical importance of the result depends on the outcome, prior evidence, measurement quality, consequences, and uncertainty.
How to Interpret Cohen’s d Without Turning It Into a Label Generator
Jacob Cohen’s influential conventions use approximately 0.2, 0.5, and 0.8 as small, medium, and large reference values (). They are useful when no better benchmark exists, but they should not be treated as natural boundaries.
| Absolute d | Conventional description | Better wording |
|---|---|---|
| < 0.20 | Very small / below Cohen’s small reference | Describe the standardized distance and context rather than dismissing it automatically. |
| 0.20 to < 0.50 | Small | A modest standardized difference; practical importance depends on the outcome. |
| 0.50 to < 0.80 | Medium | A noticeable standardized difference relative to within-group variability. |
| ≥ 0.80 | Large | Substantial standardized separation under Cohen’s convention, not automatic proof of practical importance. |
Methodological guidance cautions against interpreting these values without considering prior research and real consequences ().
| Important: “medium” is not a scientific conclusion. A d of 0.49 and 0.51 are practically indistinguishable unless the domain provides a meaningful threshold. The estimate, its interval, and the decision context matter more than which side of a conventional category boundary it falls on. |
|---|
What about “very large” and “huge” effects?
Later rules of thumb expanded Cohen’s three commonly cited reference points. Those expanded labels should not be attributed to Cohen. Sawilowsky (2009), for example, proposed 1.2 as “very large” and 2.0 as “huge” ().
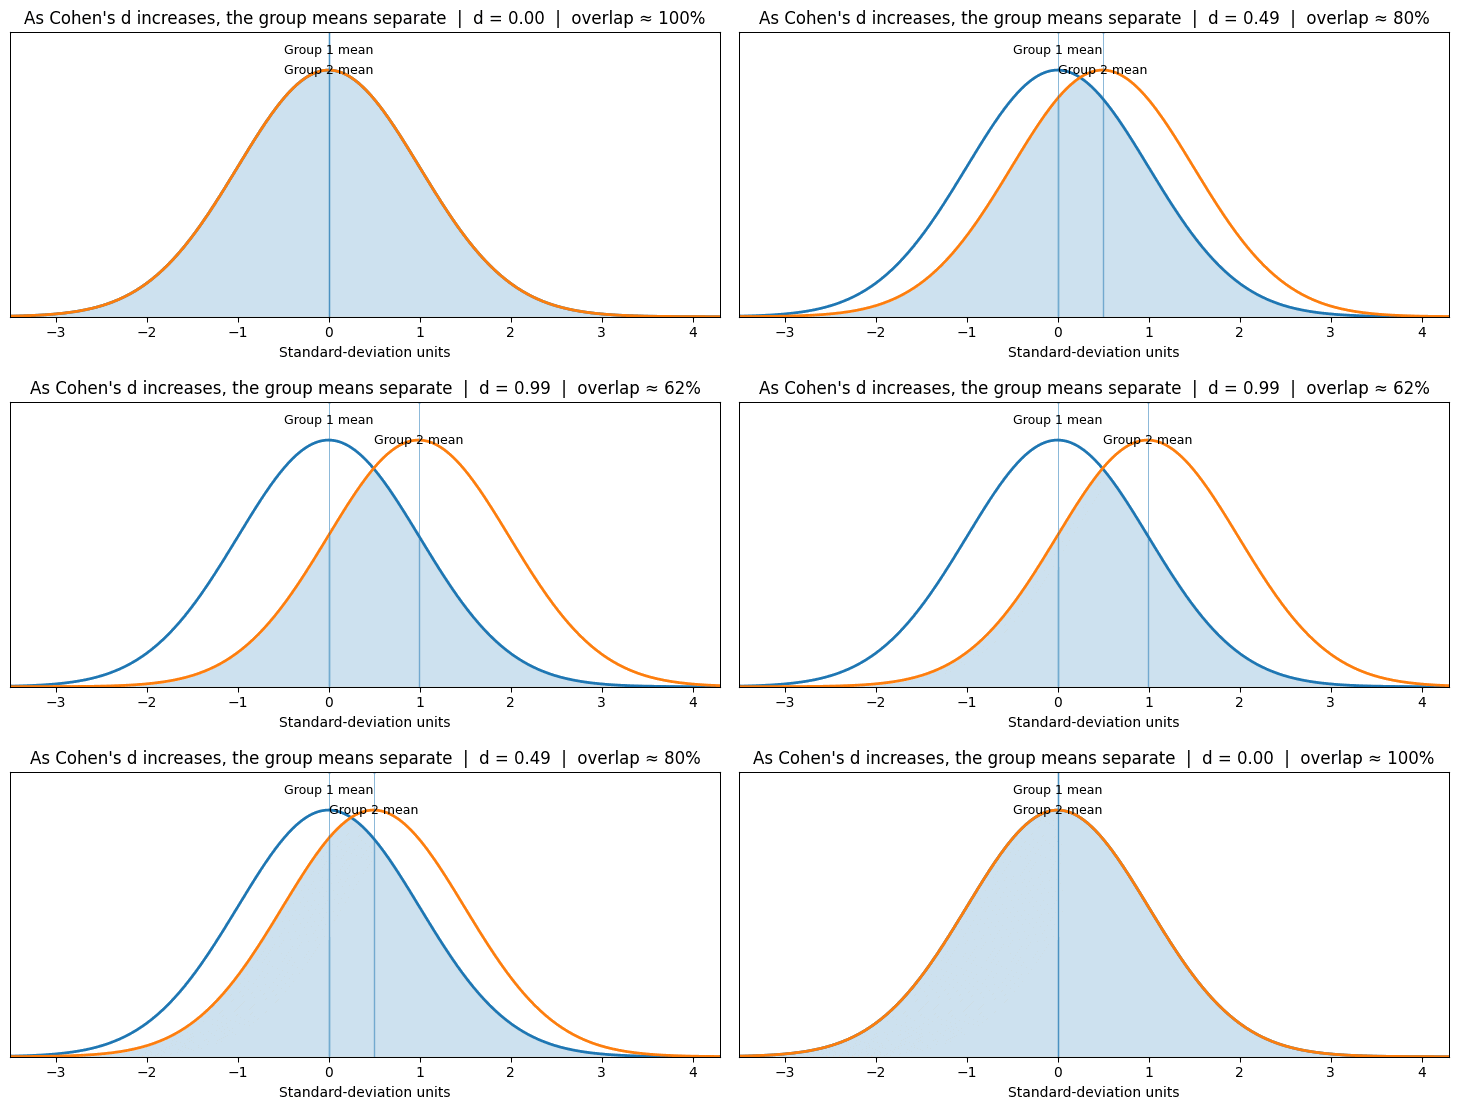
Illustration under an equal-variance normal model: larger absolute d moves the means farther apart. Overlap is a visual aid, not a universal interpretation rule.
What Does a Negative Cohen’s d Mean?
A negative Cohen’s d indicates direction, not quality. If Group 1 has a mean of 70, Group 2 has a mean of 80, and the pooled SD is 10, then d = -1.0. The groups are one pooled standard deviation apart, with Group 1 lower.
Use the absolute value when discussing magnitude, but preserve the sign when direction matters. Also avoid describing a negative d as automatically harmful. Lower scores may be beneficial for outcomes such as symptom severity, errors, response time, or blood pressure.
Confidence Intervals: A Large d Can Still Be Uncertain
A point estimate tells you the estimated effect. A confidence interval tells you how precisely that effect has been estimated under the model and interval procedure used.
A convenient large-sample approximation for independent groups is:
SEd ≈ sqrt{(n1 + n2)/(n1 n2) + d²/[2(n1 + n2)]}
An approximate 95% interval is:
d ± 1.96 × SEd
For the worked example, SE is about 0.23, giving an approximate 95% CI of about [0.24, 1.14]. The point estimate is 0.69, but the interval makes clear that the population effect is not known with high precision.
Different statistical packages can use different interval procedures. The normal approximation above is transparent and convenient, but specialized methods can be preferable, particularly with small samples. The method should be documented rather than presenting all confidence intervals as interchangeable.
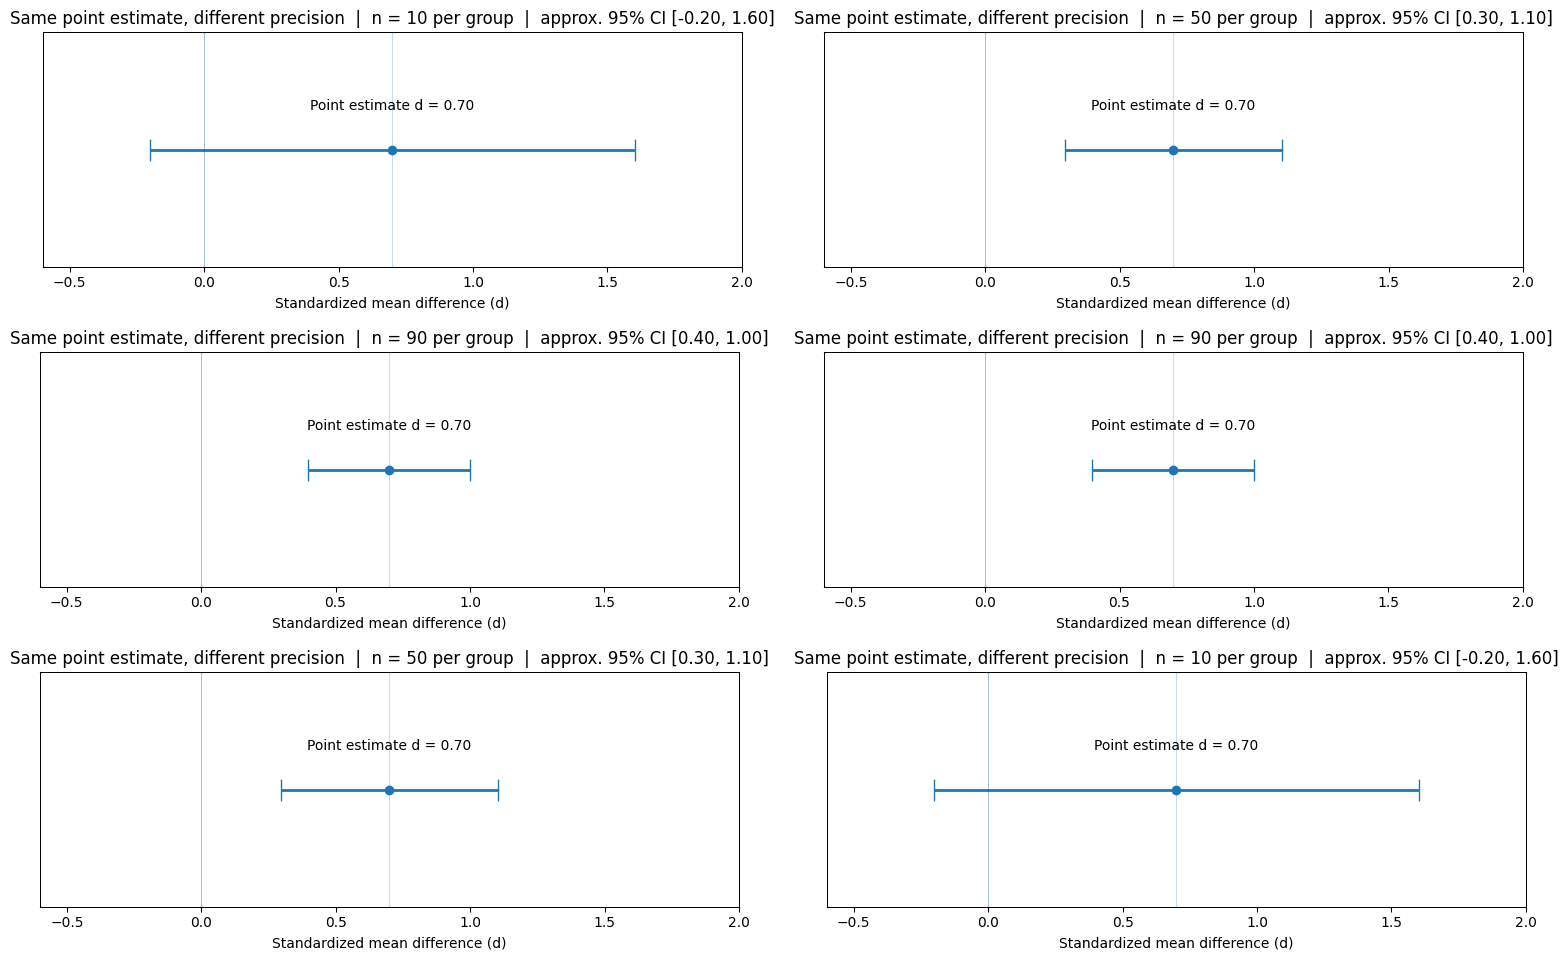
Sample size changes precision more directly than it changes the meaning of d. The same point estimate can be estimated very imprecisely or quite precisely.
Cohen’s d vs. Hedges’ g vs. Glass’s Delta
These measures are related, but they do not make exactly the same standardization choice.
| Measure | Standardizer | When it is useful |
|---|---|---|
| Cohen’s d | Pooled SD for the usual independent-groups version | Independent group means when pooled within-group variability is a meaningful reference. |
| Hedges’ g | Bias-corrected pooled-SD standardized difference | When finite-sample bias matters; commonly used for standardized mean differences in meta-analysis. |
| Glass’s Δ | Comparator/control SD | When the intervention may affect variability and the control SD is the intended reference. |
Hedges’ g applies a correction that reduces positive small-sample bias. There is no magic sample-size boundary where Cohen’s d suddenly changes from wrong to right; the bias decreases gradually as sample size grows. Lakens discusses the correction, and the Cochrane Handbook uses Hedges’ adjusted g for standardized mean differences in Cochrane Reviews (; ).
Glass’s delta is relevant when pooling SDs would answer the wrong substantive question. The Cochrane Handbook notes that Glass’s delta uses the comparator SD when intervention-induced changes in variability should not determine the standardizer ().
Independent vs. Paired Cohen’s d: Why Study Design Comes First
For independent groups, the usual denominator is a pooled within-group SD. For paired or repeated measurements, the observations are correlated, and several standardized effect definitions are possible.
One common paired effect is dz, which divides the mean difference by the SD of the difference scores. Other repeated-measures standardizers are used when the goal is comparability with between-subject designs. This is why a paired-samples calculator can legitimately return a different value from an independent-groups calculator even when the two mean values look similar.
Lakens recommends identifying which version of the effect has been calculated because the label “Cohen’s d” can otherwise hide different denominators and interpretations ().
| Suitability statement: use the independent-groups calculator only when the two groups contain independent observations and pooled within-group variability is the standardizer you intend to use. |
|---|
Cohen’s d and Statistical Significance Answer Different Questions
A p-value does not tell you how practically important a difference is, and Cohen’s d does not by itself tell you whether a null-hypothesis test is statistically significant.
More precisely, a p-value summarizes how compatible the observed data are with a specified null model and test procedure. Cohen’s d estimates the standardized magnitude and direction of a mean difference. A large sample can provide strong statistical evidence for a small standardized effect, while a small study can produce a large d with a wide confidence interval.
For research reporting, effect size, uncertainty, and inferential test results should be treated as complementary rather than substitutes. APA research reporting resources emphasize transparent effect-size and confidence-interval reporting where applicable ().
How Much Do the Two Distributions Overlap?
Overlap can make a standardized effect easier to visualize, but only under explicit distribution assumptions. For two normal populations with equal standard deviations, the overlap coefficient is:
OVL = 2Φ(-|d| / 2)
| d | Approximate overlap under this model |
|---|---|
| 0.2 | 92% |
| 0.5 | 80% |
| 0.8 | 69% |
| 1.0 | 62% |
| 2.0 | 32% |
Do not confuse distribution overlap with Cohen’s U3 or probability of superiority. Those are different transformations that answer different questions. If a calculator presents several intuitive translations of d, each should be named explicitly so users do not treat them as interchangeable.
Why Different Cohen’s d Calculators Can Give Different Answers
Different results do not automatically mean one calculator is broken. The tools may be calculating different members of the standardized-mean-difference family or using different uncertainty procedures.
Before comparing outputs, check the study design, the SD used in the denominator, whether the sign has been discarded, whether Hedges’ correction is applied, and how the confidence interval is calculated. For paired data, also check whether the calculator uses the SD of difference scores, an average SD, or another repeated-measures standardizer.
This is a practical reason to prefer calculators that expose their formulas and assumptions. A transparent calculation is easier to audit than a result that simply says “medium effect.”
Common Mistakes to Avoid
Using the independent formula for paired data. This changes the denominator and can materially change the effect estimate.
Treating 0.2, 0.5, and 0.8 as universal scientific cutoffs. They are conventional reference points. Domain evidence and consequences should take priority when available.
Ignoring direction. The absolute value is useful for magnitude, but the sign carries information about which group is higher.
Calling a large d “statistically significant.” Significance requires an inferential procedure; d alone is an effect-size estimate.
Assuming small samples make Cohen’s d unusable. The issue is finite-sample bias and uncertainty, not a single universal cutoff. Hedges’ g is a practical correction.
Ignoring unequal variability. If the SDs differ for substantively meaningful reasons, ask whether pooling them is appropriate rather than treating the pooled denominator as automatic.
Reporting a point estimate without uncertainty. A d of 0.8 with a narrow interval and a d of 0.8 with a very wide interval support different levels of confidence.
How to Calculate Cohen’s d in Excel
With Group 1 mean, SD, and n in B2:B4 and Group 2 values in C2:C4, calculate the pooled standard deviation with:
=SQRT(((B4-1)*B3^2+(C4-1)*C3^2)/(B4+C4-2))
=(B2-C2)/D6
=SQRT((B4+C4)/(B4*C4)+(D7^2)/(2*(B4+C4)))
=D7-1.96*D8
=D7+1.96*D8
The first formula returns the pooled SD; the second returns Cohen’s d if the pooled SD is in D6; the third gives the approximate standard error; the final two produce approximate 95% confidence limits. For publication-level work, document the approximation and use appropriate statistical software if a specialized interval method is required.
How to Report Cohen’s d in a Research Paper
A good results sentence makes the group comparison, direction, standardized effect, and uncertainty clear enough for another reader to understand what was estimated.
| Example: “The treatment group scored higher (M = 85.5, SD = 12.3) than the control group (M = 77.2, SD = 11.8), with an independent-groups standardized mean difference of d = 0.69, approximate 95% CI [0.24, 1.14].” |
|---|
If a hypothesis test was conducted, report its test statistic and p-value according to the target journal or reporting standard. Avoid compressing different claims into a sentence such as “there was a significant medium effect, d = 0.69.” “Significant” usually refers to an inferential test; “medium” is only a conventional magnitude label.
APA’s JARS framework is designed to improve transparency in quantitative research reporting, and APA journal standards commonly emphasize effect sizes and confidence intervals. Requirements can vary by journal, so the target publication’s instructions should still be checked ().
Frequently Asked Questions About Cohen’s d
What is a good Cohen’s d?
There is no universally “good” value. Judge the effect against the outcome, prior evidence, costs, benefits, and decision context. Cohen’s 0.2, 0.5, and 0.8 values are rough reference points.
Is Cohen’s d = 0.5 a medium effect?
Yes. It is Cohen’s conventional medium reference value, but that label does not establish practical importance.
Is Cohen’s d = 0.8 large?
Under Cohen’s convention, yes. A better report also states what 0.8 standard deviations means for the outcome and how precise the estimate is.
Can Cohen’s d be greater than 1 or 2?
Yes. Cohen’s d is not restricted to -1 to +1. Values above 1 mean the group means are separated by more than one standard deviation under the chosen standardizer.
Can Cohen’s d be negative?
Yes. The sign shows direction. Reverse the group order and the sign reverses, while the absolute magnitude remains the same.
Does sample size affect Cohen’s d?
Sample size affects weighting in the pooled SD, small-sample bias, and especially precision. It does not mechanically make d larger in the way increasing sample size can increase a test statistic.
Should I use Cohen’s d or Hedges’ g?
Use the effect definition that matches your purpose. Hedges’ g is bias-corrected and is especially useful when small-sample bias matters or standardized effects are being synthesized in meta-analysis.
Can I calculate Cohen’s d from a t-test?
Yes, for appropriate designs, but the conversion depends on whether the test is independent, paired, or one-sample.
Do I need a confidence interval?
For research reporting, a confidence interval is strongly useful because it shows precision. Exact requirements depend on the target journal or standard.
Cohen’s d Calculator: The Practical Takeaway
The best use of a Cohen’s d calculator is not to generate a small, medium, or large label. It is to estimate a standardized difference that matches the research design and then interpret that estimate with direction, uncertainty, and domain context.
For independent groups, calculate the mean difference relative to pooled within-group variability. For small-sample concerns, consider Hedges’ g. For paired data, use a clearly defined repeated-measures effect rather than silently applying the independent formula. If the original measurement units are inherently meaningful, report the raw mean difference as well rather than assuming standardization is always more informative.
The next sensible action is: choose the study design, calculate the appropriate effect, inspect its confidence interval, and only then decide what the magnitude means in the real research context.
References and Further Reading
- Cohen, J. (1988). Statistical Power Analysis for the Behavioral Sciences (2nd ed.). Routledge.
- Lakens, D. (2013). Calculating and reporting effect sizes to facilitate cumulative science: A practical primer for t-tests and ANOVAs. Frontiers in Psychology, 4, 863.
- Cochrane Handbook, Chapter 6: Choosing effect measures and computing estimates of effect.
- Sawilowsky, S. S. (2009). New Effect Size Rules of Thumb. Journal of Modern Applied Statistical Methods, 8(2), 597–599.
- American Psychological Association. APA Style Journal Article Reporting Standards and research standards/disclosures.