
Correlation and Rank Correlation in Statistics
A complete teaching guide to grouped Pearson correlation, Spearman rank correlation, tied ranks, concordance W, and full regression and correlation revision.
Advanced Correlation and Rank Correlation in Statistics: Grouped Data, Spearman, Tied Ranks, and Concordance
A complete teaching guide to grouped Pearson correlation, Spearman rank correlation, tied ranks, concordance W, and full regression and correlation revision.
Contents- What you should be able to do after this lesson
- Quick prerequisite recap: how the chapter fits together
- Part A: Pearson correlation for grouped data
- Part B: Spearman rank correlation
- Part C: coefficient of concordance W
- Full regression and correlation revision map
- Which method should I use?
- Common mistakes and how to fix them
- Practice questions
- Practice answer key
- Final concept summary
- Reader FAQ
Two students may earn similar scores in Math and Statistics. A school may also store grades only in class intervals. In another setting, two judges may rank projects from first to tenth. If a third judge joins, the problem changes again. These situations are related, but they do not use the same calculation.
This lesson explains correlation and rank correlation in statistics as one connected topic. You will see when Pearson correlation works, how grouped observations are handled, why Spearman rank correlation uses ranks, how ties change a rank calculation, and how concordance W measures agreement among several judges.
The main numerical examples come from the attached regression and correlation chapter. The grouped data example is from book pages 411 and 412. The Spearman and tied rank material is from pages 414 through 417. Concordance W is from pages 417 and 418. Earlier chapter pages support the short revision of scatter diagrams, regression, standard error, R squared, and Pearson correlation.
What you should be able to do after this Article
- Explain what correlation measures and what it does not prove.
- Read a bivariate frequency table and identify the two variables.
- Use class midpoints when raw observations have been grouped into intervals.
- Calculate Pearson correlation for grouped data with coded values.
- Calculate Spearman rank correlation when two rank lists have no ties.
- Assign average ranks and handle tied ranks using the textbook methods.
- Interpret the coefficient of concordance W for several judges.
- Choose between regression, Pearson correlation, Spearman correlation, and concordance W.
Quick prerequisite recap: how the fits together
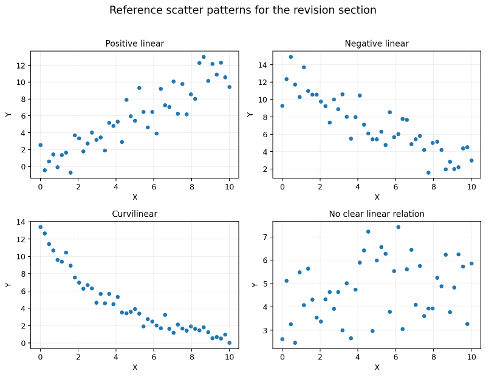
Before using a correlation formula, look at the data. A scatter diagram can show a positive pattern, a negative pattern, a curved pattern, or no clear pattern. This matters because Pearson correlation measures linear association. A curved relationship can be real even when a linear correlation is small.
Regression describes an average line
Simple linear regression is used when the goal is to describe the average value of Y for a given value of X. The model includes a straight line plus an error term.
Yᵢ = α + βXᵢ + εᵢ
- Yᵢ is the response for observation i.
- Xᵢ is the predictor for observation i.
- α is the population intercept.
- β is the population slope.
- εᵢ is the random error.
For sample data, the fitted line is written with estimated values.
Ŷ = a + bX
- Ŷ is the predicted value of Y.
- a is the estimated intercept.
- b is the estimated slope.
b = [nΣXY − (ΣX)(ΣY)] / [nΣX² − (ΣX)²]
- n is the number of paired observations.
a = Ȳ − bX̄
- Ȳ is the sample mean of Y.
- X̄ is the sample mean of X.
Standard error tells us how closely points follow the fitted line
sᵧₓ = √[Σ(Y − Ŷ)² / (n − 2)]
- Y − Ŷ is a residual.
- n − 2 is the degrees of freedom for simple linear regression.
R squared describes explained variation
Pearson correlation measures linear strength and direction
r = Σ[(X − X̄)(Y − Ȳ)] / √{Σ(X − X̄)² Σ(Y − Ȳ)²}
- r is the sample Pearson correlation coefficient.
r = [nΣXY − (ΣX)(ΣY)] / √{[nΣX² − (ΣX)²][nΣY² − (ΣY)²]}
Check your understanding
1. Why should you inspect a scatter diagram before calculating Pearson r? 2. What is the difference between correlation and prediction? 3. If r = 0.80 in simple linear regression, what is R squared? Answer: 0.64.
Part A: Pearson correlation for grouped data
Raw data are not always available. Sometimes scores are stored in intervals such as 40 to 49 or 50 to 59. When two variables are grouped at the same time, we can place their frequencies in a two way table. This is called a bivariate frequency table.
Bivariate means that two variables are studied together. Each cell in the table shows how many observations belong to one class of X and one class of Y at the same time. A row total by itself is not a paired observation, and a column total by itself is not a paired observation. The pairing is represented by the cells.
Why class midpoints are used
A grouped class hides the exact values inside the interval. For example, a score in the class 70 to 79 could be 70, 74, 78, or another value in that range. To make a workable numerical approximation, the class midpoint is used as the representative value for the whole class.
Example 10.8: bivariate frequency table correlation
The textbook compares Statistics grades with Mathematics grades for 100 students. Each number below is a frequency. For example, the value 10 at Statistics 70 to 79 and Mathematics 70 to 79 means ten students fall in both of those classes.
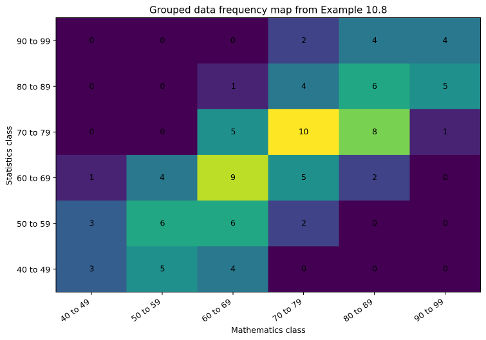
| Statistics Y | 40 to 49 | 50 to 59 | 60 to 69 | 70 to 79 | 80 to 89 | 90 to 99 | Total |
|---|---|---|---|---|---|---|---|
| 90 to 99 | 0 | 0 | 0 | 2 | 4 | 4 | 10 |
| 80 to 89 | 0 | 0 | 1 | 4 | 6 | 5 | 16 |
| 70 to 79 | 0 | 0 | 5 | 10 | 8 | 1 | 24 |
| 60 to 69 | 1 | 4 | 9 | 5 | 2 | 0 | 21 |
| 50 to 59 | 3 | 6 | 6 | 2 | 0 | 0 | 17 |
| 40 to 49 | 3 | 5 | 4 | 0 | 0 | 0 | 12 |
| Total | 7 | 15 | 25 | 23 | 20 | 10 | 100 |
| Statistics Y | 40 to 49 | 50 to 59 | 60 to 69 | 70 to 79 | 80 to 89 | 90 to 99 |
|---|---|---|---|---|---|---|
| 90 to 99 | 0 | 0 | 0 | 2 | 4 | 4 |
| 80 to 89 | 0 | 0 | 1 | 4 | 6 | 5 |
| 70 to 79 | 0 | 0 | 5 | 10 | 8 | 1 |
| 60 to 69 | 1 | 4 | 9 | 5 | 2 | 0 |
| 50 to 59 | 3 | 6 | 6 | 2 | 0 | 0 |
| 40 to 49 | 3 | 5 | 4 | 0 | 0 | 0 |
Each row is revealed in turn. The table remains fully readable when motion is reduced or disabled.
Step 1: assign midpoint values and code them
The calculation can be made shorter by coding the midpoint values. The textbook uses 64.5 as the working center for X and 74.5 as the working center for Y. The class width is 10.
u = (X − 64.5) / 10
- X is a Mathematics class midpoint.
v = (Y − 74.5) / 10
- Y is a Statistics class midpoint.
Step 2: calculate the marginal coded totals
First use the column totals with u. Then use the row totals with v. These totals save us from repeating the same midpoint calculation for every student.
| Mathematics midpoint X | u | Column frequency f | fu | fu² |
|---|---|---|---|---|
| 44.5 | −2 | 7 | −14 | 28 |
| 54.5 | −1 | 15 | −15 | 15 |
| 64.5 | 0 | 25 | 0 | 0 |
| 74.5 | 1 | 23 | 23 | 23 |
| 84.5 | 2 | 20 | 40 | 80 |
| 94.5 | 3 | 10 | 30 | 90 |
| Total | 100 | 64 | 236 |
| Statistics midpoint Y | v | Row frequency f | fv | fv² | Row contribution to Σfuv |
|---|---|---|---|---|---|
| 94.5 | 2 | 10 | 20 | 40 | 44 |
| 84.5 | 1 | 16 | 16 | 16 | 31 |
| 74.5 | 0 | 24 | 0 | 0 | 0 |
| 64.5 | −1 | 21 | −21 | 21 | −3 |
| 54.5 | −2 | 17 | −34 | 68 | 20 |
| 44.5 | −3 | 12 | −36 | 108 | 33 |
| Total | 100 | −55 | 253 | 125 |
Step 3: understand the fuv term
The cross product term uses the frequency in each occupied cell. Take one cell as an example. The Mathematics class 80 to 89 has u = 2. The Statistics class 90 to 99 has v = 2. The frequency is 4. That one cell contributes 4 × 2 × 2 = 16 to Σfuv. The same idea is used for every occupied cell.
After all cell contributions are added, the textbook totals are n = 100, Σfu = 64, Σfv = −55, Σfu² = 236, Σfv² = 253, and Σfuv = 125.
Step 4: use the grouped Pearson formula
r = [nΣfuv − (Σfu)(Σfv)] / √{[nΣfu² − (Σfu)²][nΣfv² − (Σfv)²]}
- f is a cell frequency.
- u is the coded X midpoint.
- v is the coded Y midpoint.
- n is the total frequency.
r = [(100)(125) − (64)(−55)] / √{[(100)(236) − 64²][(100)(253) − (−55)²]} ≈ 0.77
The value 0.77 does not prove that higher Mathematics grades cause higher Statistics grades. Correlation describes association. Other variables, shared study habits, course background, or other factors may be involved.
How to calculate correlation from grouped data: a short method
- Write the bivariate frequency table and check the row totals, column totals, and grand total.
- Find the midpoint of every X class and every Y class.
- Choose convenient coded values if the classes have equal width.
- Use column totals to find Σfu and Σfu².
- Use row totals to find Σfv and Σfv².
- Use each cell frequency to find the total Σfuv.
- Substitute all totals into the grouped Pearson formula.
- Interpret the sign and size, then state that correlation does not prove cause.
Check your understanding
1. Why do grouped data require class midpoints? 2. What does r ≈ 0.77 mean in Example 10.8? 3. If a cell has f = 5, u = 1, and v = −2, what is its fuv contribution? Answer: −10.
Part B: Spearman rank correlation
What changes when the data are ranks instead of measured values? The distance between ranks is not the same as the distance between raw scores. First place and second place are one position apart, but that does not tell us how many points separate the two observations.
Spearman rank correlation is designed for order. It is useful when the observations are already ranks, when a characteristic is naturally judged by order, or when exact measurement is not suitable. It also describes monotonic association. Monotonic means the variables tend to move in one direction together, even if the pattern is not a straight line.
How to rank observations correctly
Choose one ranking direction and keep it for both variables. You may let rank 1 mean the highest value or the lowest value. The choice does not matter if you use the same rule throughout. Problems often become wrong because the ranking direction changes halfway through the table.
For each observation, find the difference between the two ranks. The textbook writes this difference as d.
Spearman rank correlation formula with no ties
rₛ = 1 − [6Σd² / n(n² − 1)]
- rₛ is Spearman rank correlation.
- d is the difference between paired ranks.
- n is the number of ranked objects.
Σi = n(n + 1) / 2
Σi² = n(n + 1)(2n + 1) / 6
Maximum Σd² = n(n² − 1) / 3
If every object has the same rank in both lists, every d is zero and rₛ = 1. This is complete agreement. If one list is the exact reverse of the other, rₛ = −1. This is complete disagreement in rank order.
Example 10.10: two sets of student ranks
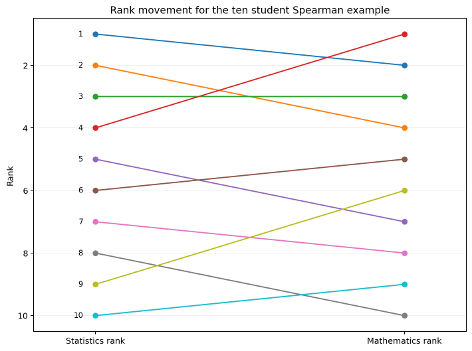
The textbook compares the ranks of ten students in Statistics and Mathematics. We subtract the Mathematics rank from the Statistics rank, square the difference, and add the squares.
| Statistics rank x | Mathematics rank y | d = x − y | d² |
|---|---|---|---|
| 1 | 2 | −1 | 1 |
| 2 | 4 | −2 | 4 |
| 3 | 3 | 0 | 0 |
| 4 | 1 | 3 | 9 |
| 5 | 7 | −2 | 4 |
| 6 | 5 | 1 | 1 |
| 7 | 8 | −1 | 1 |
| 8 | 10 | −2 | 4 |
| 9 | 6 | 3 | 9 |
| 10 | 9 | 1 | 1 |
| Total | 0 | 34 |
What happens when there are tied ranks?
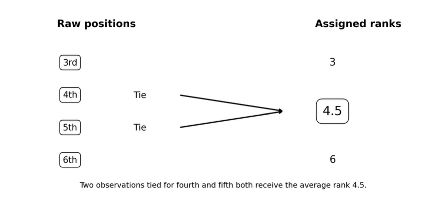
A tie occurs when two or more observations have the same value or receive the same judgment. We cannot give tied observations different ranks just because they happen to appear in a certain order. Instead, they share the average of the rank positions they occupy.
Suppose two observations tie for fourth and fifth place. The average is (4 + 5) / 2 = 4.5. Both observations receive rank 4.5. The next observation receives rank 6.
- t is the number of observations in one tied group.
Example 10.11: tied ranks in two member lists
In the first member list, B and C are tied. They occupy positions 2 and 3, so both receive 2.5. In the second member list, E, F, and G are tied. They occupy positions 5, 6, and 7, so all three receive rank 6.
| Person | Member 1 rank | Member 2 rank | d | d² |
|---|---|---|---|---|
| A | 1 | 2 | −1 | 1 |
| B | 2.5 | 4 | −1.5 | 2.25 |
| C | 2.5 | 1 | 1.5 | 2.25 |
| D | 4 | 3 | 1 | 1 |
| E | 5 | 6 | −1 | 1 |
| F | 6 | 6 | 0 | 0 |
| G | 7 | 6 | 1 | 1 |
| H | 8 | 8 | 0 | 0 |
| Total | 36 | 36 | 0 | 8.5 |
The first tied group has t = 2. Its correction is (2³ − 2) / 12 = 0.5. The second tied group has t = 3. Its correction is (3³ − 3) / 12 = 2. The total correction is 2.5.
rₛ = 1 − [6(8.5 + 2.5) / 8(8² − 1)] = 0.869
The textbook then shows an alternative method. It calculates ordinary Pearson correlation using the adjusted rank values. That calculation gives a slightly different value.
Modern software note
Many modern statistics packages define Spearman correlation as Pearson correlation applied to the rank values after average ranks are assigned to ties. That approach matches the adjusted rank method in this example, which gives about 0.896. The attached textbook also teaches a shortcut correction that gives 0.869. For a course exam, follow the method your instructor or source text requires and label the method clearly.
Difference between Pearson and Spearman correlation
| Question | Pearson correlation | Spearman rank correlation |
|---|---|---|
| What data does it use? | Raw numerical values | Ranks or rank transformed values |
| What pattern does it measure? | Linear association | Monotonic association |
| Can it be used for ordinal ranks? | Not as the ordinary raw value method | Yes |
| What is the basic range? | −1 to 1 | −1 to 1 |
| What should you check first? | Scatter pattern and suitability of numerical data | Ranking rule, monotonic order, and ties |
| What do ties require? | Not a rank issue for ordinary Pearson data | Average ranks and an appropriate tied rank method |
Check your understanding
1. If Σd² becomes smaller while n stays fixed, what happens to rₛ? It moves closer to 1. 2. What rank should two observations receive if they tie for fourth and fifth? Answer: 4.5 each. 3. Why should the no tie Spearman shortcut not be used without adjustment when ties are present?
Part C: coefficient of concordance W
Spearman compares two ranking sets. What if three, four, or more judges rank the same objects? Pairwise Spearman values could be calculated, but they would not give one overall measure of agreement. The coefficient of concordance W solves this problem.
In the textbook treatment, W ranges from 0 to 1. A value near 1 means the judges give similar rankings. A value near 0 means there is little overall agreement. Unlike Pearson r or Spearman rₛ, W is not a signed measure in this treatment.
How concordance W is calculated
First add the ranks given to each object. These totals are written as Rⱼ. If there are m judges and n objects, the common mean of the total ranks is easy to find.
Mean total rank = m(n + 1) / 2
- m is the number of judges or ranking sets.
- n is the number of objects.
S = Σ(Rⱼ − m(n + 1)/2)²
- Rⱼ is the total rank received by object j.
- S is the sum of squared deviations of the total ranks from their common mean.
W = 12S / [m²(n³ − n)]
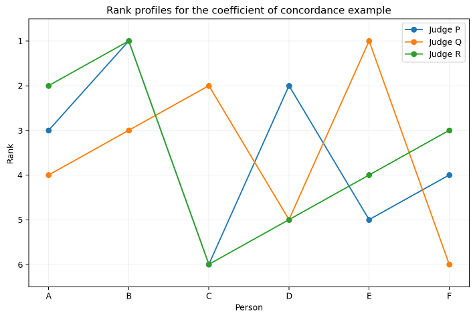
Example 10.12: three judges rank six persons
| Judge | A | B | C | D | E | F |
|---|---|---|---|---|---|---|
| P | 3 | 1 | 6 | 2 | 5 | 4 |
| Q | 4 | 3 | 2 | 5 | 1 | 6 |
| R | 2 | 1 | 6 | 5 | 4 | 3 |
| Total | 9 | 5 | 14 | 12 | 10 | 13 |
Here m = 3 and n = 6. The common mean total rank is 3(6 + 1) / 2 = 10.5. The squared deviations of the six total ranks add to S = 53.50.
Check your understanding
1. Why is W needed when there are three judges? 2. Does a negative W mean reverse agreement? No. In the textbook treatment W runs from 0 to 1. 3. If m = 4 and n = 5, what is the mean total rank? Answer: 12.
Full regression and correlation revision map
The easiest way to remember the chapter is to connect each method to the question it answers. Do not start by memorizing a formula. Start by asking what the data look like and what the problem wants you to find.
| Method | Question it answers | Memory cue |
|---|---|---|
| Scatter diagram | Is there a visible pattern between two variables? | Look for positive, negative, curved, or no clear relation. |
| Regression | What line describes average Y for a given X? | Fit Ŷ = a + bX by least squares. |
| Prediction | What value of Y is expected for a chosen X? | Substitute X into the fitted regression equation. |
| Standard error | How far do observed Y values usually fall from the line? | Use residual variation around Ŷ. |
| R squared | What proportion of Y variation is explained by the linear regression? | Explained variation divided by total variation. |
| Pearson correlation | How strong and in what direction is the linear relation? | r runs from −1 to 1. |
| Spearman rank correlation | How similar are two rank orders? | Use rank differences or correlation of ranks. |
| Concordance W | How much do several judges agree? | Use total ranks and W. |
Which method should I use?
| Data situation | Method | Why |
|---|---|---|
| Raw numerical X and Y with an approximately linear relationship | Pearson correlation | It measures strength and direction of linear association. |
| Grouped numerical X and Y in a two variable frequency table | Grouped Pearson correlation | Use class midpoints and cell frequencies. |
| Two sets of ranks with no ties | Spearman rank correlation | Use d and d squared in the shortcut formula. |
| Two sets of ranks with ties | Spearman with tied rank handling | Assign average ranks and use the stated tie method. |
| More than two judges ranking the same objects | Coefficient of concordance W | It gives one overall measure of agreement. |
| Need to predict Y from X | Regression | Correlation alone does not give a prediction equation. |
Common mistakes and how to fix them
| Common mistake | Why it causes trouble | Quick fix |
|---|---|---|
| Treating correlation as proof of cause | Association can come from other variables or shared conditions. | Say that correlation describes association, not cause. |
| Using Pearson when the information is only ranks | Raw numerical distances are not available. | Use Spearman for two rank lists. |
| Forgetting class midpoints in grouped data | A class label is an interval, not one exact value. | Use the midpoint as the representative value. |
| Using row totals or column totals as paired observations | The pair information is stored in the table cells. | Use cell frequencies with both X and Y values. |
| Changing ranking direction halfway through | The rank differences become inconsistent. | Decide whether rank 1 is highest or lowest before starting. |
| Forgetting to square d | Positive and negative differences can cancel. | Make a separate d squared column. |
| Using the no tie shortcut without handling ties | Ties change the rank variance. | Assign average ranks and use the required tied rank method. |
| Confusing strong correlation with a steep slope | Slope depends on units, correlation does not. | Treat b and r as different ideas. |
| Confusing R squared with r | R squared is a proportion, while r also carries direction. | In simple regression, square r to get R squared. |
| Using correlation when the task is prediction | A coefficient does not produce a predicted Y value. | Fit a regression equation. |
| Interpreting W like a signed correlation | The textbook W ranges from 0 to 1. | Use W as an agreement measure only. |
| Rounding too early | Small rounding errors can grow across several steps. | Keep extra digits until the final answer. |
Practice questions
Short questions
- What is the main reason for drawing a scatter diagram before calculating Pearson correlation?
- Why are class midpoints used in grouped correlation?
- What does a positive Pearson r tell you about direction?
- When is Spearman rank correlation a better choice than ordinary Pearson correlation?
- What rank do three observations receive if they tie for positions 2, 3, and 4?
- Why is concordance W used instead of Spearman when several judges rank the same objects?
Numerical question 1: Spearman with no ties
Two teachers rank six projects. Teacher A gives ranks 1, 2, 3, 4, 5, 6. Teacher B gives ranks 2, 1, 3, 5, 4, 6. Calculate Spearman rₛ.
Numerical question 2: grouped coded totals
A grouped bivariate table has n = 20, Σfu = 4, Σfv = −2, Σfu² = 34, Σfv² = 30, and Σfuv = 22. Use the coded grouped Pearson formula to calculate r.
Practice answer key
- A scatter diagram helps you see whether the relation is roughly linear, curved, unusual, or affected by outliers.
- A midpoint gives one representative numerical value for all observations inside a class interval.
- A positive r means higher values of one variable tend to occur with higher values of the other in a linear pattern.
- Use Spearman when the data are ranks or ordinal positions, or when a monotonic rank relationship is the main question.
- The average of 2, 3, and 4 is 3, so all three tied observations receive rank 3.
- Spearman compares two rank lists. Concordance W gives one agreement measure for more than two ranking sets.
- For the first numerical question, Σd² = 4. Therefore rₛ = 1 − 6(4) / [6(6² − 1)] = 1 − 24/210 ≈ 0.886.
- For the second numerical question, r = [20(22) − 4(−2)] / √{[20(34) − 4²][20(30) − (−2)²]} ≈ 0.712.
Final concept summary
Correlation and rank correlation in statistics become easier when you match the method to the form of the data. Start with a scatter diagram when numerical pairs are available. Use regression when the goal is prediction. Use standard error to describe scatter around the regression line, and use R squared to describe the proportion of variation explained by that line.
Use Pearson correlation for linear association between numerical variables. If the numerical observations are grouped into classes, use class midpoints and cell frequencies. In the textbook grouped example, the result is about 0.77, which shows a fairly strong positive linear association in the grouped sample.
Use Spearman correlation when the key information is rank order. With no ties, the d squared shortcut is fast. With ties, assign average ranks first and follow the tied rank method required for your course. For several judges, move from Spearman to concordance W. The main idea is not to memorize one formula for every situation. It is to choose the formula that matches the question.
FAQ
What is the difference between Pearson and Spearman correlation?
Pearson uses numerical values and measures linear association. Spearman uses ranks and measures monotonic association. Spearman is especially useful when the data are ordinal ranks or when order matters more than exact numerical distance.
How do I calculate correlation from grouped data?
Find each class midpoint, attach the correct cell frequencies, calculate the needed grouped sums, and substitute them into the grouped Pearson formula. Coding the midpoints can make the arithmetic much shorter without changing r.
How do I handle tied ranks in Spearman correlation?
Give tied observations the average of the positions they occupy. Then use the tied rank procedure required by your text or software. The attached textbook shows both a correction shortcut and Pearson correlation of the adjusted ranks.
What does r = 0 mean?
For Pearson correlation, r near zero means there is little linear association. It does not prove there is no relationship at all. A strong curved relationship can still have a small Pearson r, which is why a scatter diagram matters.
What is coefficient of concordance W?
Concordance W measures how much several judges or ranking sets agree about the same objects. In the textbook treatment, W ranges from 0 for little agreement toward 1 for strong agreement.
Why can Pearson and Spearman give different answers?
Pearson works with the original numerical values and focuses on a linear pattern. Spearman works with rank order and focuses on a monotonic pattern. If the data rise steadily but not in a straight line, the two coefficients can describe the relationship differently.
Try it in DataClue
Ready to run Pearson Correlation?
Measure the linear relationship between two continuous variables.
Run Pearson Correlation