
Cronbach’s Alpha: Meaning, Formula and Interpretation
Cronbach’s alpha is a widely used reliability coefficient that measures the internal consistency of multi-item scales and questionnaires. This guide explains how Cronbach’s alpha works, how to interpret common values, calculate it in SPSS, evaluate item-total statistics, and avoid mistakes such as treating 0.70 as a universal cutoff. It also covers key assumptions, reverse-coded items, dimensionality, limitations, and when alternatives such as McDonald’s omega may be more appropriate.
Cronbach’s Alpha: Meaning, Formula and Interpretation
A practical, evidence-aware guide to interpretation, SPSS analysis, assumptions, item diagnostics, and alternatives such as McDonald’s omega.
Cronbach’s alpha (α) is a reliability coefficient used to evaluate the internal consistency of scores from a set of questionnaire or test items intended to function together as a scale. In practical terms, it helps researchers judge whether several items are sufficiently related to support combining them into one score.
The coefficient is useful, but it is often interpreted too mechanically. An alpha of 0.70 is a common rule of thumb rather than a universal pass/fail boundary, and a high value does not prove that a scale is one-dimensional or valid. The most useful question is therefore not simply “Is my alpha high enough?” but “What does this result tell me about the scale, and what should I check next?”
What Is Cronbach’s Alpha in Simple Terms?
Cronbach’s alpha summarizes how consistently a group of items behaves when those items are intended to contribute to the same scale. If respondents who score relatively high on one item also tend to score relatively high on the other items measuring the same construct, internal consistency is generally stronger.
A construct is an attribute that cannot always be observed directly, such as employee engagement, anxiety, brand trust or academic motivation. Researchers often represent a construct with several observable questionnaire items and then combine those item responses into a mean or total score. Reliability analysis asks whether that score can be used consistently enough for the intended purpose.
Cronbach’s alpha is a coefficient, not a significance test. It does not tell you whether an effect is statistically significant, and it does not by itself prove that the items measure the construct you intended. Lee J. Cronbach’s 1951 paper established coefficient alpha within the broader problem of the internal structure of tests. [Cronbach (1951), Psychometrika]
Why Internal Consistency Matters Before You Combine Items
Suppose a university survey contains five questions intended to measure student satisfaction with online learning. Combining those answers into one satisfaction score assumes the items have enough common structure to justify treating them as parts of a scale. Reliability evidence helps evaluate that assumption before the combined score is used in regression, group comparisons or other analyses.
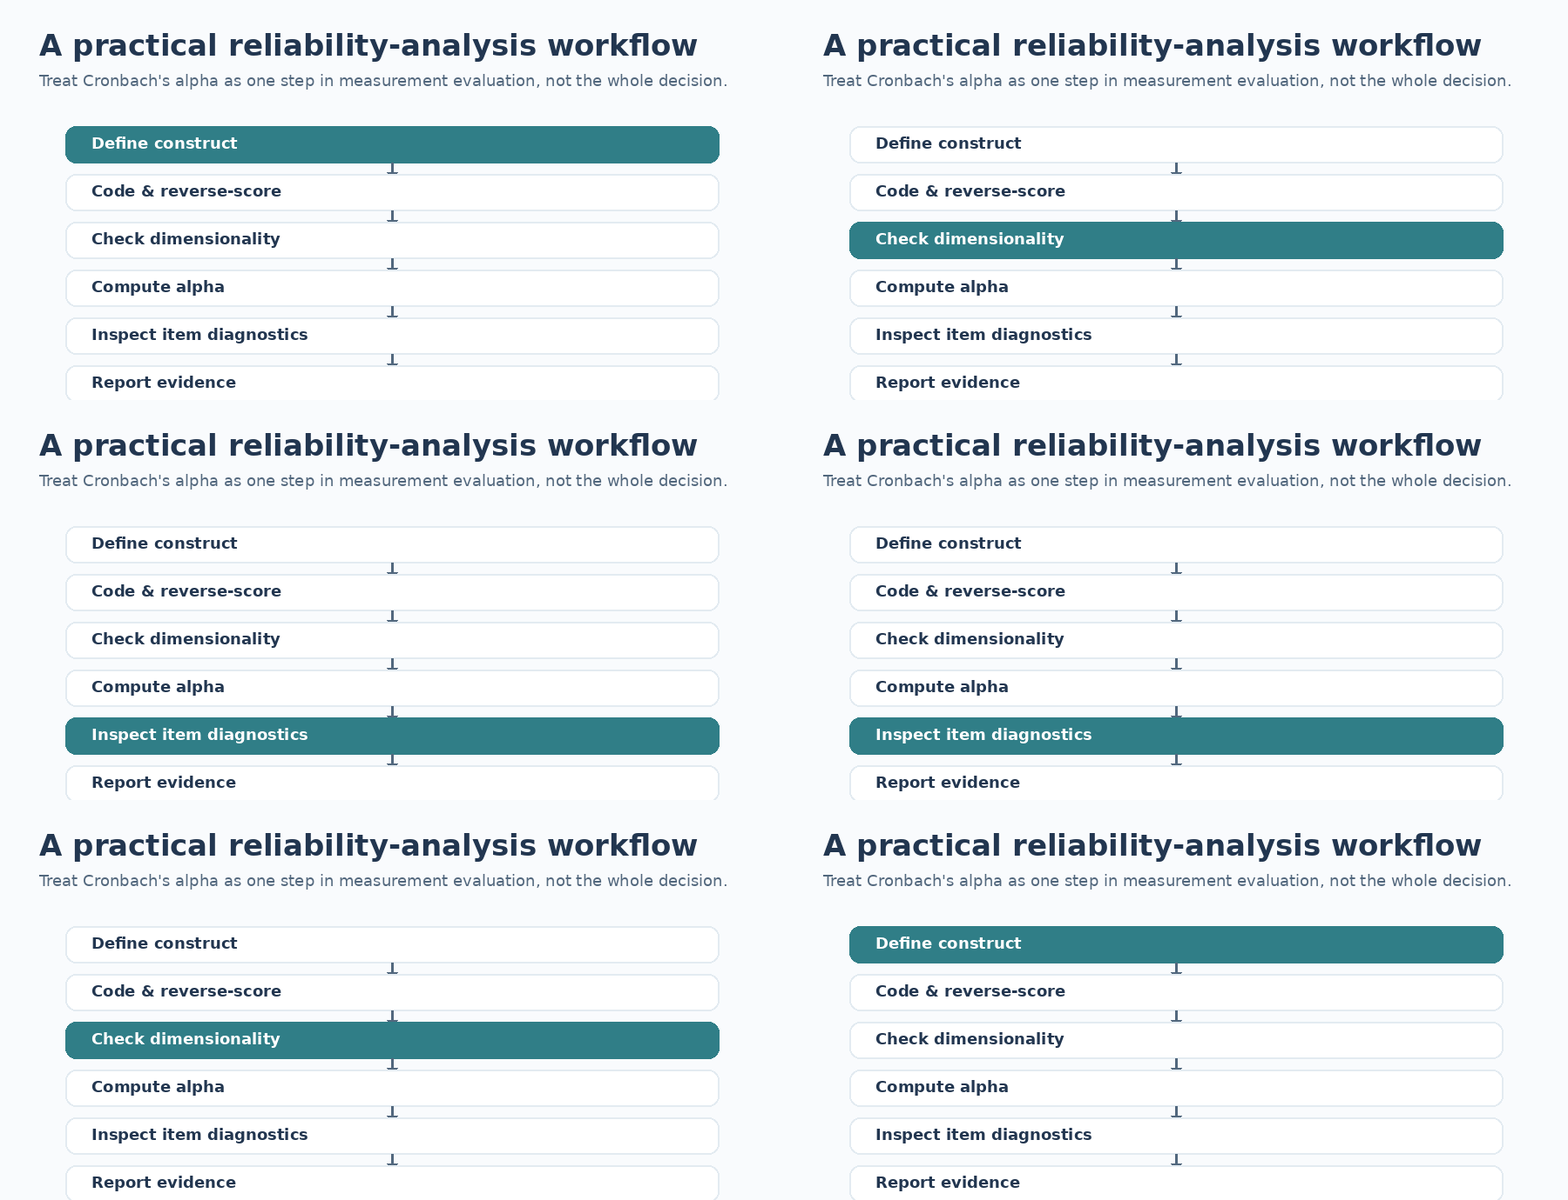
This is why Cronbach’s alpha appears so often in psychology, education, nursing and healthcare research, social science, business, management and marketing surveys. The workflow is similar across disciplines: define the construct, select the relevant items, code them consistently, evaluate the measurement structure, estimate reliability, inspect problems and then decide whether a composite score is defensible.
How Cronbach’s Alpha Works
Alpha depends heavily on two things: the relationships among the items and the number of items in the scale. When the average inter-item relationship becomes stronger, alpha generally rises. Holding other conditions similar, adding more related items can also raise alpha. [UCLA OARC]
That second feature creates an important reality check. A long questionnaire can obtain a high coefficient partly because it contains many related questions. More items do not automatically mean better measurement; a scale can become repetitive without adding much new information. [Sijtsma (2009), Psychometrika]
Cronbach’s Alpha Formula
One conceptual form of the formula expresses alpha using the number of items, the average covariance between items and the average item variance:
Here, N is the number of items, c̄ is the average inter-item covariance, and v̄ is the average variance of the individual items. The formula makes the basic dynamics visible: alpha rises when items share more covariance and can also rise as the number of items increases. [UCLA OARC]
How to Interpret Cronbach’s Alpha Values
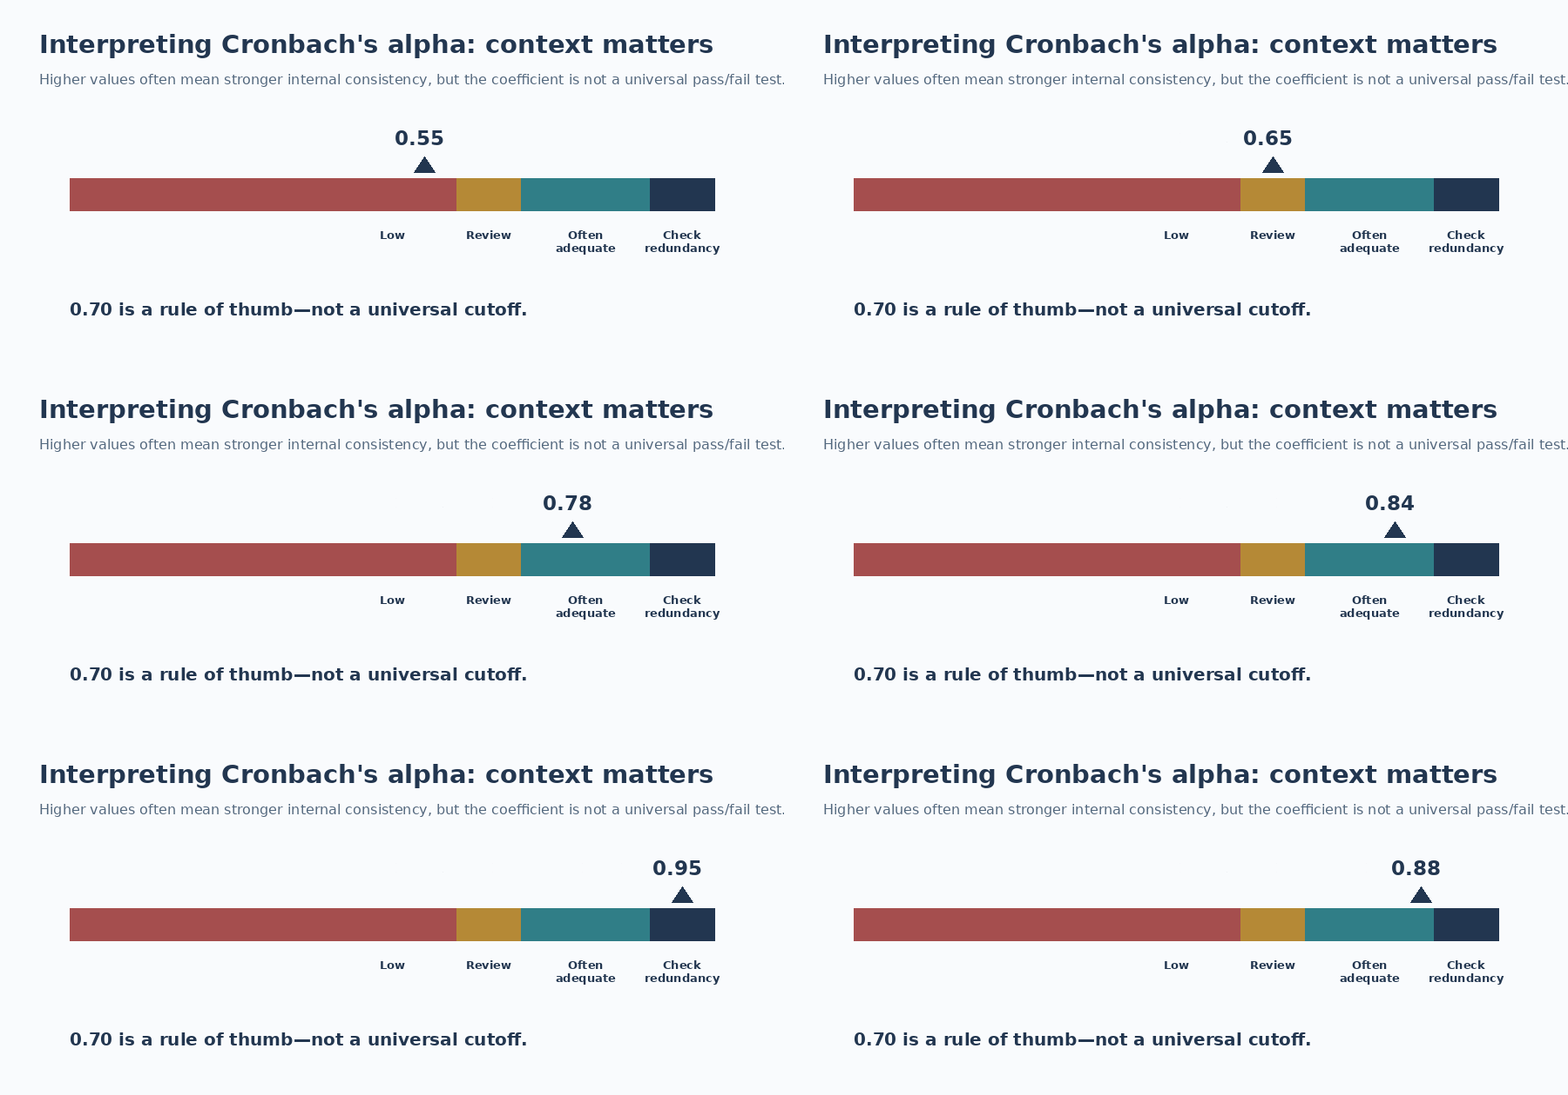
Interpretation tables are useful for orientation, but they should be read as conventions rather than universal scientific cutoffs. The same coefficient can have different practical implications depending on the number of items, the purpose of the scale, the quality of the items and the consequences of measurement error.
| Cronbach’s alpha | Common descriptive interpretation | What to do next |
|---|---|---|
| ≥ 0.90 | Very high internal consistency | Check whether items are genuinely informative or partly redundant. |
| 0.80–0.89 | Good internal consistency | Usually reassuring, but still check dimensionality and item behavior. |
| 0.70–0.79 | Often treated as acceptable | Interpret in context rather than using 0.70 as a hard boundary. |
| 0.60–0.69 | May be questionable | Inspect item quality, scale length, coding and dimensionality. |
| < 0.60 | Weak internal consistency in many settings | Diagnose the scale before combining items or drawing strong conclusions. |
| Negative | Items are negatively related on average | Check reverse scoring, coding errors and whether the items belong together. |
The conventional 0.70 rule remains useful as a quick benchmark, especially in introductory research, but methodological critiques caution against turning one decimal boundary into a measurement decision. A coefficient of 0.69 and one of 0.70 should not be treated as fundamentally different simply because they fall on opposite sides of a familiar rule. [Sijtsma (2009), Psychometrika]
What Does a Very High Alpha Mean?
A very high alpha can reflect strong internal consistency, but it can also be produced by highly similar items. If several questions are close paraphrases, the scale may be longer without providing broader coverage of the construct. The goal is not to maximize alpha at any cost; it is to obtain dependable scores while preserving meaningful content coverage.
What Does a Low or Negative Alpha Mean?
A low value can arise because items are weakly related, the scale is very short, the questionnaire contains more than one dimension, or some questions are poorly worded. A negative alpha is a stronger warning that average relationships among items are running in the wrong direction. One of the first checks should be reverse-scored items, followed by coding errors and the possibility that incompatible items have been combined. [UCLA OARC]
What Is a Good Cronbach’s Alpha?
A good Cronbach’s alpha is one that, together with other evidence, supports the intended interpretation and use of the scale score. That answer is less convenient than a universal cutoff, but it is more defensible.
Exploratory research, established psychological instruments and measures used for high-stakes individual decisions do not necessarily need identical reliability evidence. The number of items also matters: short scales can have modest alpha even when their items are meaningfully related, while long scales can achieve high alpha partly through length.
A better decision therefore combines the coefficient with item diagnostics, theory, dimensionality, the intended use of the score and, when appropriate, a confidence interval that shows sampling uncertainty around the estimate.
Assumptions and Conditions Behind Cronbach’s Alpha
The Items Must Belong to a Coherent Measurement Problem
Reliability analysis should follow the intended scale structure. If a questionnaire contains separate subscales for stress, satisfaction and motivation, calculating one alpha across all items merely because they appear in the same survey can be misleading. Each scale or defensible subscale should normally be evaluated according to its own measurement structure.
Tau-Equivalence Is an Important Assumption
A conventional reliability interpretation of alpha relies on assumptions that are often summarized through tau-equivalence. In simplified terms, the items are expected to contribute to the common construct in a sufficiently similar way. When item loadings differ substantially, other reliability estimators can be more appropriate. [McNeish (2018)]
Simulation research shows why this should be treated as a model-dependent decision rather than a slogan. When tau-equivalence is satisfied, alpha and omega can perform similarly; when it is violated, their behavior can diverge. [Edwards et al. (2021)]
Reverse-Worded Items Must Point in the Same Scoring Direction
If higher numbers mean more satisfaction for most items but less satisfaction for one reverse-worded item, that item must be recoded before the scale is combined. Otherwise, a question that is conceptually consistent with the construct can appear statistically inconsistent simply because its numerical direction is reversed.
Cronbach’s Alpha Does Not Prove Unidimensionality or Validity
A high Cronbach’s alpha does not prove that all items measure one latent variable. UCLA’s statistical guidance makes this point explicitly and recommends separate analyses, such as exploratory factor analysis, when evidence about dimensionality is needed. [UCLA OARC]
Internal consistency, dimensionality and validity answer different questions. Internal consistency concerns relationships among items. Dimensionality concerns whether those relationships are compatible with one factor or several. Validity concerns whether the interpretation and use of the resulting scores are supported by evidence. One coefficient cannot answer all three.
For a newly developed questionnaire, this distinction is especially important. A researcher can obtain a respectable alpha from a mixture of two related dimensions and still be wrong to report the items as one clean scale. Exploratory factor analysis can help investigate the structure; confirmatory factor analysis may be more suitable when a specific measurement model is being tested.
How to Calculate Cronbach’s Alpha in SPSS
IBM SPSS Statistics calculates Cronbach’s alpha through the Reliability Analysis procedure. IBM’s current documentation describes the procedure as a way to study the properties of measurement scales and the items that compose them, and the RELIABILITY command supports an ALPHA model. [IBM SPSS Reliability Analysis]
In the graphical interface, open Analyze, choose Scale and then Reliability Analysis. Move only the items belonging to the scale or subscale you want to evaluate into the Items box. Select Alpha as the model. Under Statistics, request item, scale and item-deleted diagnostics so that the output does more than display one overall coefficient. [IBM SPSS RELIABILITY MODEL]
The practical sequence matters. Before clicking OK, confirm that reverse-scored questions have been coded correctly, that missing-value handling is understood, and that you have not mixed different constructs simply because they share the same dataset.
How to Read SPSS Reliability Output
Reliability Statistics
The Reliability Statistics table gives the overall coefficient and the number of analyzed items. This is the number most researchers report, but it should be the beginning of interpretation rather than the end.
Corrected Item-Total Correlation
The corrected item-total correlation shows how one item relates to the total formed from the remaining items. A weak or negative relationship deserves investigation, but there is no defensible reason to delete an item solely because it misses a convenient threshold without considering its wording, theory and measurement role.
Cronbach’s Alpha if Item Deleted
The “alpha if item deleted” column estimates what the scale coefficient would be if a particular question were removed. A noticeable increase is a diagnostic clue: it tells you that the item deserves attention. It does not tell you why the item behaves differently or whether removing it improves the validity of the scale.
A Practical Cronbach’s Alpha Example
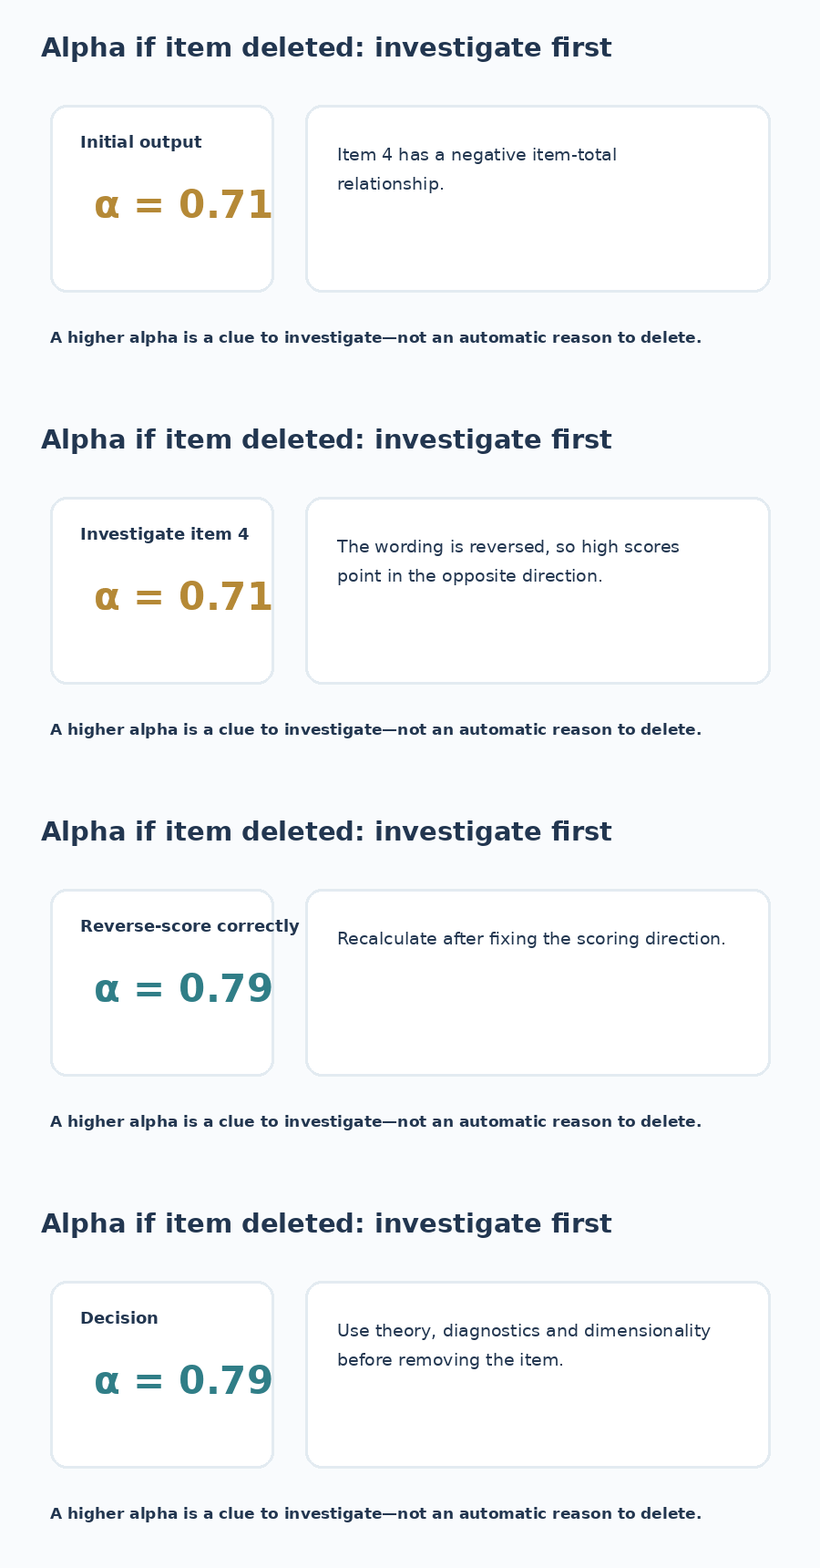
Imagine a six-item Student Online Learning Satisfaction scale. Four items directly express satisfaction, one item is weakly related to the others, and one item is worded in the opposite direction: “I would prefer never to study online again.” The initial reliability analysis produces α = .71.
SPSS shows a negative corrected item-total relationship for the reverse-worded item and suggests that alpha would increase if it were removed. Deleting it immediately would be premature. The researcher first checks the coding and discovers that the response scale was never reversed for this item.
After reverse scoring, the item now points in the same direction as the others and the scale produces α = .79. The change demonstrates an important implementation lesson: item diagnostics can reveal coding or measurement problems, but they should trigger investigation before deletion.
The remaining weak item still deserves attention. If factor analysis shows that it loads on another dimension or its wording does not fit the construct, removal may be justified. If it captures an important aspect of satisfaction that the other questions miss, keeping it may protect content coverage even if alpha would become slightly larger without it.
Cronbach’s Alpha vs McDonald’s Omega
McDonald’s omega is often considered when items do not contribute equally to the underlying construct. Modern methodological critiques argue that automatically defaulting to alpha can be inappropriate when its assumptions are not supported. [McNeish (2018)]
That does not mean omega is automatically better in every dataset. Omega is also model-based and depends on assumptions about the measurement structure. The useful decision is not “alpha or omega—which number is higher?” but “which reliability model matches the scale and the evidence I can defend?”
In practice, researchers may report alpha because it is widely recognized and add omega when the measurement model or disciplinary guidance makes the additional estimate informative. The two coefficients should be interpreted as evidence under assumptions, not as competing scores in which the larger number wins.
Cronbach’s Alpha for Likert Scale Data
Cronbach’s alpha is routinely calculated for multi-item Likert-type scales, but ordered response categories are ordinal. Standard covariance-based alpha is commonly computed from Pearson relationships, while ordinal reliability approaches can use polychoric correlations to model ordered categorical responses differently. [Gadermann, Guhn & Zumbo (2012)]
This does not create a rule that every five-point questionnaire must use ordinal alpha. The number of response categories, distribution of responses, measurement model and purpose of the analysis all matter. For many applied studies, the practical improvement is simply to recognize the issue and justify the chosen estimator instead of assuming that “Likert scale” automatically settles the method.
Cronbach’s Alpha vs Other Reliability Measures
Cronbach’s alpha addresses internal consistency. Other reliability methods answer different questions. Test-retest reliability examines stability over time. Intraclass correlation coefficients can address agreement or consistency across repeated measurements or raters, depending on the model. KR-20 is closely related to alpha for dichotomously scored items. Split-half methods evaluate consistency between portions of a test.
The right reliability method therefore depends on the source of inconsistency you need to study. A scale can show high internal consistency today and still have poor stability across time, because those are different measurement problems.
Common Mistakes That Make Cronbach’s Alpha Misleading
The most common error is treating α ≥ .70 as an automatic approval stamp. A high value can coexist with multidimensionality, redundant questions or weak construct validity, while a coefficient just below .70 may still be understandable in a short or exploratory scale. [Sijtsma (2009), Psychometrika]
Another mistake is maximizing the coefficient by repeatedly deleting questions. This can narrow the construct until only similar items remain. Statistical consistency may improve while substantive coverage gets worse.
Researchers should also avoid reporting the reliability coefficient from an earlier validation study as though it were a permanent property of the questionnaire. Reliability evidence belongs to scores obtained under particular conditions; a new sample can produce different item relationships and therefore a different estimate.
Finally, do not report that a questionnaire is “valid because alpha was .84.” Alpha can contribute reliability evidence, but validity requires a broader argument about whether the score represents the intended construct and supports the proposed use.
How to Report Cronbach’s Alpha in a Research Paper
A concise reporting statement should identify the scale, the number of items when useful, the sample context and the coefficient. For example: “The six-item employee engagement scale showed good internal consistency in the present sample, Cronbach’s α = .84.”
If the questionnaire contains several constructs, report reliability for the relevant subscales separately. If reverse scoring or item removal materially affected the final scale, document those decisions. When the research design warrants it, a confidence interval around the reliability estimate gives readers additional information about sampling uncertainty.
Avoid wording that turns alpha into proof of validity. “The scores showed good internal consistency” is a defensible reliability statement. “The questionnaire was valid because alpha exceeded .70” is not.
FAQs
What does Cronbach’s alpha measure?
It summarizes internal consistency among items intended to function together as a scale. It does not independently establish unidimensionality or construct validity. [UCLA OARC]
Is 0.70 a good Cronbach’s alpha?
It is a widely used rule of thumb and can be a reasonable preliminary benchmark, but the value should be interpreted in the context of scale length, purpose, item quality, dimensionality and measurement assumptions.
Can Cronbach’s alpha be negative?
Yes. A negative coefficient indicates that item covariances are problematic on average. Check reverse scoring, coding errors and whether the analyzed items actually belong to the same scale.
Should I remove an item if alpha increases?
Not automatically. Review the item’s coding, wording, theoretical importance, item-total relationship and factor structure. A higher alpha after deletion is evidence to investigate the item, not an instruction to remove it.
Can Cronbach’s alpha be used for Likert scales?
It is commonly used for multi-item Likert-type scales. When the ordinal nature of the data is important to the measurement problem, researchers can also consider ordinal reliability approaches based on polychoric correlations. [Gadermann, Guhn & Zumbo (2012)]
Is McDonald’s omega better than Cronbach’s alpha?
Not in every situation. Omega can be preferable when the measurement structure violates assumptions needed for a conventional interpretation of alpha, but omega also depends on a defensible model. Choose the estimator that fits the scale and report enough information for readers to understand the choice. [McNeish (2018)]
Cronbach’s Alpha: What to Do Next
Cronbach’s alpha is most useful when it starts a measurement-quality decision rather than ending one. Calculate it only for items that are intended to form a coherent scale, verify scoring direction, inspect unusual items, and examine dimensionality when the scale structure is uncertain.
If the coefficient is lower than expected, diagnose why before deleting questions. If it is extremely high, check whether several items are redundant. If the assumptions behind alpha are difficult to defend, consider whether McDonald’s omega or another reliability method better matches the measurement problem.
The practical takeaway is simple: treat Cronbach’s alpha as one piece of evidence about scale-score reliability, not as a pass/fail test based on 0.70. A defensible conclusion comes from the coefficient, the item content, the measurement structure and the intended use of the scores together.
Try it in DataClue
Ready to run Cronbach's Alpha?
Assess the internal consistency and reliability of a scale or questionnaire.
Run Cronbach's Alpha