
Effect Size Calculator & Complete Guide
An effect size tells you how large a difference, relationship, or treatment effect is. The effect size calculator below computes Cohen’s d and Hedges’ g for two independent groups, then shows the estimate, uncertainty,…
An effect size tells you how large a difference, relationship, or treatment effect is. The effect size calculator below computes Cohen’s d and Hedges’ g for two independent groups, then shows the estimate, uncertainty, and a context-aware interpretation. The larger issue is choosing the right effect measure for your study design before you calculate anything.
A p-value can help assess compatibility with a statistical model, but it does not measure the size or practical importance of an effect. That distinction is explicit in the . For useful research reporting, the effect estimate, its uncertainty, the study design, and the real-world meaning of the outcome belong together.
Effect Size Calculator
This calculator is for two independent groups with a continuous outcome. It uses the sample-size-weighted pooled within-group standard deviation, computes Cohen’s d, applies the Hedges small-sample correction, and gives approximate 95% confidence intervals using the variance equations documented by the .
Interactive calculator note: Use the HTML file for the working calculator. In Word, enter the same six values into your preferred statistical tool or spreadsheet and use the formulas below.
| Input | Group 1 | Group 2 |
|---|---|---|
| Mean | M₁ | M₂ |
| Standard deviation | SD₁ | SD₂ |
| Sample size | n₁ | n₂ |
SDpooled = √[((n₁ − 1)SD₁² + (n₂ − 1)SD₂²) / (n₁ + n₂ − 2)]
d = (M₁ − M₂) / SDpooled J = 1 − 3 / [4(n₁ + n₂ − 2) − 1] g = J × d
Design check: Do not use this independent-groups calculation for paired, repeated-measures, clustered, or pretest-posttest data.
What Numbers Do You Need for the Calculator?
For the standard independent-groups calculation, you need the mean, standard deviation, and sample size for each group: M₁, SD₁, n₁, M₂, SD₂, and n₂. If a paper reports a t statistic, F statistic, exact p-value, correlation, regression coefficient, or binary frequencies instead, an effect size can sometimes be recovered, but the conversion depends on the original analysis. Campbell provides separate methods for t tests, ANOVAs, pretest-posttest designs, binary data, correlations, and regression rather than treating every input as interchangeable.
How to Read Your Effect Size Result
If d = 0.72, the two group means differ by about 0.72 pooled standard deviations under the chosen sign convention. The sign tells direction. The absolute value tells standardized magnitude. A confidence interval shows how uncertain the estimate is. A large-looking point estimate with a wide interval should not be interpreted as if the effect were known precisely.
Cohen’s d vs Hedges’ g: Which Result Should You Use?
Hedges’ g is a bias-corrected standardized mean difference. The correction is larger in very small samples and approaches 1 as sample size grows, so d and g become nearly identical in larger samples. There is no universal rule that d becomes “valid” at N = 50 or that g is mandatory below 50. The apply a continuous correction based on degrees of freedom. In meta-analysis, bias-corrected standardized mean differences are commonly preferred.
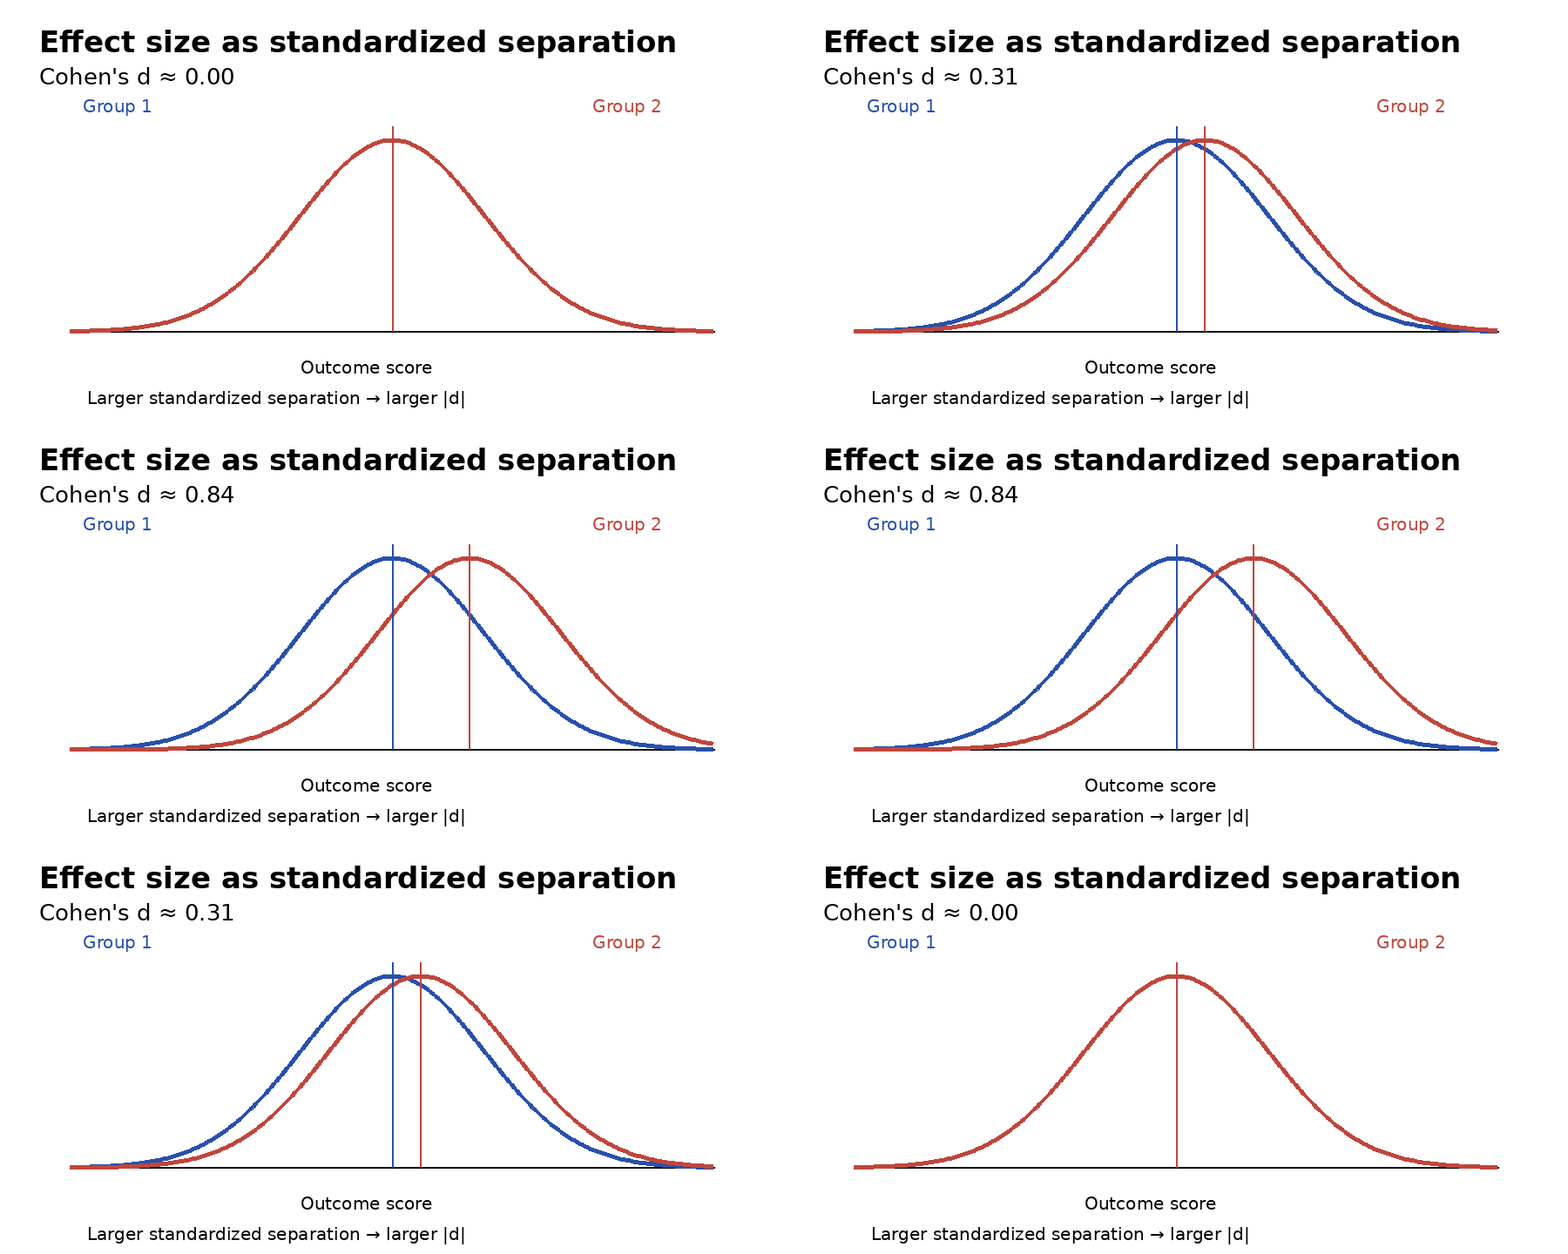
Effect size is about magnitude. For Cohen’s d, the mean difference is expressed in pooled standard-deviation units.
What Is Effect Size in Simple Terms?
What Does an Effect Size Actually Tell You?
An effect size is a quantitative estimate of the magnitude or strength of a difference, association, or treatment effect. Depending on the question, it may be expressed in original units, standardized units, proportions, correlations, or ratios.
This broader definition matters because not all effect sizes are standardized. Cochrane distinguishes continuous-outcome measures such as the mean difference and standardized mean difference, and binary-outcome measures such as risk ratio, odds ratio, and risk difference. .
Standardized vs Unstandardized Effect Sizes
A standardized effect such as Cohen’s d removes the original measurement unit, which is useful when studies measure the same construct on different scales. An unstandardized effect keeps the natural unit. If every study measures systolic blood pressure in mmHg, the raw mean difference may be easier to interpret than a standardized value. Standardization improves comparability, but it can reduce immediate practical meaning.
Can an Effect Size Be Positive or Negative?
Yes. Signed measures such as Cohen’s d, Hedges’ g, mean differences, and Pearson’s r can be negative. The sign normally indicates direction, not whether the result is “good” or “bad.” If d is calculated as M₁ − M₂, a negative value means Group 1 has the lower mean. Preserve the sign when reporting the result unless your method explicitly defines a directionless magnitude.
Why Does Effect Size Matter in Research?
Statistical Significance vs Practical Significance
Statistical significance and practical importance are different questions. The ASA states that a p-value does not measure effect size or the importance of a result, and scientific conclusions should not be based only on whether a p-value passes a threshold. .
That means “p < .05” should not be translated into “large,” “important,” or “clinically meaningful.” An effect estimate provides magnitude; the research context determines whether that magnitude matters.
Why a Small P-Value Does Not Mean a Large Effect
With a very large sample, even a small difference can produce a small p-value. With a small sample, a substantial observed effect may remain statistically uncertain. Sample size changes precision and statistical power; it does not mechanically make the underlying population effect larger.
Why Effect Sizes Matter for Replication and Meta-Analysis
Effect estimates can be compared, synthesized, and used in planning in ways that a yes/no significance label cannot. Meta-analysis requires effect measures that can be placed on a common scale and weighted by their uncertainty. Cochrane and Campbell both organize synthesis around explicit effect measures rather than significance thresholds. and .
Why Confidence Intervals Should Accompany Effect Sizes
A point estimate without uncertainty can create false precision. APA’s reporting standards emphasize transparent quantitative reporting, and APA journal guidance commonly requires or recommends effect sizes with confidence intervals. and .
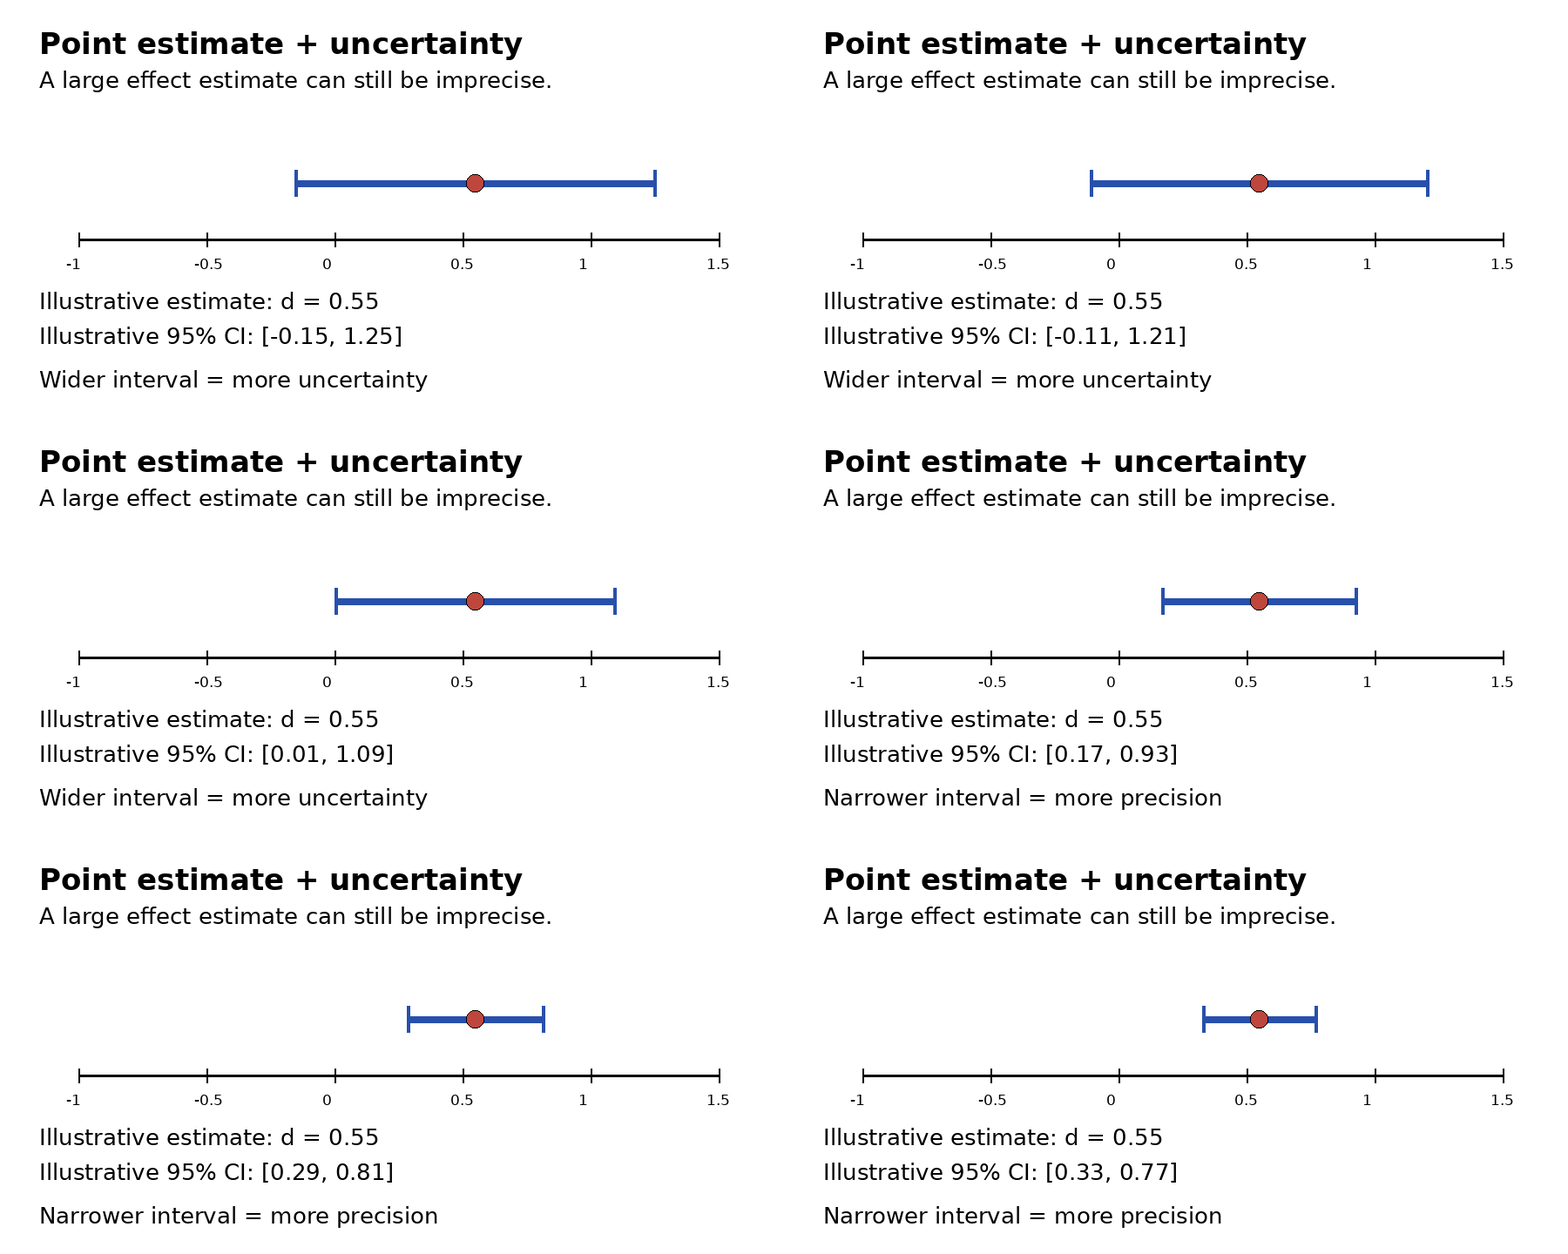
The same point estimate can support very different conclusions depending on how precise the estimate is.
Which Effect Size Should You Use?
The best first question is not “Which formula do I remember?” It is “What did I measure, and how was the study designed?” Outcome type, dependence between observations, and the intended interpretation determine the appropriate effect measure.
Quick Effect Size Selection Table by Study Design
| Research situation | Commonly useful effect measure | Key caution |
|---|---|---|
| Two independent groups, continuous outcome | Mean difference, Cohen’s d, Hedges’ g | Use the correct pooled SD; inspect unequal variances. |
| Same participants measured twice | Paired/repeated-measures effect size | The pre-post correlation and chosen standardizer can matter. |
| Controlled pretest-posttest study | Design-specific standardized change or difference-in-differences | Do not treat it as a simple independent posttest comparison. |
| Two continuous variables | Pearson’s r; sometimes r² | Correlation does not by itself establish causality. |
| ANOVA | η², partial η², generalized η², ω², or f | These statistics use different denominators and are not interchangeable. |
| 2 × 2 categorical table | φ, risk ratio, odds ratio, risk difference | Choose based on the decision you need to communicate. |
| Larger contingency table | Cramér’s V | Interpret relative to table dimensions and subject-matter context. |
| Meta-analysis, continuous outcomes on different scales | Standardized mean difference, often Hedges’ g | Standardization inherits the variability of the included populations. |
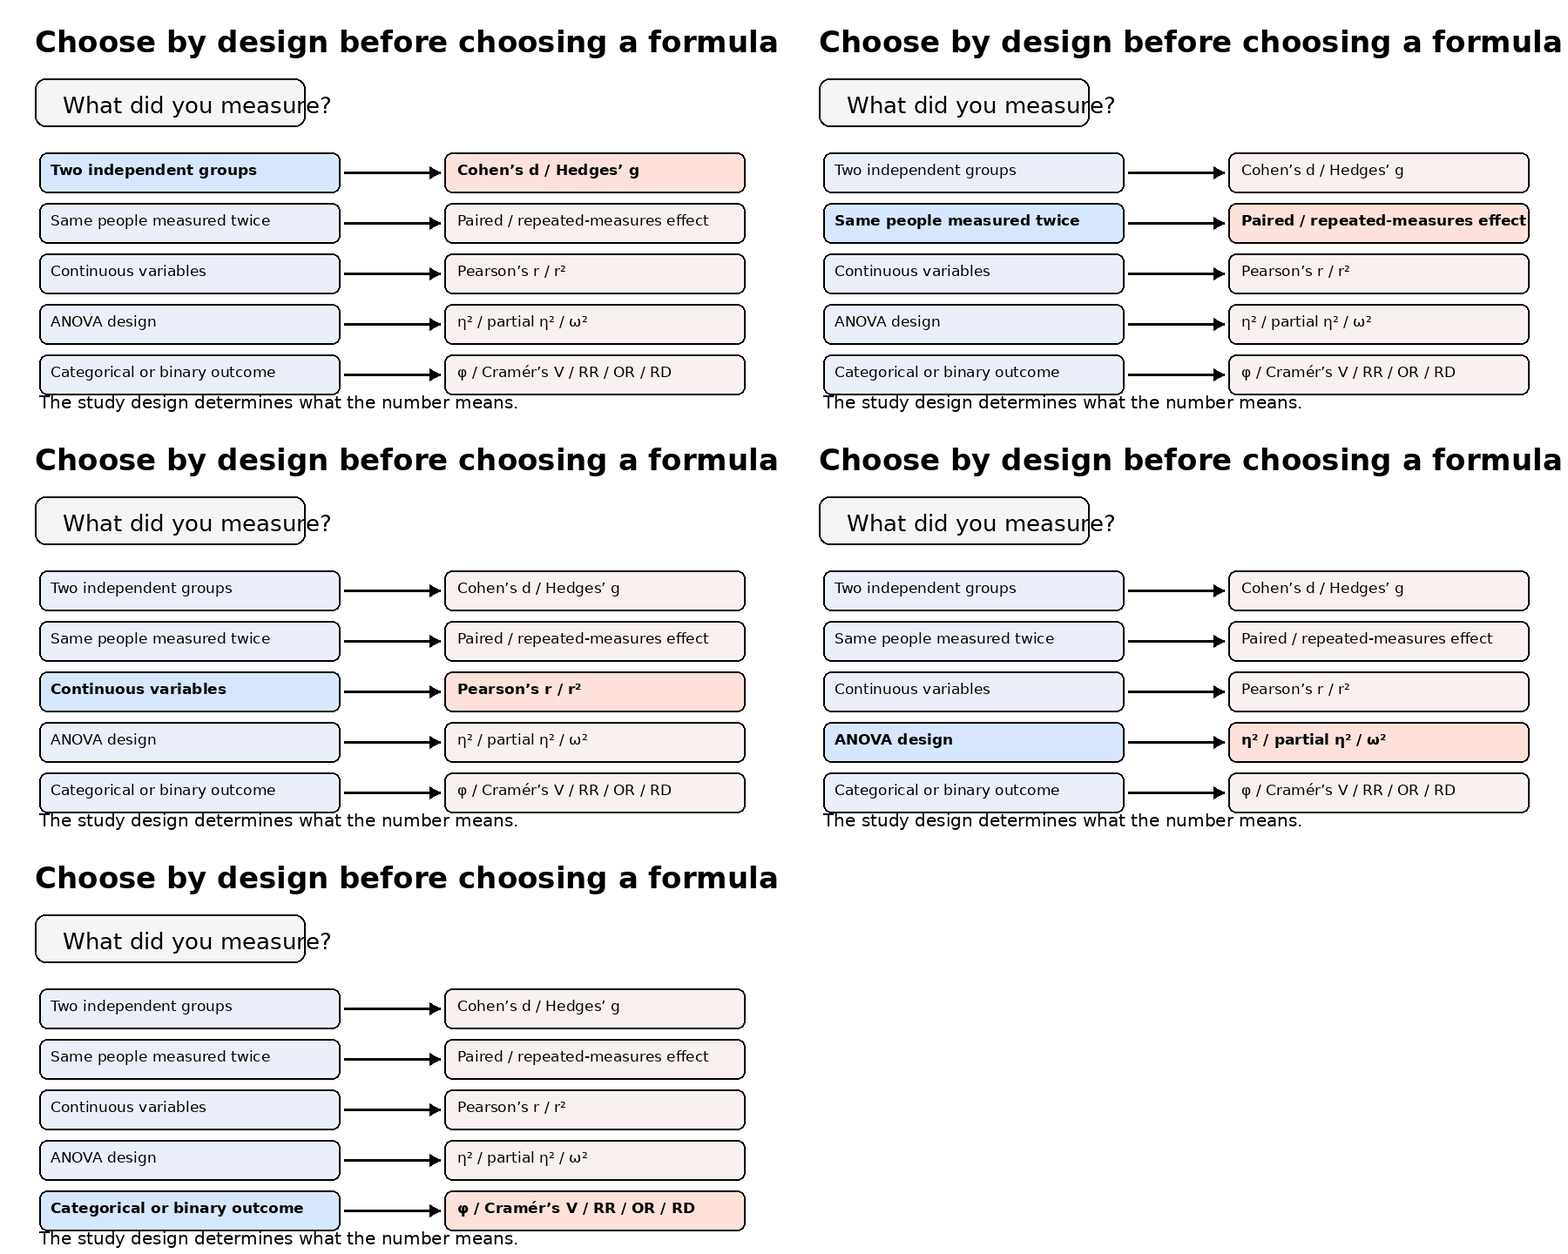
Choose by design first. The study structure determines what an effect-size number means.
Cohen’s d: Formula, Calculation, and Interpretation
Cohen’s d Formula
For two independent groups, Cohen’s d is:
d = (M₁ − M₂) / SDpooled
The pooled standard deviation is not simply the average of the two SDs when group sizes differ. The canonical weighted form is:
SDpooled = √[((n₁ − 1)SD₁² + (n₂ − 1)SD₂²) / (n₁ + n₂ − 2)]
This is the pooled within-group standard deviation used by the .
Weighted Pooled SD for Unequal Sample Sizes
Unequal sample sizes do not automatically require Hedges’ g instead of Cohen’s d. They require the pooled variance to weight each group correctly. The larger group contributes more information to the pooled estimate because its variance is based on more degrees of freedom.
If variances differ substantially, however, the question is not only mathematical. Ask whether pooling the SDs is substantively defensible. When an intervention itself plausibly changes variability, a control-group standardizer such as Glass’s Δ may sometimes be easier to justify.
Worked Cohen’s d Example
Suppose a training study reports n = 25, M = 78, SD = 10 for the intervention group and n = 25, M = 70, SD = 12 for the control group. The weighted pooled SD is about 11.05, so:
d = (78 − 70) / 11.05 ≈ 0.72
The intervention mean is approximately 0.72 pooled standard deviations higher than the control mean. Cohen’s conventional reference points would place this between “medium” and “large,” but practical importance should be judged against comparable studies, costs, outcomes, and the confidence interval rather than the label alone.
Hedges’ g vs Cohen’s d
Hedges’ g Formula and Small-Sample Correction
Hedges’ g applies a correction factor J to Cohen’s d. Campbell documents the common approximation:
J = 1 − 3 / [4(n₁ + n₂ − 2) − 1]
g = J × d
The exact correction uses the gamma function, but the approximation is close for common applications. .
When Is Hedges’ g Preferred?
Hedges’ g is particularly useful when the standardized mean difference is estimated from a small sample or when you want a bias-corrected effect for meta-analysis. It is not selected because group sizes are unequal, and it does not begin at a magic cutoff. The correction changes smoothly as degrees of freedom change.
How Different Are d and g in Practice?
In the worked example above, d ≈ 0.72 and g ≈ 0.71. The difference is small because the total sample is 50. With much smaller samples, the correction is more noticeable. Report the statistic you actually calculated and explain the method if there is any ambiguity about the standardizer.
Other Effect Sizes for Group Differences
Glass’s Delta
Glass’s Δ standardizes the mean difference using a reference group’s standard deviation, often the control SD:
Δ = (Mtreatment − Mcontrol) / SDcontrol
It can be useful when the intervention plausibly changes variability and the control group better represents the untreated measurement scale. This is a methodological choice, not an automatic response to unequal SDs.
Paired-Samples and Repeated-Measures Effect Sizes
Do not use an independent-groups d formula when the same people are measured twice. Within-subject observations are correlated, and different repeated-measures effect sizes use different standardizers. Lakens shows why within- and between-subject effect sizes are not generally interchangeable. .
For controlled pretest-posttest studies, Campbell provides specific difference-in-differences approaches and notes that the pre-post correlation affects the sampling variance. .
Standardized Mean Difference in Meta-Analysis
A standardized mean difference is useful when studies measure the same underlying construct using different scales. Cochrane’s guidance is clear that if studies use a common, meaningful scale, the raw mean difference can be preferable because it preserves natural-unit interpretation. .
Effect Sizes for Correlation and Regression
Pearson’s r as an Effect Size
Pearson’s r ranges from −1 to +1 and describes the direction and strength of a linear relationship between two continuous variables. Cohen’s conventional reference values are about |r| = 0.10, 0.30, and 0.50 for small, medium, and large effects. .
Those thresholds are not universal. For example, Gignac and Szodorai found that correlations in individual-differences research were often smaller than Cohen’s generic “large” benchmark, illustrating why discipline-specific distributions can be more informative than global cutoffs. .
What Does r² Mean?
If r = −0.42, then r² = 0.176. In a simple bivariate correlation, the variables share about 17.6% of variance. Avoid writing that one variable “explains” or “causes” 17.6% of the other unless the research design supports a causal interpretation.
Worked Correlation Effect Size Example
Suppose study hours and exam scores correlate at r = 0.35. Under Cohen’s conventional references, that is around a medium association. Squaring r gives r² ≈ 0.123, so the variables share about 12.3% of variance in the observed linear relationship. The practical meaning still depends on measurement quality, range restriction, confounding, and the population studied.
Effect Sizes for ANOVA: Eta Squared, Partial Eta Squared, and Omega Squared
What Is Eta Squared (η²)?
Eta squared expresses the proportion of total observed variance associated with an ANOVA effect:
η² = SSeffect / SStotal
If η² = 0.10, 10% of the total sample variance is associated with that effect in the fitted analysis.
What Is Partial Eta Squared (ηp²)?
Partial eta squared uses a different denominator:
ηp² = SSeffect / (SSeffect + SSerror)
Because other modeled effects are excluded from the denominator, partial η² can be larger than η² and is not automatically comparable across different designs. In a simple one-way ANOVA the two coincide, but factorial and repeated-measures settings require more care. .
What Is Omega Squared (ω²)?
Omega squared is designed as a less biased estimate of the corresponding population effect. For a simple fixed-factor between-subjects ANOVA, a common form is:
ω² = [dfeffect(MSeffect − MSerror)] / (SStotal + MSerror)
More complex within-subject and mixed designs require design-specific variants. Lakens discusses these distinctions and cautions against treating a single omega-squared formula as universal. .
Worked ANOVA Effect Size Example
If SSeffect = 450 and SStotal = 1,800, then η² = 0.25. If dfeffect = 2, MSeffect = 225, and MSerror = 75, then ω² ≈ 0.16. Both suggest a sizable effect under generic benchmarks, but they estimate related quantities differently and should not be substituted without explanation.
Effect Sizes for Categorical and Binary Data
Phi and Cramér’s V
For a 2 × 2 contingency table, the phi coefficient can be computed from chi-square as:
φ = √(χ² / N)
For larger contingency tables, Cramér’s V adjusts for the smaller table dimension:
V = √[χ² / (N × min(r − 1, c − 1))]
Cramér’s V ranges from 0 to 1. Generic “small/medium/large” labels are less portable here because the interpretation depends in part on table dimensions and substantive context.
Odds Ratio, Risk Ratio, and Risk Difference
For binary outcomes, several effect measures answer different questions. A risk ratio compares event probabilities, an odds ratio compares odds, and a risk difference expresses an absolute probability difference. Cochrane treats these as distinct measures because each communicates a different aspect of the same underlying data. .
A ratio of 1 represents no relative difference for RR or OR; a risk difference of 0 represents no absolute difference. When communicating to decision-makers, an absolute effect can often be easier to interpret, especially when baseline risk varies.
How to Interpret Effect Size
Cohen’s Small, Medium, and Large Benchmarks
| Measure | Small | Medium | Large | Use with caution because… |
|---|---|---|---|---|
| Cohen’s d / Hedges’ g | 0.20 | 0.50 | 0.80 | The same standardized effect can have different practical meaning across fields. |
| Pearson’s |r| | 0.10 | 0.30 | 0.50 | Typical correlations differ substantially by research domain. |
| η² | 0.01 | 0.06 | 0.14 | Do not automatically transfer these labels to partial η² in complex designs. |
These are conventional orientation points associated with Cohen’s power-analysis framework, not universal definitions of scientific or practical importance. .
Why Effect Size Benchmarks Are Guidelines, Not Universal Rules
A d of 0.30 may be trivial in one setting and consequential in another. A small standardized change applied to millions of people can have a large population impact, while a “large” standardized effect on an unimportant surrogate outcome may have little decision value.
The better sequence is to interpret the effect in natural units when possible, compare it with relevant prior evidence, examine uncertainty, and then use generic benchmarks only as a fallback. Cochrane similarly emphasizes effect interpretation in context rather than relying on a label alone. .
Same Mean Difference, Different Standardized Effect
Because d divides by a standard deviation, the same raw difference can produce different standardized effects in populations with different variability. This is not a bug; it is a consequence of standardization. It also means standardized effect sizes can be difficult to compare when variability differs for reasons unrelated to the intervention. Reporting the raw effect alongside d or g often improves interpretability.
How to Calculate Effect Size Step by Step
| Stage | What to do | Why it matters |
|---|---|---|
| Identify the design | Determine whether observations are independent, paired, repeated, clustered, or pretest-posttest. | The design controls the appropriate numerator, denominator, and variance formula. |
| Identify the outcome | Classify it as continuous, binary, categorical, ordinal, count/rate, or time-to-event. | Different outcomes support different effect measures. |
| Choose the measure | Select the effect that best matches the question and the audience. | The “best” statistic is the one that communicates the decision-relevant quantity. |
| Gather the statistics | Use raw data or the required summary statistics, such as means, SDs, n, t, F, χ², or cell counts. | Conversions are only valid when the originating analysis is known. |
| Calculate the estimate | Use the design-specific equation and document the standardizer. | Two statistics with the same symbol can mean different things if calculated differently. |
| Quantify uncertainty | Calculate a confidence interval or other interval estimate where appropriate. | A point estimate alone does not show precision. |
| Interpret and report | State direction, magnitude, uncertainty, context, and the method used. | Readers need enough information to evaluate and reproduce the result. |
Worked Effect Size Examples
Cohen’s d for Treatment vs Control
Treatment: n = 25, M = 78, SD = 10. Control: n = 25, M = 70, SD = 12. The weighted pooled SD is about 11.05 and d ≈ 0.72.
Hedges’ g for a Small-Sample Study
Suppose d = 0.80 with n₁ = 8 and n₂ = 8. The correction J is about 0.945, so g ≈ 0.76. The correction is visible here because the sample is small, but there is still no threshold at which the correction suddenly switches on.
Eta Squared and Omega Squared for ANOVA
With SSeffect = 450 and SStotal = 1,800, η² = 0.25. Using dfeffect = 2, MSeffect = 225, and MSerror = 75 gives ω² ≈ 0.16. The corrected estimate is smaller because omega squared adjusts sample-level inflation.
Pearson’s r and Shared Variance
If r = −0.42, then r² ≈ 0.176. The variables share about 17.6% of variance in the observed linear relationship. The negative sign indicates direction; r² removes that directional information.
Cramér’s V for a Chi-Square Test
Suppose χ² = 18, N = 200, and the smaller table dimension minus one equals 2. Then V = √[18/(200 × 2)] ≈ 0.21. Interpretation should consider the table structure and the domain rather than applying one universal cutoff.
Binary Outcome in a Trial
If an event occurs in 12% of the treatment group and 20% of the control group, the risk ratio is 0.60 and the risk difference is −0.08, or an 8 percentage-point absolute reduction. Both are valid effect measures, but they communicate different aspects of the treatment effect.
Effect Size vs P-Value vs Confidence Interval
| Quantity | Main question | What it does not tell you alone |
|---|---|---|
| Effect size | How large or strong is the observed effect? | How precisely the population effect has been estimated. |
| P-value | How incompatible are the data with a specified model under its assumptions? | The probability the hypothesis is true, or the importance of the effect. |
| Confidence interval | What range of effect values is compatible with the data under the interval procedure? | Whether every value in the interval is equally plausible or practically meaningful. |
A large study can yield a small p-value for a tiny effect. A small study can yield a large effect estimate with substantial uncertainty. Neither situation is well described by the single word “significant.” .
Common Effect Size Mistakes and Misinterpretations
Treating Statistical Significance as Practical Importance
A result can be statistically detectable and still be too small to matter. Always separate the inferential question from the magnitude question.
Using the Wrong Standard Deviation in Cohen’s d
For independent groups, use an appropriate pooled within-group SD. For a reference-standardized effect such as Glass’s Δ, use the designated reference SD. For paired data, the correct denominator depends on the effect definition.
Ignoring Unequal Sample Sizes
The pooled variance should weight the group variances by their degrees of freedom. Equal weighting is only equivalent in special cases. Unequal n is not, by itself, a reason to switch from d to g.
Using Independent-Groups Formulas for Paired Data
Paired observations contain within-person dependence. Ignoring it changes the quantity being estimated and can misstate uncertainty. Use a method designed for the repeated-measures structure. .
Automatically Calling Every d = 0.50 “Important”
“Medium” is a generic reference label, not a practical decision rule. A domain-specific minimal important difference, historical distribution of effects, or cost-benefit threshold may be more useful.
Reporting an Effect Without Its Uncertainty
A precise d = 0.50 and an imprecise d = 0.50 do not support the same strength of conclusion. Report a confidence interval where a valid one can be estimated and make assumptions visible.
How Effect Size Is Used in Real Research
Clinical and Medical Research
Clinical decisions often benefit from both relative and absolute effects. A risk ratio can summarize proportional change, while an absolute risk difference can show what that change means at the observed baseline risk. Natural-unit effects can also be more interpretable than standardized effects when the outcome scale is clinically familiar.
Psychology and Behavioral Science
Standardized mean differences, correlations, and ANOVA effect sizes are common because constructs are often measured on scales without an obvious natural unit. The main practical risk is treating generic conventions as universal. Reporting the calculation method is especially important for within-subject effects. .
Education
Standardized effects can help compare interventions that use different achievement measures, but the context of the assessment, age group, duration, implementation quality, and comparison condition still influence interpretation. A single d value is not a complete description of an educational intervention.
A/B Testing and Product Experiments
For a conversion-rate experiment, the business decision may be better served by an absolute percentage-point difference, relative lift, and confidence interval than by converting everything to Cohen’s d. Standardization is useful when it solves a comparison problem; it should not replace a metric stakeholders already understand.
Meta-Analysis
Meta-analysis combines compatible effect estimates while accounting for their sampling uncertainty. When continuous outcomes measure the same construct on different scales, a standardized mean difference can place studies on a common metric. When a common meaningful scale exists, the raw mean difference may preserve more useful information. .
Effect Size in Education and the Hattie 0.40 Hinge Point
What Is the 0.40 Hinge Point?
Visible Learning MetaX uses an average effect size around 0.40 as a contextual reference point for its education synthesis. The current MetaX methodology page is Version 1.4, updated February 2026, and describes a research base of more than 2,103 meta-analyses, more than 132,000 studies, and more than 300 million students. It states that the average effect size across its catalogued influences is about 0.40. .
How Hattie’s Benchmark Differs From Cohen’s Benchmarks
Cohen’s 0.20, 0.50, and 0.80 reference values were general behavioral-science conventions for power analysis. The MetaX 0.40 reference is a contextual comparison within a particular evidence synthesis in education. They answer different benchmarking questions and should not be treated as competing universal laws.
Why Educational Effect Sizes Need Context
Meta-analytic averages can hide substantial variation in populations, interventions, measures, study designs, and implementation quality. MetaX itself frames influences as evidence-informed “good bets,” not guarantees that a strategy will work equally well everywhere. A school or researcher should therefore use the benchmark as context, then examine the actual intervention, population, costs, and local evidence.
Effect Size Symbols, Formulas, and Quick Reference
| Symbol | Measure | Typical use | Null value |
|---|---|---|---|
| d | Cohen’s d | Standardized difference between independent-group means | 0 |
| g | Hedges’ g | Bias-corrected standardized mean difference | 0 |
| Δ | Glass’s delta | Mean difference standardized using a reference/control SD | 0 |
| r | Pearson correlation | Linear association | 0 |
| η² | Eta squared | Proportion of total sample variance associated with an ANOVA effect | 0 |
| ηp² | Partial eta squared | Effect variance relative to effect plus associated error | 0 |
| ω² | Omega squared | Less-biased ANOVA population-effect estimate | 0 |
| φ | Phi | Association in a 2 × 2 table | 0 |
| V | Cramér’s V | Association in a larger contingency table | 0 |
| RR | Risk ratio | Relative event probability | 1 |
| OR | Odds ratio | Relative event odds | 1 |
| RD | Risk difference | Absolute probability difference | 0 |
FAQs
What Is a Good Effect Size?
There is no universal “good” effect size. A useful effect is large enough to matter for the research or practical decision, estimated precisely enough to interpret, and credible given the study design and evidence.
Is 0.5 a Large Effect Size?
If the statistic is Cohen’s d, 0.50 is conventionally called medium. If the statistic is r, 0.50 is conventionally large. An effect size number is therefore incomplete without naming the measure.
What Does an Effect Size of 0.8 Mean?
If d = 0.80, the group means differ by 0.8 pooled standard deviations. Cohen used 0.80 as a large conventional reference value. The practical meaning still depends on the outcome and context.
Can Effect Size Be Greater Than 1?
Yes. Cohen’s d and Hedges’ g are not bounded at 1. A d of 1.2 means the means differ by 1.2 pooled standard deviations. Correlation coefficients, by contrast, are bounded between −1 and +1.
Can Effect Size Be Negative?
Yes. For signed measures, the sign shows direction. A negative d does not mean the calculation failed.
Does Sample Size Affect Effect Size?
Increasing sample size does not mechanically enlarge the population effect, but sample effect-size estimates vary because of sampling error. Small-sample bias can also affect standardized mean differences, which is why Hedges’ g applies a correction. Larger samples generally improve precision.
Should I Report Cohen’s d or Hedges’ g?
Use the statistic that matches your analysis and reporting goal. Hedges’ g is attractive when small-sample bias matters or when preparing standardized mean differences for meta-analysis. Do not use an arbitrary N = 50 rule.
What Effect Size Should I Use for ANOVA?
It depends on the design and the quantity you want to communicate. η², partial η², generalized η², omega-squared variants, and Cohen’s f are related but not interchangeable. Report what your design supports and define it clearly.
What Effect Size Should I Use for Chi-Square?
For a 2 × 2 table, phi is a natural association measure. For a larger contingency table, Cramér’s V is common. If the table represents treatment and a binary outcome, RR, OR, or RD may be more decision-relevant.
How Do I Convert a P-Value Into an Effect Size?
Only under specific conditions. An exact p-value from a known independent t test can be inverted to recover the corresponding t statistic and then d, provided the degrees of freedom, sample sizes, tail specification, and direction are known. A generic p-value does not uniquely determine an effect size. .
Do I Still Need a P-Value if I Report Effect Size?
They provide different information. A transparent report may include descriptive statistics, an effect estimate, its interval estimate, and the relevant inferential statistic. No single number should be expected to carry the entire conclusion.
Should Effect Sizes Include Confidence Intervals?
Where a valid interval can be estimated, yes. The interval shows precision and helps readers distinguish a stable estimate from one that remains highly uncertain. This is consistent with transparent reporting guidance in APA JARS. .
Effect Size Quick Summary and Next Steps
The most important step in using an effect size calculator is choosing the correct effect measure before entering numbers. Two independent-group means may support Cohen’s d or Hedges’ g; paired data require a repeated-measures approach; ANOVA measures such as η² and partial η² use different denominators; and binary outcomes often communicate better through risk ratios, odds ratios, or risk differences.
After calculation, do not stop at “small,” “medium,” or “large.” Preserve direction, examine the confidence interval, report the formula or effect definition when ambiguity is possible, and interpret the estimate against meaningful evidence from the field. If the original unit is easy to understand, report that raw effect alongside the standardized one.
There is no universally best effect size and no universal threshold that makes an effect important. The best effect measure is the one that fits the study design, preserves the meaning of the outcome, communicates uncertainty, and helps the intended audience make a better decision.
Sources and Methodology
This guide prioritizes primary or authoritative methodological sources. Core formulas and design-specific cautions were checked against the Campbell Collaboration effect-size calculator and equations; effect-measure selection against the Cochrane Handbook; p-value interpretation against the American Statistical Association; reporting guidance against APA JARS; within-subject and ANOVA distinctions against Lakens; conventional benchmarks against Cohen; and the education benchmark section against the current Visible Learning MetaX methodology page.
| Source | How it is used in this guide |
|---|---|
| American Statistical Association | P-value interpretation and limitations. |
| APA Style JARS | Transparent research reporting and effect-size/uncertainty context. |
| Cochrane Handbook, Chapter 6 | Choosing effect measures for continuous and binary outcomes. |
| Campbell Collaboration Effect Size Calculator | Input pathways and meta-analysis-oriented effect-size calculation. |
| Campbell equations | Weighted pooled SD, Hedges correction, variances, CIs, and conversions. |
| Lakens (2013) | Within-subject effects, ANOVA effect sizes, and interpretation practice. |
| Cohen (1988) | Conventional effect-size reference values and power framework. |
| Visible Learning MetaX | Current education-specific 0.40 reference and research-base description. |