
Fisher’s Exact Test: Guide, SPSS Steps and Examples
Statistical Methods · Updated July 23, 2026
Fisher’s exact test determines whether two categorical variables are associated, usually in a 2×2 contingency table. It calculates an exact p-value under fixed marginal totals, making it useful when samples are small or cell counts are sparse.
Use it after checking independence, coding, and test direction. Report the p-value with proportions, an odds ratio, a confidence interval, and the study context.
Decision Path: Should You Use Fisher’s Exact Test?
1. What Is Fisher’s Exact Test in Simple Terms?
Fisher’s exact test asks whether the observed counts would be unusually extreme if two variables were independent. Examples compare treatment with recovery, exposure with disease, or group membership with a yes-or-no response.
The null hypothesis is no association. In a 2×2 table, it can also be expressed as a population odds ratio of one. The result addresses statistical compatibility, not causation. [1]
2. Core Concepts of Fisher’s Exact Test Explained
A 2×2 contingency table contains four observed frequencies, labeled a, b, c, and d. Row and column totals are the marginal totals, while N is the total sample.
The p-value measures extremeness under the null hypothesis. The odds ratio estimates association strength, and its confidence interval shows uncertainty.
| Outcome: Yes | Outcome: No | |
|---|---|---|
| Exposure: Yes | a | b |
| Exposure: No | c | d |
Table probability: P = ((a+b)!(c+d)!(a+c)!(b+d)!)/(a!b!c!d!N!)
3. How Does Fisher’s Exact Test Work?
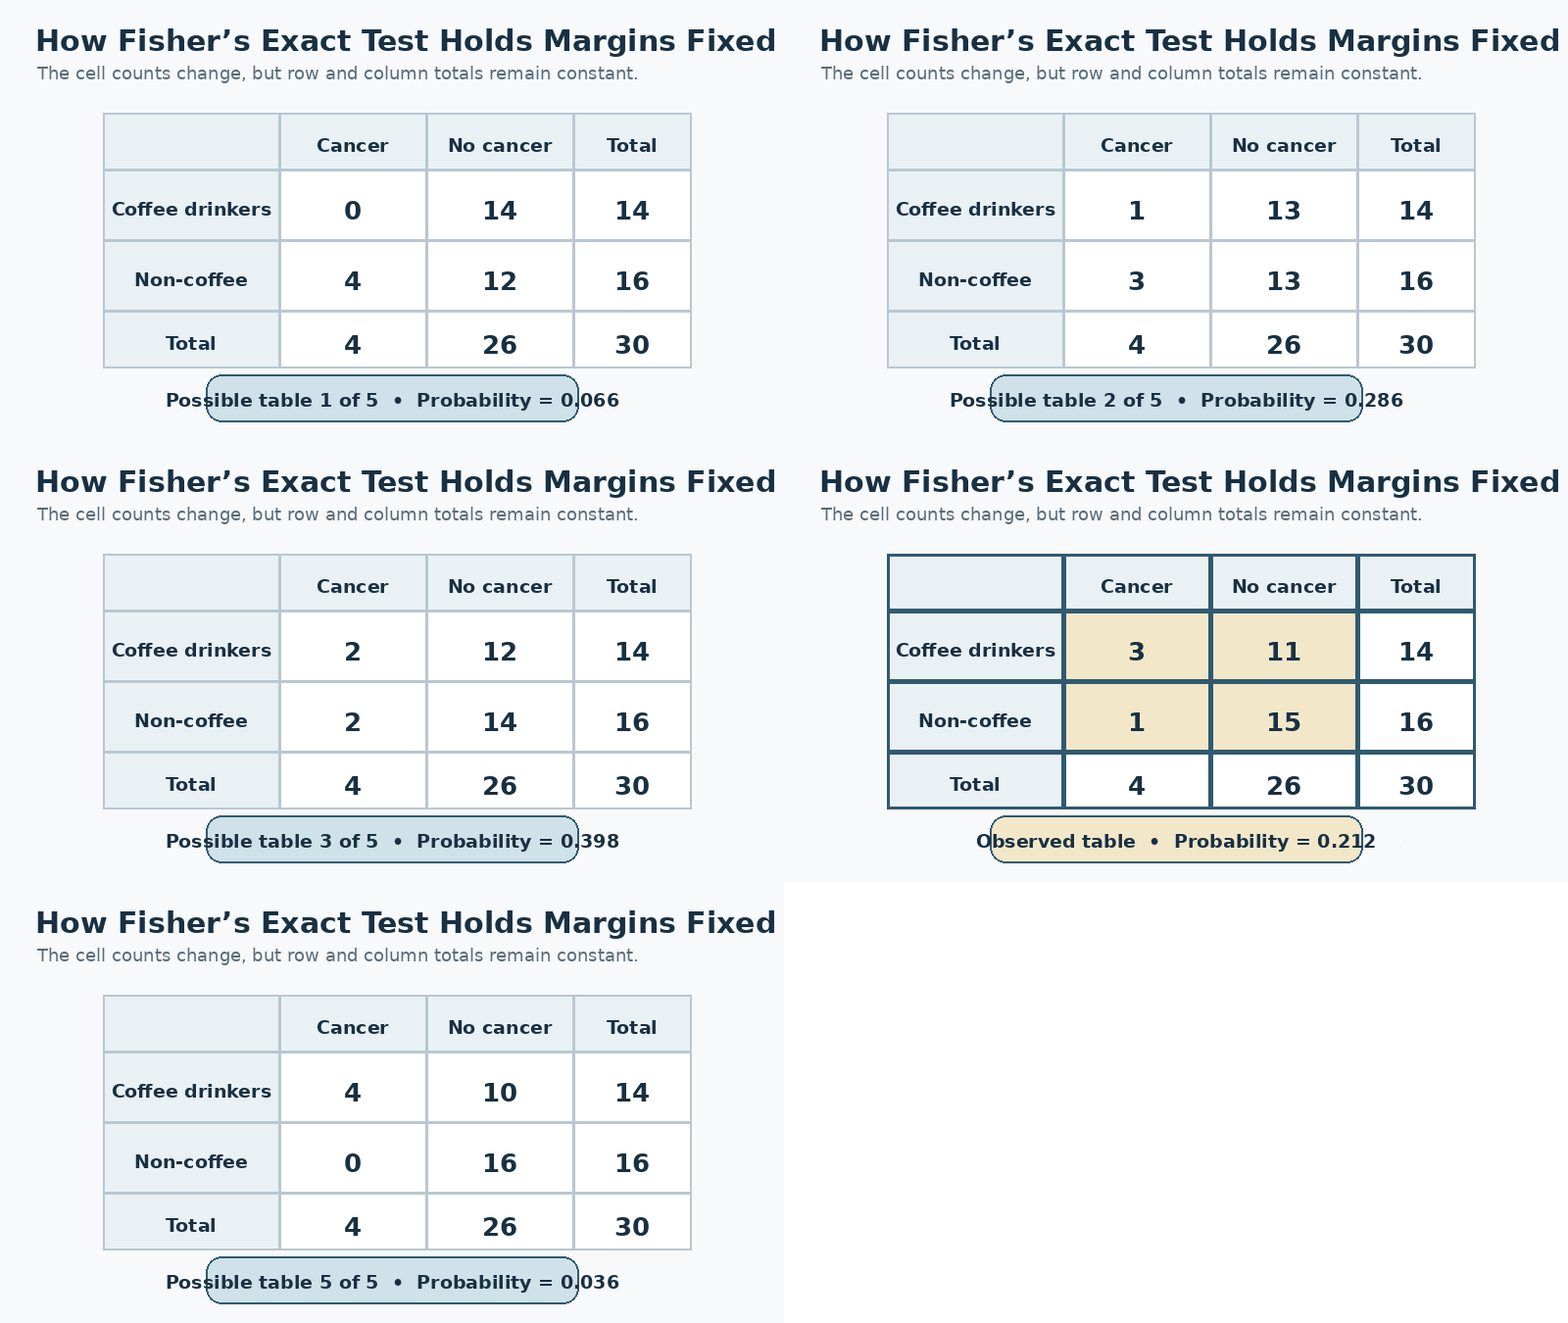
The test considers every table compatible with the observed margins and calculates its probability from the hypergeometric distribution. Relevant probabilities are combined according to the selected one-sided or two-sided convention.
From what I’ve seen, “fixed margins” causes the most confusion. Think of rearranging cases among four cells while keeping the numbers exposed, unexposed, positive, and negative unchanged.
4. When Should You Use Fisher’s Exact Test?
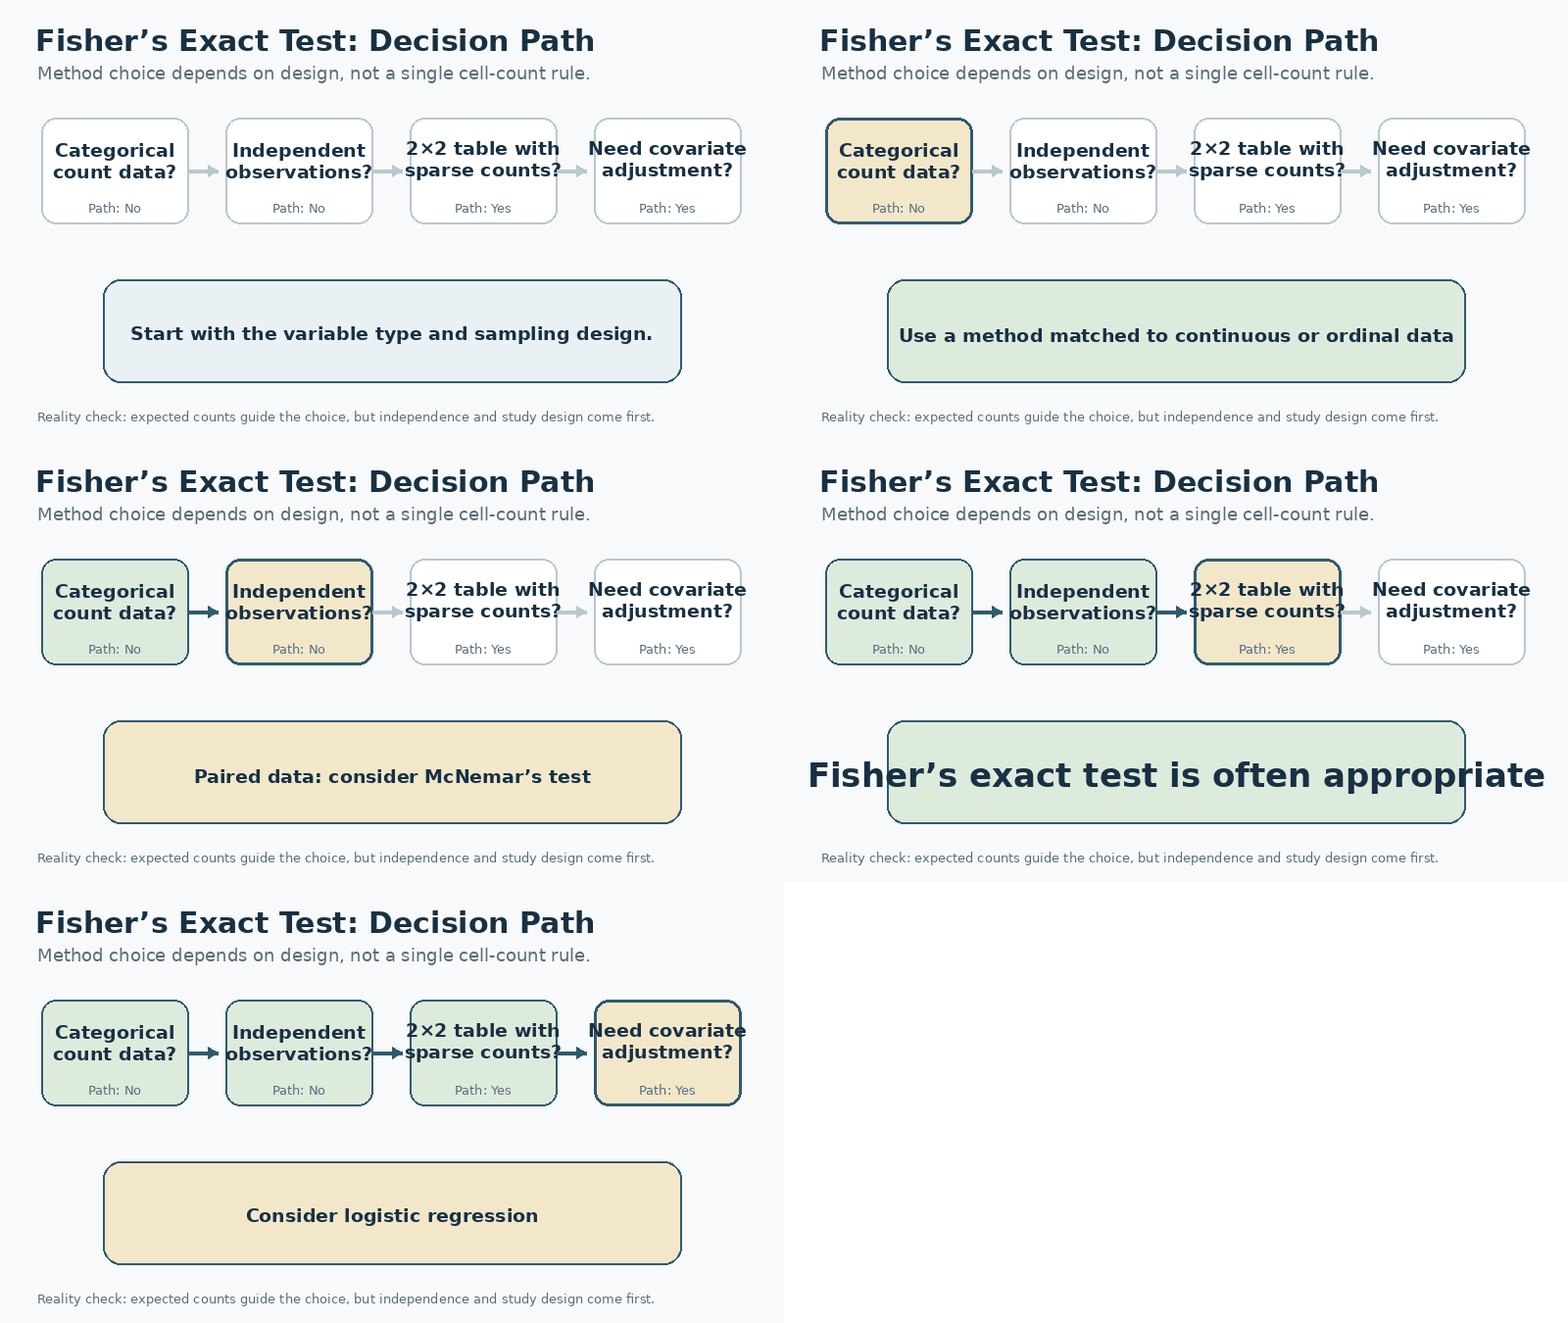
Use Fisher’s exact test for categorical counts with independent observations, particularly when a 2×2 table is small or sparse. It is often preferred when low expected counts weaken the chi-square approximation.
A common mistake is to apply the rule “any observed cell below five means Fisher.” Expected counts, design, table structure, and the research question matter more than one observed count.
5. Fisher’s Exact Test vs. Chi-Square Test: Which Should You Choose?
The chi-square test uses a large-sample approximation; Fisher’s test calculates a conditional exact distribution. With sparse 2×2 data, Fisher is usually easier to defend. With larger counts, both often reach similar conclusions.
Theoretical advice often says “small sample equals Fisher, large sample equals chi-square,” but in practice there is no universal cutoff. Consider expected frequencies, design, power, and reporting requirements.
6. Assumptions of Fisher’s Exact Test You Must Check
The inputs must be frequency counts in mutually exclusive categories. Observations should be independent, and each case should contribute to one cell only. Standard use conditions on the row and column totals.
Paired responses usually require McNemar’s test. Repeated records from the same participant or cluster need methods that model that dependence.
7. How to Perform Fisher’s Exact Test Step by Step
Define the null and alternative hypotheses before examining results. Build the table, check coding and missing data, confirm independence, and inspect expected counts.
Choose a two-sided test unless a directional alternative was justified in advance. Report counts, percentages, p-value, odds ratio, confidence interval, software, and test direction.
What practitioners often do is preserve the data, syntax, output, and software version for reproducibility
Ready to analyze your table? Statistics Calculator — dataclue and verify the output against your study design and assumptions..
8. How to Run Fisher’s Exact Test in SPSS
In IBM SPSS Statistics, go to Analyze > Descriptive Statistics > Crosstabs. Put one variable in Rows and the other in Columns. Under Statistics, select Chi-square; under Cells, request observed and expected counts and useful percentages.
For a 2×2 table, Crosstabs reports Fisher’s exact test. Where available, select Exact for exact or Monte Carlo significance. Read the correct exact line rather than automatically copying Pearson’s chi-square. [2]
9. Fisher’s Exact Test in SPSS, R, Python, and Excel: Tool Comparison
SPSS suits menu-based teaching and formatted output. R’s fisher.test() supports reproducible research, while Python’s scipy.stats.fisher_exact fits notebooks and automated pipelines. [1][3]
Excel lacks an equally direct built-in workflow, so add-ins or calculators are common. In real use, R or Python is preferable for scale and auditability; SPSS remains efficient for applied, non-coding workflows.
10. How to Interpret Fisher’s Exact Test Results Correctly
A p-value below the preselected alpha level supports rejecting the null hypothesis. A larger value means the study did not provide sufficient evidence of association; it does not prove independence.
Interpret proportions and the odds ratio beside the p-value. Wide confidence intervals may show that a small study is compatible with both a meaningful effect and little effect.
Common Misconceptions About Fisher’s Exact Test
Fisher’s exact test is not valid only below a count of five, and it does not measure effect size. Two-sided p-values can vary because software may define “as extreme” differently.
R and SciPy can also show different odds-ratio estimates because their default estimators differ. Statistical significance still cannot establish causation. [1][3]
Top Fisher’s Exact Test Mistakes and Statistical Risks to Avoid
Major risks include treating paired observations as independent, choosing a one-sided test after seeing the data, ignoring missing or duplicate cases, and reporting only the p-value.
Zero cells, reversed category order, selective exclusions, and undocumented recoding can change the output. A correct calculation cannot rescue a poorly constructed table.
Real-World Fisher’s Exact Test Examples in Clinical and Social Research
A small clinical trial might compare recovery under treatment and placebo when failures are rare. Epidemiologists may test exposure against disease, while social researchers may compare groups with voting or survey responses.
The reality layer is that clean design beats sophisticated computation. In local healthcare, laboratory, education, or market studies, duplication and unclear categories usually cause more damage than choosing between reasonable exact-test conventions.
Advanced Fisher’s Exact Test Strategy: Exact Does Not Always Mean Better
The contrarian insight is that exact is not automatically best. Fisher’s conditional test may be conservative, and Barnard’s or Boschloo’s test can have greater power for some 2×2 comparisons. [4]
Logistic regression is often more informative when covariates must be considered. Mid-p adjustments can reduce conservativeness but change the inferential framework, so they require justification.
The Future of Fisher’s Exact Test in AI-Assisted Research
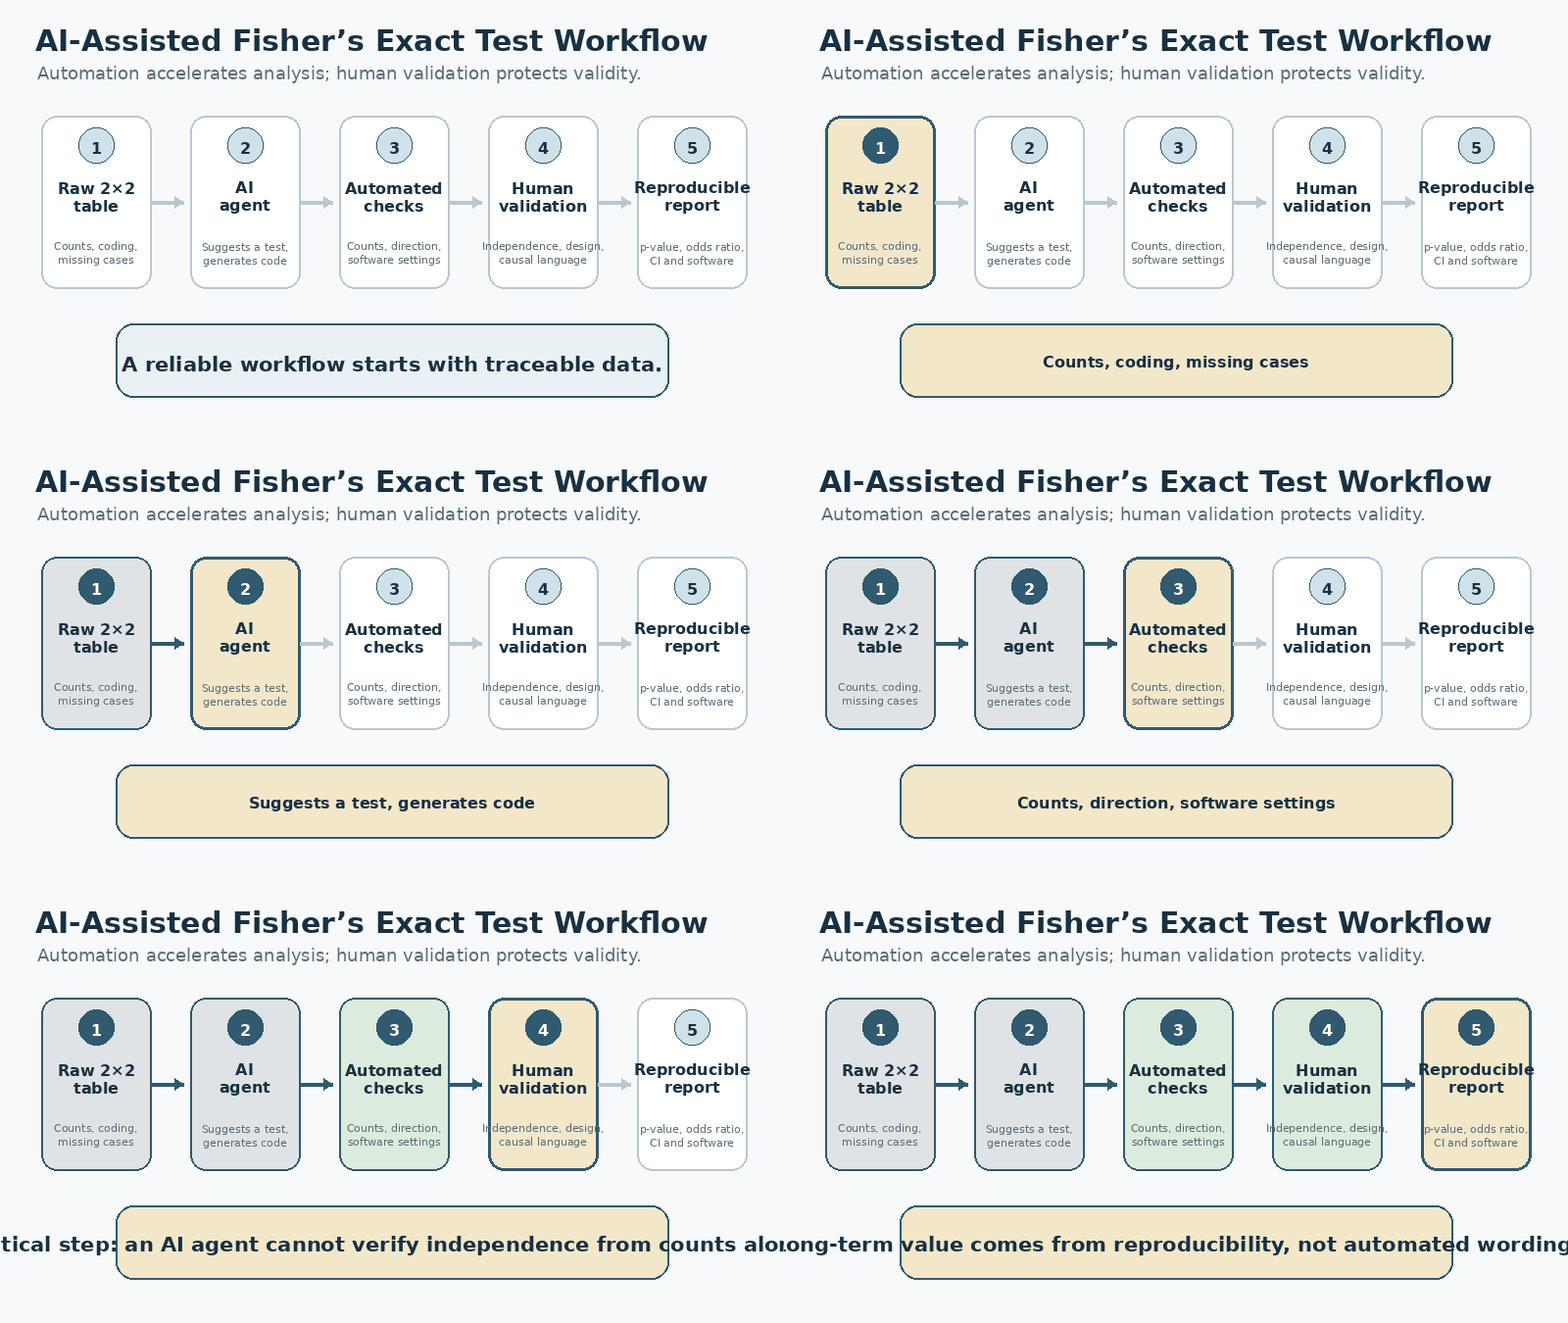
AI agents can inspect tables, suggest tests, generate SPSS syntax or R and Python code, and draft summaries. Human validation remains essential because an agent may miss dependence, coding errors, post-hoc hypotheses, or causal overstatement.
For generative search, the assumption that every query variation needs a separate page is weak. Google’s current guidance favors useful, non-commodity content and says standard SEO fundamentals remain relevant to AI Overviews and AI Mode. [5][6]
Quick Summary: How to Use Fisher’s Exact Test Correctly
Verify categorical variables and independent observations, build the table, inspect expected counts, choose test direction in advance, and use a reproducible tool.
Report counts, percentages, exact p-value, odds ratio, confidence interval, software, and limitations. Fisher’s exact test is most defensible when the statistical calculation, design assumptions, and reporting context are presented together.
FAQs
Is Fisher’s exact test always better than chi-square for small samples?
No. Fisher’s test avoids the chi-square approximation, but it can be conservative and may sacrifice power. Choose the method from the sampling design, expected counts, and decision cost rather than sample size alone.
Should I avoid this?
Avoid it when observations are paired, clustered, repeatedly measured, or when covariate adjustment is central to the question. McNemar’s test, clustered models, or logistic regression may be more appropriate.
Can a non-significant Fisher’s exact test prove no association?
No. A non-significant p-value shows insufficient evidence against the null hypothesis, not proof of no relationship. Small samples and wide confidence intervals can hide effects that remain practically important.
Why can SPSS, R, and Python return different results?
Because software may use different two-sided p-value conventions or odds-ratio estimators. Record the program, version, alternative hypothesis, and estimator so the analysis remains reproducible.
Will AI agents make Fisher’s exact test selection automatic?
No, not safely without human review. AI agents can automate code and checks, but long-term reliability depends on verifying independence, coding, study design, and whether a different statistical model answers the real question.
References
- [1] R Project, “Fisher’s Exact Test for Count Data.”
- [2] IBM, “Crosstabs,” IBM SPSS Statistics 32.0.0 documentation.
- [3] SciPy, “scipy.stats.fisher_exact,” SciPy 1.18.0 documentation.
- [4] SciPy, “scipy.stats.boschloo_exact,” SciPy 1.18.0 documentation.
- [5] Google Search Central, “Optimizing your website for generative AI features on Google Search.”
- [6] Google Search Central, “Introducing Search Generative AI performance reports in Search Console,” June 3, 2026.