
How to Report Statistical Results in APA 7
If you are trying to learnhow to report statistics in APA 7, the practical rule is simple: report enough information for a reader to understand the finding, then format each statistic according to APA conventions. For…
How to Report Statistics in APA 7: Rules, Templates, and Examples
If you are trying to learn how to report statistics in APA 7, the practical rule is simple: report enough information for a reader to understand the finding, then format each statistic according to APA conventions. For many inferential tests, that means relevant descriptive statistics, the test statistic and degrees of freedom where applicable, the exact p value, and an appropriate measure of effect magnitude or uncertainty.
The part that causes trouble is that there is no single formula that works for every analysis. The familiar pattern statistic(df) = value, p = value, effect size = value is useful for tests such as a t test, but regression, nonparametric analyses, factor models, and complex ANOVA designs require different information. The most reliable approach is to treat APA statistical reporting as a translation process rather than a notation exercise.
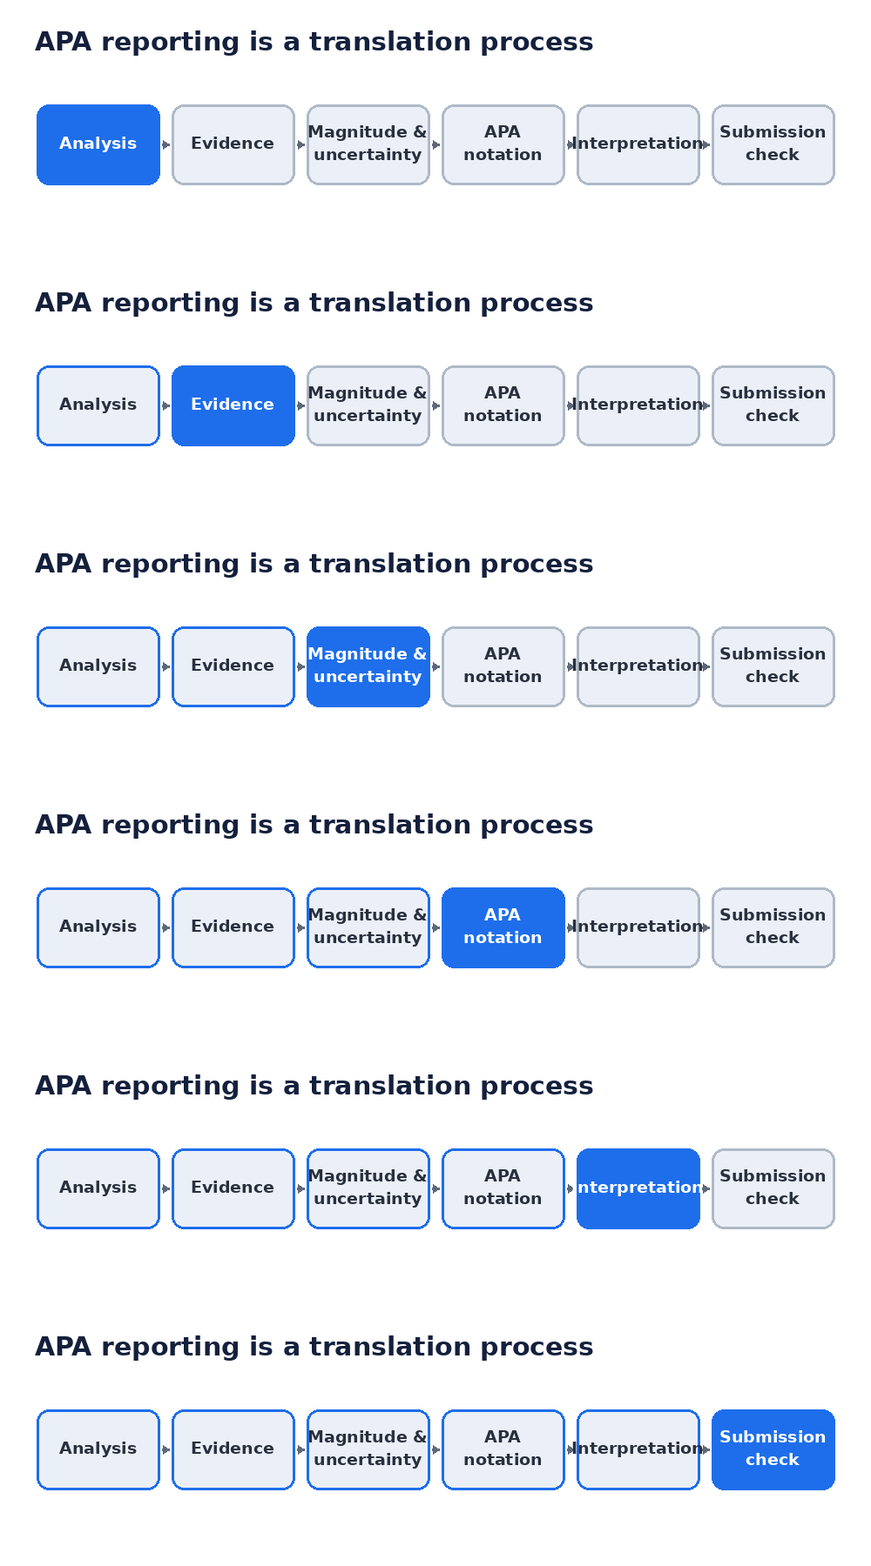
The American Psychological Association describes APA Style as a set of guidelines for clear, precise scholarly communication. The seventh-edition Publication Manual includes dedicated sections on numbers, statistical and mathematical copy, tables and figures, and Journal Article Reporting Standards, or JARS. APA Publication Manual
What APA 7 Statistical Reporting Actually Requires
A complete result should let the reader answer three questions: what happened in the data, what statistical evidence supports that statement, and how large or uncertain the effect appears to be. For a simple comparison, a compact statistical string may communicate this efficiently. For a complex model, the same information may need to be split across prose and a table.
A useful starting pattern is statistic(df) = value, p = value, effect size = value. For example, t(58) = 2.45, p = .018, Cohen’s d = 0.63. But this is a recurring pattern, not a universal grammar. A correlation coefficient is already an effect-size measure. Regression has both model-level and predictor-level statistics. A structural equation model requires multiple fit indices. A descriptive summary may not contain an inferential test at all.
It also helps to separate three things that online guides often blur together. APA formatting conventions govern presentation, such as italicizing p. Statistical reporting practice determines what information is scientifically useful, such as an effect estimate or confidence interval. Journal, university, or disciplinary requirements may add rules beyond the basic APA example. APA’s JARS framework is explicitly concerned with transparent, sufficiently detailed research reporting rather than typography alone. APA JARS
That distinction produces an important reality check: a sentence can be perfectly formatted and still be statistically incomplete, poorly interpreted, or based on the wrong analysis.
APA 7 Statistical Formatting Rules You Need to Know
Most formatting decisions can be handled with a small set of principles. Latin letters used as statistical symbols are generally italicized, while Greek letters are not. Put spaces around mathematical operators. Place degrees of freedom directly after the relevant test symbol. Use a leading zero only for values that can exceed 1. APA statistical formatting guide APA italics guidance
| Element | APA-style treatment | Example |
|---|---|---|
| Latin statistical symbols | Italicize when used as statistical symbols | M, SD, t, F, p, r, df, N, n, B, SE, d |
| Greek statistical symbols | Use standard type | α, β, η², χ² |
| Mathematical operators | Use spaces on both sides | p = .032; p < .001 |
| Degrees of freedom | Place immediately after the test symbol | t(48); F(2, 87) |
| Values that cannot exceed 1 | Omit the leading zero | p = .032; r = .46; R² = .21 |
| Values that can exceed 1 | Keep the leading zero | M = 0.82; t = 0.91; d = 0.64 |
| Confidence intervals | Give the confidence level and brackets | 95% CI [1.32, 4.81] |
How many decimal places should you use?
The common advice to report “two decimals for statistics and three for p values” is a useful shortcut, not an absolute rule. The better principle is to round enough to make the result readable without discarding meaningful precision. Inferential statistics such as t, F, χ², and correlations are commonly shown to two decimals. Exact p values are commonly shown to two or three decimal places. Descriptive statistics may use one or two decimals depending on the measurement scale and the precision readers need. APA-based statistics guidance
Consistency matters within comparable values. If every mean in a table represents the same scale and you choose two decimals, keep that precision across the column unless there is a substantive reason not to. Do not add meaningless digits simply because software prints them.
How to Report p Values in APA 7
When an exact p value is available and is at least .001, report the exact value rather than replacing it with a generic threshold such as p < .05. Write p = .032, not merely p < .05. For values smaller than .001, write p < .001. APA-based p-value guidance
Never report p = .000. Statistical software may display .000 because of rounding, but the calculated probability is not literally zero. The publication-ready form is p < .001.

Also omit the leading zero: p = .018, not p = 0.018. The leading-zero rule applies because a probability cannot exceed 1.
A p value should not carry the full interpretation of the result. A small p value does not tell you that an effect is large or practically important, and a result above .05 does not by itself establish that the underlying effect is exactly zero. Effect estimates and confidence intervals provide information that the significance test cannot.
How to Report Descriptive Statistics in APA 7
Descriptive statistics tell readers what the observed data looked like. They are especially important when an inferential result compares groups, conditions, or time points because the test statistic alone does not reveal the substantive direction or size of the difference.
Means and standard deviations are commonly reported together: Participants reported moderately high satisfaction (M = 22.45, SD = 4.12). For a group comparison, give the relevant descriptives for both groups: The intervention group scored higher (M = 85.30, SD = 5.21) than the control group (M = 78.40, SD = 6.45).
Use uppercase N for the total sample and lowercase n for a subgroup or subsample when the distinction matters. When the distribution or measurement scale makes the mean and standard deviation poor summaries, report a more appropriate descriptive measure, such as the median and interquartile range. APA Style determines how to present the statistic; statistical reasoning determines which descriptive statistic is appropriate.
How to Report Effect Sizes and Confidence Intervals
A significance test and an effect size answer different questions. The significance test evaluates evidence relative to a null model. An effect size describes the magnitude of a difference, association, or model result. A confidence interval shows the uncertainty around an estimate.
Common pairings include Cohen’s d or a related standardized mean difference for mean comparisons, η² or partial η² for ANOVA-family effects, r for correlations, R² for regression models, and Cramér’s V or φ for categorical associations. These are not interchangeable labels. Choose the measure that matches the design and the quantity you want readers to interpret.
APA’s reporting standards emphasize enough quantitative information for readers to evaluate findings, and APA journal guidance commonly expects effect-size information alongside significance tests. Exact requirements can differ across journals, so the target venue should be checked before submission. APA JARS APA reviewer guidance
A useful confidence-interval format is 95% CI [lower, upper], for example, 95% CI [1.32, 4.81]. Do not treat a confidence interval as a decorative addition. It helps the reader see which effect sizes remain compatible with the data and how precise the estimate is.
How to Report a t Test in APA 7
For a standard t test, report the relevant descriptive statistics, the t statistic, degrees of freedom, exact p value, and an appropriate effect-size estimate.
Independent-samples t test
Students who received tutoring scored higher (M = 85.30, SD = 5.21) than students who did not receive tutoring (M = 78.40, SD = 6.45), t(48) = 4.15, p < .001, Cohen’s d = 1.17.
Paired-samples t test
Scores were higher after training than before training, t(29) = 3.84, p < .001, d = 0.70. A stronger report would also provide the two time-point descriptives and, where useful, a confidence interval for the mean change.
One-sample t test
Participants scored above the scale midpoint, t(39) = 2.31, p = .026, d = 0.37. Make the comparison value clear in the surrounding sentence so readers know what the test statistic represents.
What if the degrees of freedom are decimals?
Do not convert decimal degrees of freedom to an integer simply because a textbook example uses whole numbers. Welch’s t test, for example, can legitimately produce a result such as t(42.67) = 2.38, p = .022. The decimal df identifies the analysis that was actually performed and should be preserved at appropriate precision.
How to Report ANOVA Results in APA 7
An ANOVA F statistic normally has two degrees of freedom: the numerator df and denominator df. A one-way result can be written as: A one-way ANOVA indicated that satisfaction differed across the three treatment conditions, F(2, 87) = 5.23, p = .007, η² = .11.
For factorial ANOVA, report each substantively relevant main effect and interaction separately. For example: There was a main effect of treatment, F(2, 114) = 6.28, p = .003, η²ₚ = .10. The treatment × age-group interaction was not statistically significant, F(2, 114) = 1.17, p = .315, η²ₚ = .02.
If the analysis uses a correction such as Greenhouse–Geisser, report the corrected test and corrected degrees of freedom. Do not replace the decimal df with the uncorrected integers merely to make the notation look familiar.
When an omnibus ANOVA is followed by planned comparisons or post hoc tests, identify the comparison procedure and report the comparisons that answer the research question. Tukey, Bonferroni, Games–Howell, and planned contrasts serve different purposes and make different assumptions. APA formatting does not determine which method is statistically appropriate.
How to Report Correlations in APA 7
For an individual Pearson correlation, report the coefficient, degrees of freedom, and p value: Academic self-efficacy was positively associated with examination performance, r(55) = .49, p < .001.
For the usual Pearson correlation test, the degrees of freedom are N − 2, so r(55) corresponds to 57 observations if there are no complications from missing data. The coefficient r already communicates effect magnitude, so there is no need to attach Cohen’s d simply to satisfy a generic “effect size” slot.
For Spearman correlation, identify the method in the prose and use notation appropriate to the analysis and target journal. If you have many correlations, a correlation matrix is normally easier to read than a paragraph filled with coefficients, means, standard deviations, and significance values.
How to Report Regression Results in APA 7
Regression is one of the clearest examples of why a universal reporting string does not work. A regression has at least two reporting levels: the fit of the overall model and the estimates for individual predictors.
Report the overall model
The regression model significantly predicted job satisfaction, F(2, 97) = 8.36, p < .001, R² = .15. Depending on the purpose of the model, adjusted R², change in R², or additional fit information may also be relevant.
Report individual predictors
For a predictor, the unstandardized coefficient B communicates the change in the outcome associated with a one-unit change in the predictor, holding other predictors constant. The standardized coefficient β expresses the association in standard-deviation units and can help with within-model comparison, although it should not automatically replace B.
A fuller predictor report might read: Autonomy positively predicted job satisfaction, B = 2.18, SE = 0.72, β = .34, t(97) = 3.03, p = .003, 95% CI [0.75, 3.61].
When a model contains several predictors, a regression table is usually clearer than repeating every coefficient in prose. Use the text to explain the important pattern and the table to provide precise values. Logistic regression needs a different reporting vocabulary, commonly including odds ratios and their confidence intervals, so it should not be forced into a linear-regression template.
How to Report Chi-Square and Common Nonparametric Tests
Chi-square
A chi-square test of independence can be reported as: The distribution of responses differed between groups, χ²(2, N = 180) = 9.87, p = .007, Cramér’s V = .23. The χ is a Greek letter and is not italicized. The sample size is often included inside the parentheses with the degrees of freedom.
Readers also need the observed category pattern, usually through frequencies, percentages, or a contingency table. A statistically significant χ² value does not tell them which categories account for the association.
Mann–Whitney, Wilcoxon, Kruskal–Wallis, and Friedman tests
Nonparametric tests should be reported using the statistic the method actually produces, together with suitable descriptive summaries. A Mann–Whitney result might read: Scores were higher in Group A (Mdn = 24.00) than Group B (Mdn = 19.50), U = 312.50, p = .004.
Wilcoxon signed-rank, Kruskal–Wallis, and Friedman analyses have their own statistics and conventions. Software packages may label them differently, and effect-size practices vary. This is a situation where copying a template without checking the method can produce a polished but incorrect report.
From SPSS, R, jamovi, or JASP Output to APA Prose
IBM SPSS Statistics, R, jamovi, and JASP compute analyses and display output. They do not decide what belongs in your manuscript. The researcher still has to identify the statistic that answers the research question, select the relevant descriptive information, choose an appropriate effect measure, apply APA notation, and explain the result in words.
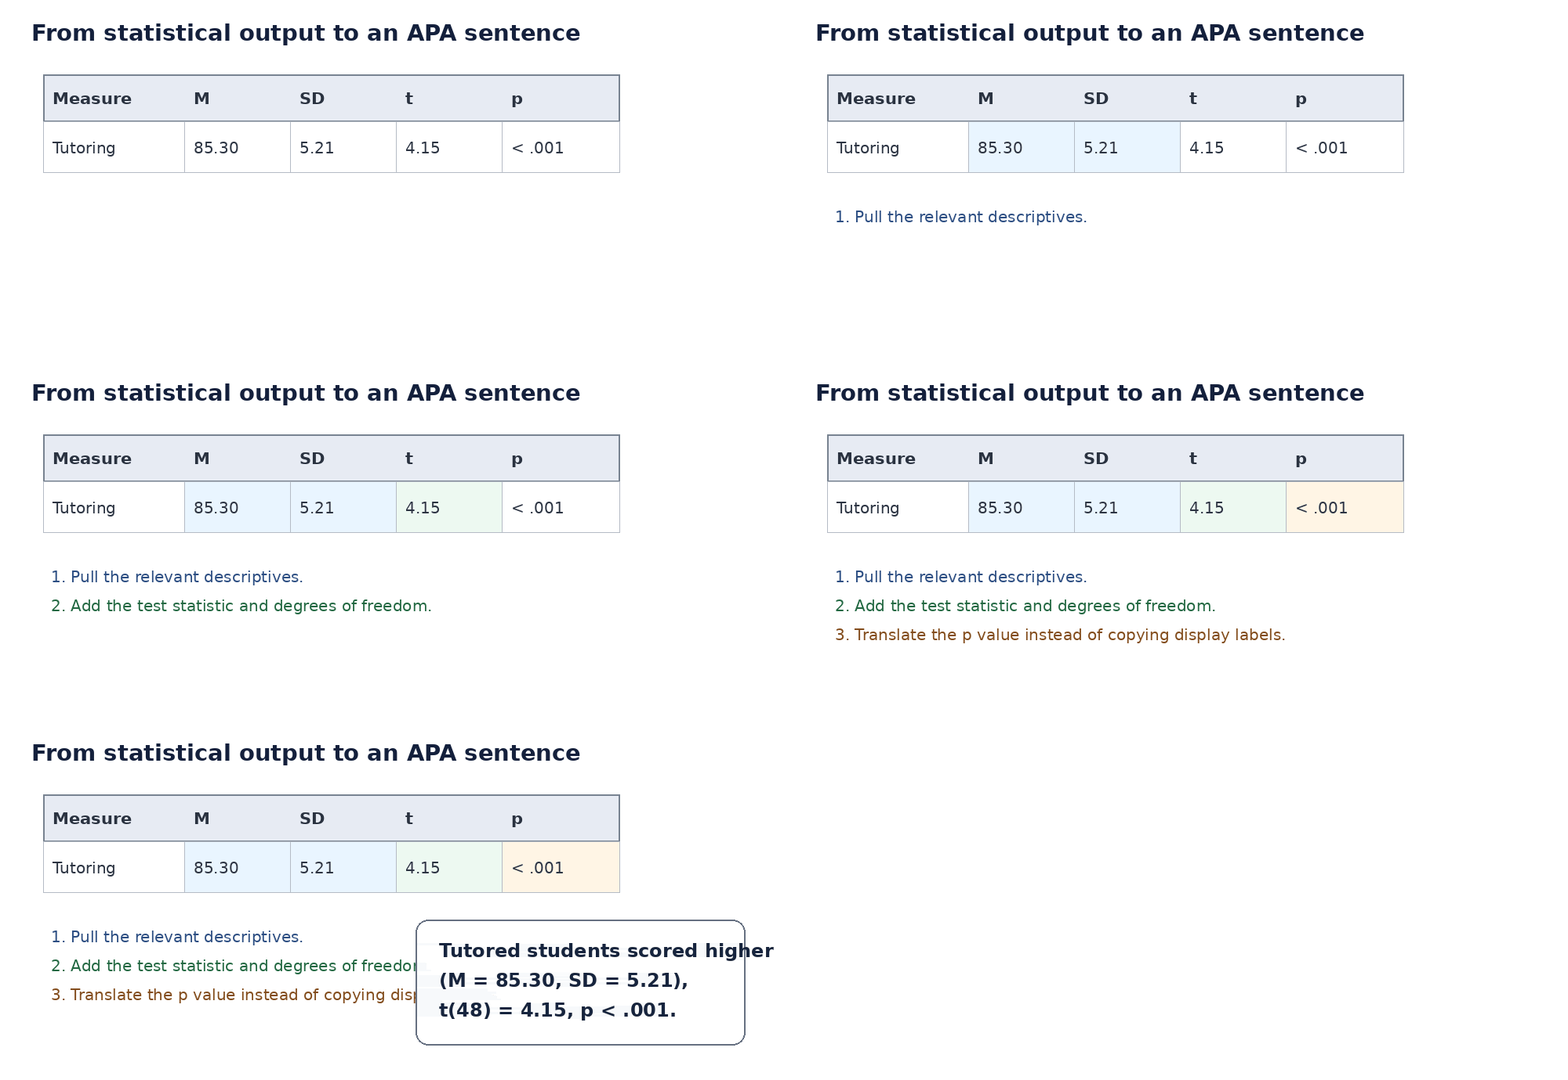
A practical output-to-report workflow is to identify the analysis first, then locate the relevant descriptives, test statistic, degrees of freedom, p value, effect estimate, and confidence interval where appropriate. Only after that should you format the final sentence or table.
This prevents several common errors. SPSS may display Sig. rather than p. R packages may return more precision than you need. jamovi or JASP may include effect sizes automatically for some analyses but not others. A coefficient table may contain statistics that are useful for diagnostics but unnecessary in the narrative. The goal is not to copy everything the software prints. The goal is to report enough of the right information for the analysis to be understood.
If your software does not provide an effect size or confidence interval needed for the manuscript, you may need an additional option, package, or calculation. Do not invent a value or silently omit it because it was absent from the default output.
How to Write Statistical Results in an APA 7 Results Section
A Results section should lead with the substantive finding, not with unexplained notation. Compare the fragment t(48) = 4.15, p < .001, d = 1.17 with the clearer sentence: Students who received tutoring scored higher than students who did not receive tutoring, t(48) = 4.15, p < .001, Cohen’s d = 1.17.
A fuller version combines descriptives, inference, magnitude, and uncertainty without turning the sentence into a data dump: Students who received tutoring scored higher (M = 85.30, SD = 5.21) than students who did not receive tutoring (M = 78.40, SD = 6.45). The difference was statistically significant, t(48) = 4.15, p < .001, Cohen’s d = 1.17. The estimated mean difference was 6.90 points, 95% CI [3.56, 10.24].
The Results section should describe what the analysis found without claiming more than the study design supports. Correlation does not establish causation. A nonsignificant result is not proof of no effect. Statistical significance is not the same as practical importance.
When should results go in a table?
Use prose for a small number of central findings and a table when readers need to compare many exact values. Regression coefficients, correlation matrices, descriptive statistics across several groups, and extensive pairwise comparisons often become clearer in a table. APA guidance also discourages unnecessary duplication between the text and tables or figures. APA reviewer guidance
APA table guidance identifies a table number, title, body, and optional note as the core elements. The table number is bold and the title is italicized. Tables should be designed for readability rather than decorated with unnecessary rules or shading. APA tables and figures guidance
Common APA Statistical Reporting Mistakes and Special Cases
The most damaging mistakes are not always typographic. Some alter the meaning of the analysis or hide information that readers need.
| Problem | Why it matters | Better approach |
|---|---|---|
| Reporting p = .000 | Treats a rounded display value as an exact probability | Report p < .001 |
| Using 0 before p, r, or R² | Breaks the leading-zero convention for values bounded by 1 | Use p = .023, r = .45, R² = .18 |
| Dropping the zero for Cohen’s d | Applies the bounded-statistic rule to a value that can exceed 1 | Use d = 0.65 |
| Forcing all results to two decimals | Can remove meaningful precision or add meaningless digits | Round for readability while preserving useful precision |
| Rounding corrected df to integers | Can misrepresent Welch or Greenhouse–Geisser results | Report the corrected decimal df |
| Reporting only a p value | Hides direction, magnitude, and uncertainty | Include relevant descriptives, effect information, and intervals |
| Copying a software table directly | Software output is not automatically publication-ready | Select, rename, round, and explain the relevant values |
| Repeating every table value in prose | Creates clutter and opportunities for inconsistencies | Use text for interpretation and tables for exact values |
| Calling .05–.10 “marginally significant” by default | Encourages an arbitrary significance category | Report the exact p value and interpret the evidence cautiously |
| Treating APA format as analysis validation | A polished sentence can still report an inappropriate test | Check the design, assumptions, and analysis before formatting |
The priority order matters. First verify the analysis. Second verify the numerical output. Third add magnitude and uncertainty. Fourth apply APA formatting. Fifth check the target venue. Spending time perfecting italics before confirming the test or values has low practical value.
APA 7 Statistical Reporting Quick Reference
The following patterns are starting points. Replace each placeholder only after confirming that the statistic belongs to the analysis you actually ran.
| Analysis | Common reporting pattern |
|---|---|
| Descriptive statistics | (M = 22.45, SD = 4.12) |
| Independent or one-sample t test | t(df) = X.XX, p = .XXX, d = X.XX |
| One-way or factorial ANOVA | F(df1, df2) = X.XX, p = .XXX, η² or η²ₚ = .XX |
| Pearson correlation | r(df) = .XX, p = .XXX |
| Regression model | F(df1, df2) = X.XX, p = .XXX, R² = .XX |
| Regression predictor | B = X.XX, SE = X.XX, β = .XX, t(df) = X.XX, p = .XXX |
| Chi-square | χ²(df, N = X) = X.XX, p = .XXX, Cramér’s V = .XX |
| Mann–Whitney | U = X.XX, p = .XXX, plus appropriate distributional summaries |
Frequently Asked Questions About APA 7 Statistical Reporting
How many decimal places should I use in APA 7?
Two decimal places are common for many inferential statistics, while exact p values are commonly reported to two or three decimals. The stronger rule is to retain enough precision for interpretation and remain consistent across comparable values. APA-based statistics guidance
Should p values have a leading zero?
No. Write p = .032 rather than p = 0.032 because probabilities cannot exceed 1.
Is p italicized in APA 7?
Yes. The lowercase Latin letter used as the statistical symbol is italicized. Greek letters such as α, β, and χ are not italicized. APA italics guidance
Is df italicized?
Yes when df is used as the statistical abbreviation for degrees of freedom. In a result such as t(58), however, you normally report the degrees of freedom directly in parentheses rather than writing df = 58.
When should I write p < .001?
Use p < .001 when the calculated value is smaller than .001. Do not report p = .000 when software has rounded a very small probability for display.
Do I always need an effect size?
For substantive quantitative findings, effect magnitude should normally be considered, but the correct measure depends on the analysis. A correlation already provides r. A regression model may use R² and predictor coefficients. A mean comparison may use Cohen’s d or another standardized or raw effect. Check the target journal’s reporting requirements rather than mechanically adding the same statistic to every test.
Should I report the same statistics in the text and a table?
Usually not. The table should carry the exact detail when many values are involved, while the prose should explain the result that matters. Duplicate reporting increases clutter and creates more places for numbers to become inconsistent after revision.
What if my university guide conflicts with an online APA example?
Use the official APA manual as the baseline, then follow legitimate submission instructions from your university, supervisor, or target journal when they add specific requirements. If the local rule directly contradicts the required submission format, clarify that conflict with the destination authority rather than mixing two conventions within the document.
Final APA 7 Statistical Reporting Checklist and Takeaway
| Check | What to verify before submission |
|---|---|
| Analysis | The test matches the research question, design, variables, and assumptions. |
| Values | Every reported number matches the final analysis output. |
| Descriptives | Readers can see the direction and practical scale of the result. |
| Notation | Latin statistical symbols are italicized where appropriate; Greek symbols are not. |
| Spacing | Operators such as =, <, and > have spaces on both sides. |
| Precision | Rounding is consistent and preserves meaningful information. |
| Leading zeros | Bounded statistics omit the zero; statistics that can exceed 1 retain it. |
| p values | Exact values are used when appropriate; values below .001 are written p < .001. |
| Magnitude | An appropriate effect measure and uncertainty estimate are included where relevant. |
| Corrections | Welch, Greenhouse–Geisser, and other corrected statistics are reported as actually computed. |
| Tables and text | The prose highlights findings instead of duplicating an entire table. |
| Interpretation | The wording does not imply causality, certainty, or practical importance that the design cannot support. |
| Venue | Journal, university, or disciplinary instructions have been checked. |
The most reliable way to learn how to report statistics in APA 7 is not to memorize a single statistical string. Identify what the analysis estimates or tests, extract the values that answer the research question, preserve meaningful precision, report magnitude and uncertainty appropriately, apply APA notation, explain the result in plain language, and then check the requirements of the venue where the work will appear.
That workflow applies to students writing assignments, dissertation and thesis authors, and researchers preparing manuscripts. Its limitation is equally important: APA Style can standardize how a result is communicated, but it cannot determine whether the statistical model itself was appropriate. Analysis comes first; formatting comes second.