
How to Report Statistics in APA 7th Edition Format: Rules, Examples, and Best Practices
Master APA-style reporting for t-tests, ANOVA, correlation, and regression with practical examples you can copy into your thesis.
How to Report Statistics in APA 7th Edition: Complete Guide With Examples
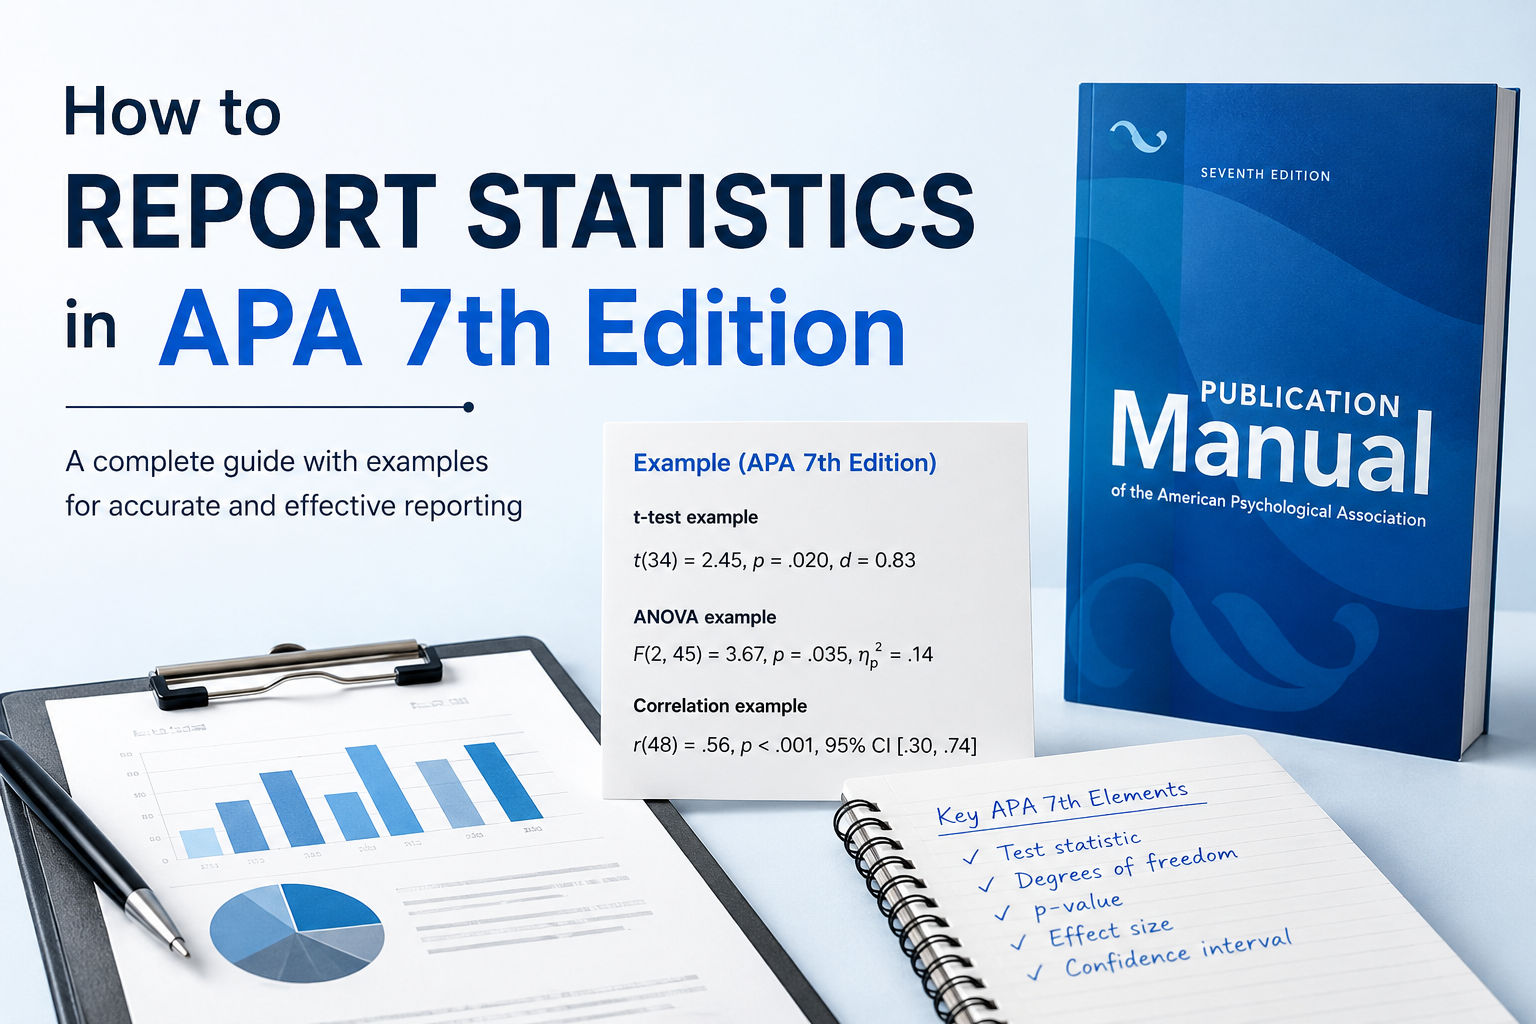
APA 7 statistical reporting is not only about italicizing symbols or placing spaces around an equals sign. A strong Results section tells readers what was analyzed, what effect was observed, how uncertain the estimate is, and how the evidence relates to the research question.
Instead of writing:
Weak report: The experimental group performed significantly better.
Write a complete result:
Better report: Participants in the experimental group scored higher (M = 82.40, SD = 6.30) than participants in the control group (M = 77.10, SD = 7.20), Welch’s t(57.74) = 3.08, p = .003, d = 0.79, 95% CI [1.85, 8.75].
The stronger version communicates the direction and magnitude of the difference, the statistical evidence, and the precision of the estimated effect. This guide explains how to produce that level of reporting for descriptive statistics, t tests, ANOVA, correlation, regression, chi-square tests, nonparametric procedures, effect sizes, confidence intervals, tables, and software output.
Important: APA Style provides general presentation guidance, but a journal, university, reporting guideline, or disciplinary convention may require additional information. Always check the instructions that apply to your manuscript.
In this guide
-
APA 7 rules for statistical symbols, numbers, spacing, leading zeros, and decimal places
-
How to report exact p values and nonsignificant findings
-
Step-by-step structure for an APA 7 Results section
-
Complete examples for t tests, ANOVA, correlation, regression, chi-square, and nonparametric tests
-
How to report effect sizes, confidence intervals, assumptions, corrections, tables, and software output
-
A final checklist and frequently asked questions
Quick APA 7 statistical reporting templates
Use these formats as starting points. The exact information required depends on the analysis, research design, journal, and inferential goal.
| Analysis | Basic reporting format |
|---|---|
| Descriptive statistics | M = value, SD = value |
| One-sample t test | t(df) = value, p = value, d = value, 95% CI [lower, upper] |
| Independent-samples t test | t(df) = value, p = value, d or g = value, 95% CI [lower, upper] |
| Paired-samples t test | t(df) = value, p = value, dz = value, 95% CI [lower, upper] |
| One-way ANOVA | F(df₁, df₂) = value, p = value, η² or ω² = value |
| Factorial ANOVA | F(df₁, df₂) = value, p = value, partial η² = value |
| Pearson correlation | r(df) = value, p = value, 95% CI [lower, upper] |
| Linear regression | B = value, SE = value, β = value, t(df) = value, p = value |
| Chi-square test | χ²(df, N = value) = value, p = value, Cramér’s V or φ = value |
| Mann–Whitney test | U = value, z = value, p = value, effect size = value |
APA 7 rules for reporting numbers and statistics
Use numerals for statistical information
Use numerals for statistical values, measurements, percentages, ratios, scores, scale points, and numbers attached to units.
-
The sample included 86 participants.
-
Participants completed a 7-point scale.
-
Approximately 18% of responses were missing.
-
The intervention lasted 6 weeks.
-
The mean score was 4.32.
In ordinary prose, APA generally uses words for numbers below 10 and numerals for 10 and above, but statistical and measurement contexts are important exceptions.
Italicize Latin statistical symbols
Italicize Latin letters when they function as statistical symbols. Common examples include:
-
M for mean and Mdn for median
-
SD for standard deviation and SE for standard error
-
N for the total sample and n for a subgroup
-
t, F, p, r, z, U, and W
-
B, R², d, and g
Greek letters and symbols, including α, β, χ², η², and ω², are normally presented in standard type rather than italics. A Greek symbol remains nonitalic even when it represents a statistic. Subscripts that function as labels or identifiers are also generally not italicized.
Use spaces around mathematical operators
Place spaces on both sides of operators such as =, <, >, +, and −.
Correct: p = .032
p < .001
t(58) = 2.74
95% CI [1.20, 4.85]
Incorrect: p=.032
t(58)=2.74
Apply leading zeros correctly
Use a leading zero when a value can exceed 1 in absolute magnitude.
Use a leading zero: M = 0.84; SD = 0.73; t = 0.62; d = 0.41
Do not use a leading zero for values that cannot exceed 1 in absolute magnitude.
Do not use a leading zero: p = .028; r = −.34; R² = .21; α = .86
Use consistent and meaningful decimal places
APA does not impose one rigid number of decimal places for every statistic. Use enough precision to preserve meaning without reproducing every digit shown by statistical software. Maintain consistency within a table or group of comparable statistics.
| Statistic | Common practical precision |
|---|---|
| Integer-scale means and standard deviations | 1 decimal place |
| Other means and standard deviations | Usually 2 decimal places |
| Correlations and proportions | Usually 2 decimal places |
| t, F, z, and χ² statistics | Usually 2 decimal places |
| Exact p values | Usually 2 or 3 decimal places |
| Confidence-interval limits | Match the precision of the estimate |
| Regression coefficients | Usually 2 or 3 decimal places |
Retain additional precision when values are very small, measurement units require it, rounding would change interpretation, or the relevant discipline uses a different standard.
How to report p values in APA 7
Report the exact p value when it is .001 or greater. When the calculated value is below .001, report p < .001.
Correct forms: p = .032
p = .140
p = .001
p < .001
Do not copy p = .000 from SPSS or another software package. A displayed value of .000 means that the value is smaller than the software’s displayed precision, not that the probability is literally zero.
Avoid reporting only whether a result crossed a significance threshold. A p value does not measure the size or practical importance of an effect, and it is not the probability that the null hypothesis is true. Interpret it alongside the effect estimate, confidence interval, design, assumptions, data quality, and relevant evidence.
How to report a nonsignificant result
Report nonsignificant findings with the same detail used for statistically significant findings.
Example: The difference between the groups was not statistically significant, t(58) = 1.18, p = .243, d = 0.30, 95% CI [−1.22, 4.71].
Do not write that the null hypothesis was proved or automatically accepted. A nonsignificant result indicates that the analysis did not provide sufficient evidence to reject the specified null hypothesis at the chosen decision threshold. It may also reflect a small effect, imprecise estimation, limited power, measurement error, or substantial variability.
How to write an APA 7 Results section
A well-organized Results section follows the research questions rather than the order in which software produced the output.
-
Organize the section around the research questions or hypotheses. Make clear why each analysis was conducted.
-
Describe the analyzed sample. Report the number of observations and explain relevant exclusions, missing data, or changes in sample size.
-
Present relevant descriptive statistics before inferential results.
-
Name the statistical procedure precisely, especially when multiple versions exist, such as Student’s pooled t test and Welch’s t test.
-
Report the estimate and its uncertainty. Raw differences, regression coefficients, odds ratios, and confidence intervals often communicate more than a test statistic alone.
-
Report the test statistic, degrees of freedom, and exact p value.
-
State the direction of the result in plain language. Say which group was higher or whether the association was positive or negative.
-
Reserve extended explanations, mechanisms, implications, and comparisons with previous research for the Discussion section.
How to report descriptive statistics in APA 7
Descriptive statistics help readers understand the scale, center, and variability of the data. A mean should usually be accompanied by a measure of variability, typically the standard deviation.
Single variable: Participants reported moderate academic stress (M = 3.42, SD = 0.81).
Group comparison: Mean stress was higher among first-year students (M = 3.76, SD = 0.72) than among final-year students (M = 3.11, SD = 0.85).
Skewed data: The median waiting time was 18.5 minutes (IQR = 11.0–26.0).
Select summaries that suit the scale and distribution. Means and standard deviations may be misleading for severely skewed distributions, strong floor or ceiling effects, or data dominated by influential outliers. In those situations, medians, interquartile ranges, ranges, or distribution plots may provide a clearer description.
How to report a t test in APA 7
Independent-samples t test
For an independent comparison, report the groups, group means and standard deviations, the version of the test, the test statistic and degrees of freedom, the exact p value, an effect size, and a confidence interval for the mean difference when available.
Template: [Group 1] had [higher/lower] scores (M = [value], SD = [value]) than [Group 2] (M = [value], SD = [value]), t([df]) = [value], p = [value], d = [value], 95% CI [[lower], [upper]].
Worked example: Students using retrieval practice scored higher (M = 82.40, SD = 6.30) than students using rereading (M = 77.10, SD = 7.20), Welch’s t(57.74) = 3.08, p = .003, d = 0.79, 95% CI [1.85, 8.75].
Welch’s t test can produce fractional degrees of freedom. Report them as calculated, using reasonable rounding. Do not convert them to a whole number simply to make the result resemble a pooled t test.
Paired-samples t test
A paired test evaluates within-person changes or matched-pair differences. The inferential analysis is based on the difference scores.
Template: Scores were [higher/lower] at [time 2] (M = [value], SD = [value]) than at [time 1] (M = [value], SD = [value]), t([df]) = [value], p = [value], dz = [value], 95% CI [[lower], [upper]].
Worked example: Posttest scores (M = 67.20, SD = 7.90) were higher than pretest scores (M = 61.80, SD = 8.40), t(39) = 4.86, p < .001, dz = 0.77, 95% CI [3.15, 7.65].
One-sample t test
Worked example: The sample mean (M = 54.30, SD = 10.20) was higher than the reference value of 50, t(49) = 2.98, p = .004, d = 0.42, 95% CI [1.40, 7.20].
For a detailed discussion of test selection, assumptions, Welch’s procedure, and effect sizes, link internally to the DataClue t-test guide.
How to report ANOVA in APA 7
One-way ANOVA
Report the dependent variable, grouping factor, group descriptive statistics, the F statistic, numerator and denominator degrees of freedom, the exact p value, an appropriate effect size, and planned or post hoc comparisons where relevant.
Template: Scores differed across [groups], F([df₁], [df₂]) = [value], p = [value], η² = [value].
Worked example: Examination scores differed across the three teaching methods, F(2, 87) = 6.45, p = .002, η² = .13.
An omnibus ANOVA indicates that the population means are not all equal under the model. It does not identify which groups differ. Follow a significant omnibus result with planned contrasts or appropriately adjusted post hoc comparisons.
Post hoc example: Tukey-adjusted comparisons indicated that retrieval practice produced higher scores than rereading, mean difference = 6.20, 95% CI [2.10, 10.30], p = .001. The difference between retrieval practice and concept mapping was not statistically significant, p = .184.
Name the comparison or multiplicity-adjustment procedure. Avoid presenting a large collection of unadjusted pairwise tests without explaining how multiple testing was handled.
Factorial ANOVA
Report each relevant main effect and interaction separately. Interpret main effects carefully when an interaction changes their meaning.
Worked example: There was a significant main effect of teaching method, F(1, 116) = 8.74, p = .004, partial η² = .07. The main effect of gender was not statistically significant, F(1, 116) = 0.91, p = .342, partial η² = .01. The teaching-method-by-gender interaction was also not significant, F(1, 116) = 1.26, p = .264, partial η² = .01.
Corrected, repeated-measures, and robust ANOVA results
State any correction or robust procedure used, including Greenhouse–Geisser correction, Huynh–Feldt correction, Welch’s ANOVA, or the Brown–Forsythe test. Report the corrected degrees of freedom supplied by the validated analysis.
Example: Mauchly’s test suggested that the sphericity assumption was not met; therefore, Greenhouse–Geisser-corrected results are reported, F(1.63, 63.42) = 9.18, p < .001, partial η² = .19.
How to report a correlation in APA 7
For Pearson’s correlation, report the variables, direction of association, coefficient, degrees of freedom or sample size, exact p value, and a confidence interval when available.
Template: [Variable 1] was [positively/negatively] correlated with [Variable 2], r([df]) = [value], p = [value], 95% CI [[lower], [upper]].
Worked example: Study time was positively correlated with examination performance, r(82) = .42, p < .001, 95% CI [.23, .58].
The correlation coefficient is itself a standardized effect measure. Avoid causal language unless the design and analysis support a causal conclusion.
Spearman example: Stress and sleep quality were negatively associated, rs = −.38, p = .002.
How to report regression in APA 7
Regression reporting should distinguish between overall model performance and individual predictor estimates.
Overall linear regression model
Report the analysis sample, model R² and adjusted R², the overall F test, degrees of freedom, exact p value, and relevant model or diagnostic information.
Worked example: The multiple regression model was statistically significant, F(3, 116) = 18.72, p < .001, R² = .33, adjusted R² = .31.
Individual regression coefficients
Report the unstandardized coefficient B, standard error SE, confidence interval, standardized coefficient β when useful, test statistic, and exact p value.
Worked example: Study time positively predicted examination performance, B = 0.42, SE = 0.09, β = .38, t(116) = 4.67, p < .001, 95% CI [0.24, 0.60].
Unstandardized coefficients retain the original measurement units and are often the most directly interpretable. Standardized coefficients may help compare predictors measured on different scales, but they should not automatically replace unstandardized estimates.
Logistic regression
For logistic regression, report coefficients or odds ratios, confidence intervals, and the coding of categorical predictors. Always identify the reference category.
Worked example: Attendance positively predicted course completion, B = 0.58, SE = 0.21, Wald χ²(1) = 7.63, p = .006, OR = 1.79, 95% CI [1.19, 2.69].
How to report a chi-square test in APA 7
For a chi-square test of independence, report the categorical variables, χ² statistic, degrees of freedom, sample size, exact p value, an appropriate effect size, and the direction or pattern of association.
Template: There was a [significant/nonsignificant] association between [variable 1] and [variable 2], χ²([df], N = [value]) = [value], p = [value], Cramér’s V = [value].
Worked example: There was an association between study method and examination outcome, χ²(2, N = 180) = 14.32, p < .001, Cramér’s V = .28. Students using retrieval practice were more likely to pass than students using rereading.
Phi is generally appropriate for a 2 × 2 table. Cramér’s V is commonly used for larger contingency tables. Check expected cell frequencies and report an exact procedure, such as Fisher’s exact test, when the standard chi-square approximation is not adequate.
How to report nonparametric tests
The same reporting principles apply to nonparametric analyses: identify the procedure, provide suitable descriptive statistics, report the test statistic and exact p value, and include an interpretable effect-size estimate when appropriate.
Mann–Whitney U: Satisfaction was higher in the intervention group (Mdn = 8.0, IQR = 7.0–9.0) than in the control group (Mdn = 6.0, IQR = 5.0–8.0), U = 322.00, z = −2.41, p = .016, rank-biserial correlation = .31.
Wilcoxon signed-rank: Postintervention stress scores were lower than preintervention scores, W = 96.00, z = −3.08, p = .002, r = .49.
Kruskal–Wallis: Satisfaction differed among the three service locations, H(2) = 9.62, p = .008, ε² = .11.
Follow a significant omnibus nonparametric test with suitable pairwise comparisons and a stated adjustment for multiple testing.
How to report effect sizes and confidence intervals
A p value does not quantify how large or important an effect is. Report an effect estimate and uncertainty whenever they improve interpretation. Prefer estimates that answer the research question directly, such as a raw mean difference, regression coefficient, risk difference, odds ratio, or predicted probability.
| Analysis | Possible effect-size or estimate measures |
|---|---|
| Mean comparison | Raw mean difference, Cohen’s d, Hedges’ g |
| Paired comparison | Mean change, dz, standardized mean change |
| ANOVA | η², partial η², ω², generalized η², planned contrasts |
| Correlation | r or rs |
| Regression | B, β, R², adjusted R², f² |
| Chi-square | φ or Cramér’s V |
| Logistic regression | Odds ratio, predicted probability, marginal effect |
| Nonparametric comparison | Rank-biserial correlation, r, ε² |
The most appropriate measure depends on the design and inferential target. Define the calculation clearly when several standardization methods are possible. For example, multiple versions of Cohen’s d exist for independent and paired designs.
Confidence-interval format
Use square brackets for confidence-interval limits and identify the confidence level when it is not already clear.
Example: Mean difference = 5.30, 95% CI [1.85, 8.75].
Match the interval’s precision to the reported estimate. A confidence interval communicates the range of effect sizes that remain reasonably compatible with the model and data under the procedure used. It should not be interpreted as a guarantee that 95% of future observations will fall inside the interval.
Reporting assumptions, corrections, missing data, and exclusions
Do not turn the Results section into a checklist of automatic assumption tests. Report checks and decisions that materially affected the analysis or interpretation.
-
Independence and study design
-
Distribution and structure of residuals
-
Influential observations and outliers
-
Variance heterogeneity
-
Linearity and functional form
-
Multicollinearity
-
Sphericity
-
Expected cell frequencies
-
Model convergence and fit
-
Missing-data handling
-
Robust procedures or corrections
Example: Because group variances differed substantially, Welch’s t test was used.
Example: Mauchly’s test suggested that the sphericity assumption was not met; therefore, Greenhouse–Geisser-corrected results are reported.
Describe exclusions transparently and distinguish prespecified criteria from decisions made after inspecting the data. Do not remove observations solely because exclusion produces a statistically significant result.
APA 7 tables and figures
Use a table when readers need to compare several values. Use a figure when the primary message is a pattern, trend, interaction, distribution, or model prediction.
A clear APA-style table should contain:
-
A table number
-
A concise, informative title
-
Clear row and column headings
-
Units and abbreviations where needed
-
Notes explaining symbols, model specifications, and significance markers
-
Consistent decimal places within columns
Avoid repeating every table entry in the surrounding paragraph. In the narrative, direct readers to the table, highlight the findings most relevant to the research question, and explain patterns that are not immediately obvious.
When marking statistical significance in a table or figure, use one clearly defined method consistently. Do not combine unexplained asterisks, colors, boldface, and threshold labels.
How to convert SPSS, JASP, Jamovi, R, or Python output into APA format
Statistical software produces technical output, not a finished Results section. Use the following workflow:
1. Confirm that the correct analysis, variables, coding, and model were used.
2. Record the final analysis sample size.
3. Extract the relevant descriptive statistics.
4. Locate the correct test statistic and degrees of freedom.
5. Copy the exact p value from the appropriate row or model.
6. Obtain the effect estimate and confidence interval.
7. Review assumptions, warnings, corrections, convergence information, and sensitivity analyses.
8. Write the result in plain language and state its direction.
9. Compare every reported value against the final validated output.
10. Apply consistent APA formatting and rounding only after verification.
A formatting tool cannot decide whether the model is appropriate. It may generate a fluent sentence even when the wrong groups were compared, a reference category was reversed, repeated observations were treated as independent, or the wrong line of output was selected.
Common APA statistical reporting mistakes
Reporting only p values
Weak: The result was significant, p < .05.
Better: The intervention group reported lower stress than the control group, mean difference = −4.30, 95% CI [−6.75, −1.85], p = .001, d = −0.68.
Writing p = .000
Write p < .001 instead.
Omitting degrees of freedom
Write t(58) = 2.74, not only t = 2.74.
Reporting significance without direction
State which group was higher or whether the relationship was positive or negative.
Treating statistical significance as practical importance
Discuss magnitude, uncertainty, measurement units, and real-world context.
Using the wrong effect size
Select a measure that fits the design and state how it was calculated.
Copying the wrong software row
Ensure the row or model matches the variance assumption, correction, reference group, and analysis plan.
Repeating identical values
Do not reproduce an entire table in the surrounding prose.
Claiming causality from association
Correlation and observational regression do not by themselves demonstrate causation.
Hiding nonsignificant findings
Report planned analyses regardless of whether the p value crossed the significance threshold.
APA 7 statistical reporting checklist
☐ Every analysis addresses a stated research question or hypothesis.
☐ The analysis sample size is clear.
☐ Relevant descriptive statistics are included.
☐ Statistical symbols are formatted consistently.
☐ Test statistics include the correct degrees of freedom.
☐ Exact p values are reported unless p < .001.
☐ No result is written as p = .000.
☐ Leading zeros are used correctly.
☐ Effect estimates and confidence intervals are included where informative.
☐ The direction of each result is stated.
☐ Nonsignificant findings are reported accurately.
☐ Corrections, robust procedures, and sensitivity analyses are identified.
☐ Missing data and exclusions are described when relevant.
☐ Tables and text do not duplicate one another.
☐ Every number has been checked against the final analysis output.
☐ Journal, university, and reporting-guideline requirements have been reviewed.
Frequently asked questions
Should p be italicized in APA 7?
Yes. The Latin statistical symbol p is italicized. The number, equals sign, and comparison sign are not italicized.
Do I put a zero before a p value?
No. Write p = .032, not p = 0.032.
How do I report an SPSS p value of .000?
Report it as p < .001.
How many decimal places should I use?
Inferential statistics are commonly reported to two decimal places, while exact p values are commonly reported to two or three. Use enough precision to represent the result accurately and remain consistent.
Should means and standard deviations always be reported?
They should normally accompany analyses comparing means unless they are already presented clearly in a table. For skewed or ordinal data, medians and interquartile ranges may be more informative.
Should I report effect sizes for nonsignificant results?
Yes, when the estimate is relevant. Effect sizes and confidence intervals help readers evaluate magnitude and precision even when the hypothesis test is nonsignificant.
Are confidence intervals required for every statistic?
Not every statistic requires a confidence interval in every setting, but confidence intervals are highly useful for communicating uncertainty. Follow the applicable journal and reporting standard.
Can Welch’s t test have decimal degrees of freedom?
Yes. Fractional degrees of freedom are expected in Welch’s test and should be reported using appropriate rounding.
Is partial eta squared always the correct ANOVA effect size?
No. Partial η² is common in factorial and repeated-measures designs, but η², ω², generalized η², and model-based contrasts may be more appropriate in other settings.
Can I copy a statistical sentence generated by AI?
Only after checking every value and interpretation against the validated analysis. A fluent sentence can still contain the wrong test, degrees of freedom, reference group, effect-size definition, or conclusion.
Final takeaway
Good APA 7 statistical reporting is not simply a matter of typography. It should allow readers to determine what was analyzed, which observations were included, what effect was estimated, how large the effect was, how uncertain the estimate remains, which procedure was used, and whether the conclusion follows from the design and evidence.
Use APA formatting to improve consistency and readability, but treat statistical accuracy, transparency, and interpretation as the primary standards of quality.
References and authoritative guidance
American Psychological Association. (2020). Publication manual of the American Psychological Association (7th ed.). Source
American Psychological Association. (n.d.). Numbers and statistics guide. Source
American Psychological Association. (n.d.). Journal article reporting standards. Source
American Psychological Association. (n.d.). Sample tables. Source
Appelbaum, M., Cooper, H., Kline, R. B., Mayo-Wilson, E., Nezu, A. M., & Rao, S. M. (2018). Journal article reporting standards for quantitative research in psychology: The APA Publications and Communications Board task force report. American Psychologist, 73(1), 3–25. Source
Lakens, D. (2013). Calculating and reporting effect sizes to facilitate cumulative science: A practical primer for t-tests and ANOVAs. Frontiers in Psychology, 4, 863. Source
Wasserstein, R. L., & Lazar, N. A. (2016). The ASA statement on p-values: Context, process, and purpose. The American Statistician, 70(2), 129–133. Source
Wilkinson, L., & the Task Force on Statistical Inference. (1999). Statistical methods in psychology journals: Guidelines and explanations. American Psychologist, 54(8), 594–604. Source