
Independent T Test: SPSS Guide, Interpretation, and Reporting
The independent t test, also called an independent-samples, unpaired, or two-sample t test, evaluates whether two population means differ. It is commonly used when a researcher wants to compare outcomes such as…
| An independent t test compares the mean scores of two unrelated groups on one continuous outcome. It helps determine whether an observed group difference is likely to reflect a population difference rather than ordinary sampling variation. Use it when each participant belongs to only one group. |
|---|
What Is an Independent T Test? A Simple Explanation
The independent t test, also called an independent-samples, unpaired, or two-sample t test, evaluates whether two population means differ. It is commonly used when a researcher wants to compare outcomes such as cholesterol levels, examination scores, salaries, production weights, or customer ratings across two separate groups.
The word independent is essential. A person or unit in Group 1 must not also appear in Group 2, and the observations should not be naturally paired. When the same participants are measured before and after an intervention, a paired t test is the appropriate method instead.
Why the Independent T Test Matters in 2026
The independent t test remains useful in healthcare, psychology, education, engineering, business analytics, and market research because comparing two group means is still one of the most common analytical tasks. Its value comes from interpretability, transparent assumptions, and compatibility with confidence intervals and effect sizes.
Generative AI systems and AI agents can now prepare SPSS syntax, extract values from output tables, and draft statistical summaries. From what I’ve seen, these tools are often better at explaining a p-value than detecting that the data violate independence or that the wrong test was selected. Human review remains necessary.
Independent T Test Concepts: Means, Variance, T Values, and P Values
The test starts with the difference between two sample means. It then compares that difference with the standard error, which represents how much the difference would be expected to vary across repeated samples. The resulting t value acts like a signal-to-noise ratio.
The degrees of freedom describe how much information is available for estimating uncertainty. SPSS uses the t value and degrees of freedom to calculate a p-value. A p-value does not show the size of the difference, while a confidence interval gives a plausible range for the population mean difference.
Independent T Test Hypotheses
The usual null hypothesis is H0: μ1 = μ2. The two-sided alternative is H1: μ1 ≠ μ2. A two-tailed test is appropriate when a difference in either direction matters and is normally the safest choice unless a directional prediction was specified before examining the data.
A one-tailed test evaluates a specific direction, such as whether a new treatment reduces blood pressure. A common mistake is selecting a one-tailed test only after seeing which group has the higher mean. That makes the analysis partly dependent on the observed result.
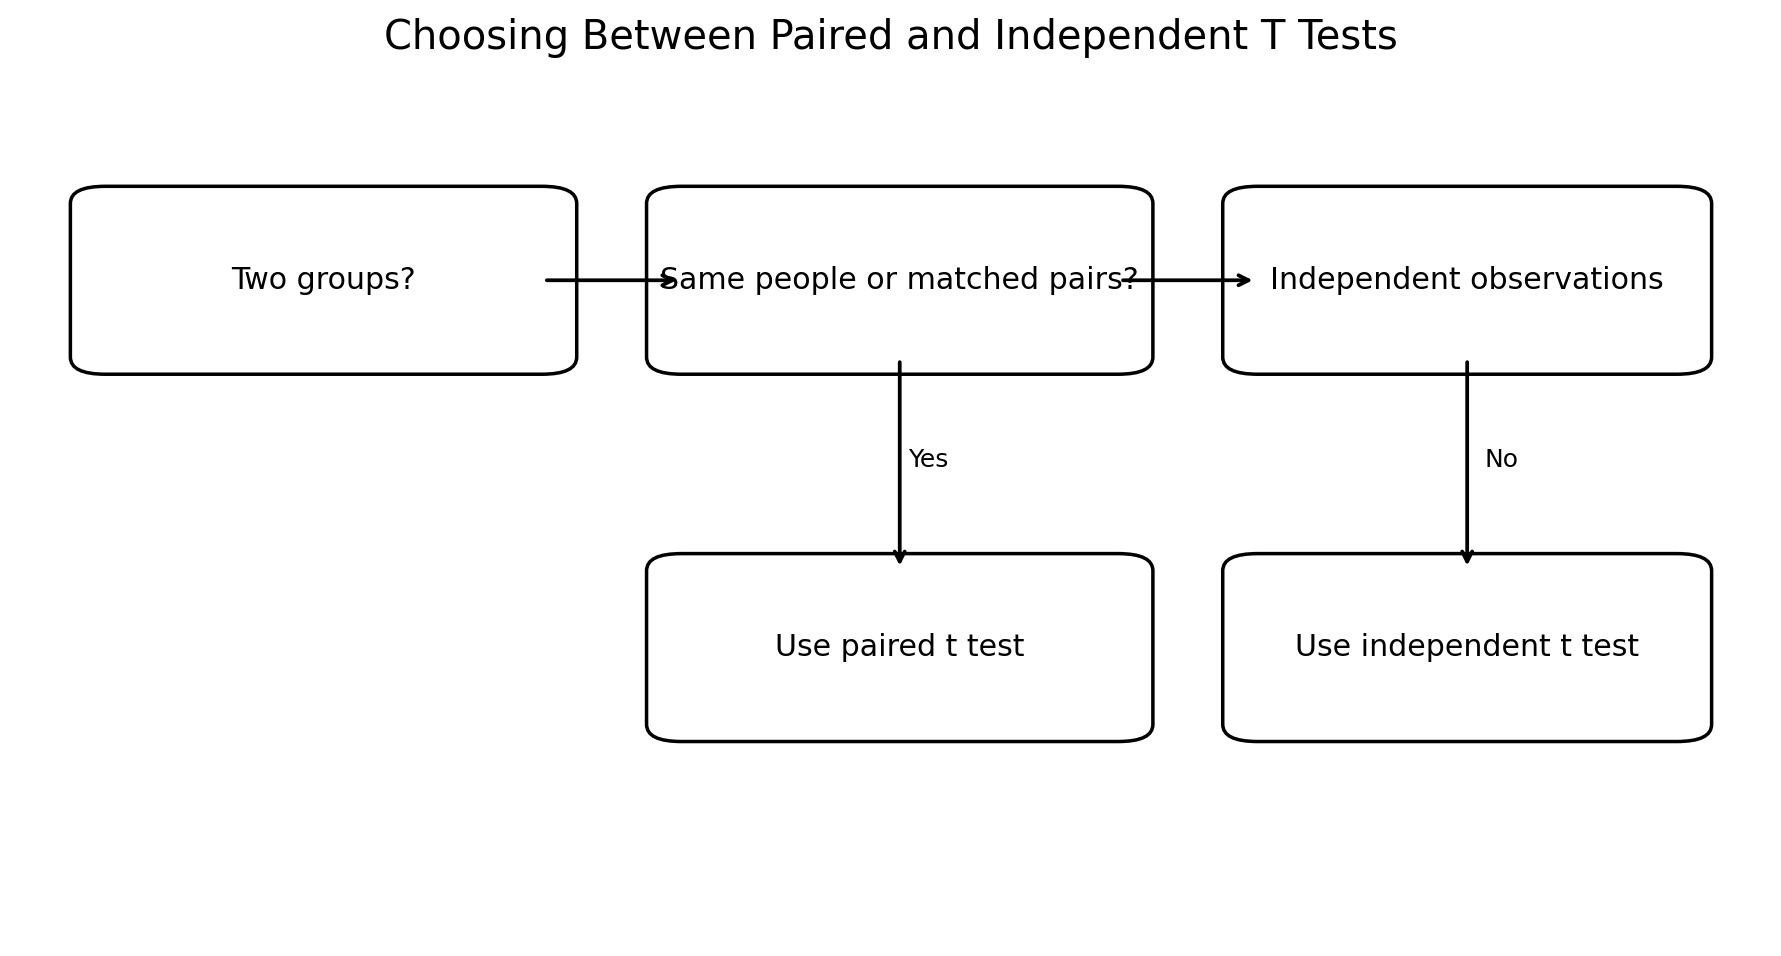
Figure 1. A practical test-selection check for paired versus independent observations.
When Should You Use an Independent T Test?
Use the test when the dependent variable is continuous, the grouping variable has exactly two categories, the observations are independent, and the research question concerns a difference between group means. Examples include comparing exam scores between two teaching methods or product weights from two manufacturing lines.
Do not use it for three or more groups, repeated measurements from the same participants, or outcomes for which a mean is not meaningful. Test selection depends on the structure of the observations, not simply on how many columns appear in the dataset.
Independent T Test Assumptions Explained
The main assumptions are a continuous outcome, two independent groups, independent observations, no influential extreme outliers, approximate normality within each group, and appropriate treatment of group variances. Normality should be assessed separately for each group using visual diagnostics such as histograms, boxplots, and Q-Q plots, supported where useful by the Shapiro-Wilk test.
Theoretical advice often says to abandon the t test whenever a normality test is significant, but in practice sample size, skewness, outliers, and balance matter more than a single diagnostic p-value. With moderate or large groups, the test can tolerate some non-normality. Extreme outliers and strongly skewed small samples are more concerning.
What practitioners often do is inspect graphs first, verify unusual values, compare group sizes and standard deviations, and then decide whether Student’s t test, Welch’s t test, a robust method, or the Mann-Whitney U test is justified.
| Assumption | Practical check | Response if problematic |
|---|---|---|
| Independent groups | Each case appears in only one group | Use a paired or clustered method when observations are linked |
| Continuous outcome | A numeric score where a mean is meaningful | Consider an ordinal or nonparametric model |
| No extreme outliers | Inspect boxplots and raw values | Verify data and use justified robust analysis |
| Approximate normality | Review Q-Q plots and group distributions | Consider Welch, transformation, robust tests, or Mann-Whitney |
| Variance handling | Compare SDs and request Levene’s test | Use Welch’s row when equal variance is doubtful |
How to Run an Independent T Test in SPSS
Arrange the data so that each row represents one participant or unit. Create one column for the continuous outcome and one column for the grouping variable. Numeric group codes such as 1 and 2 are easy to define, but clear value labels should also be added.
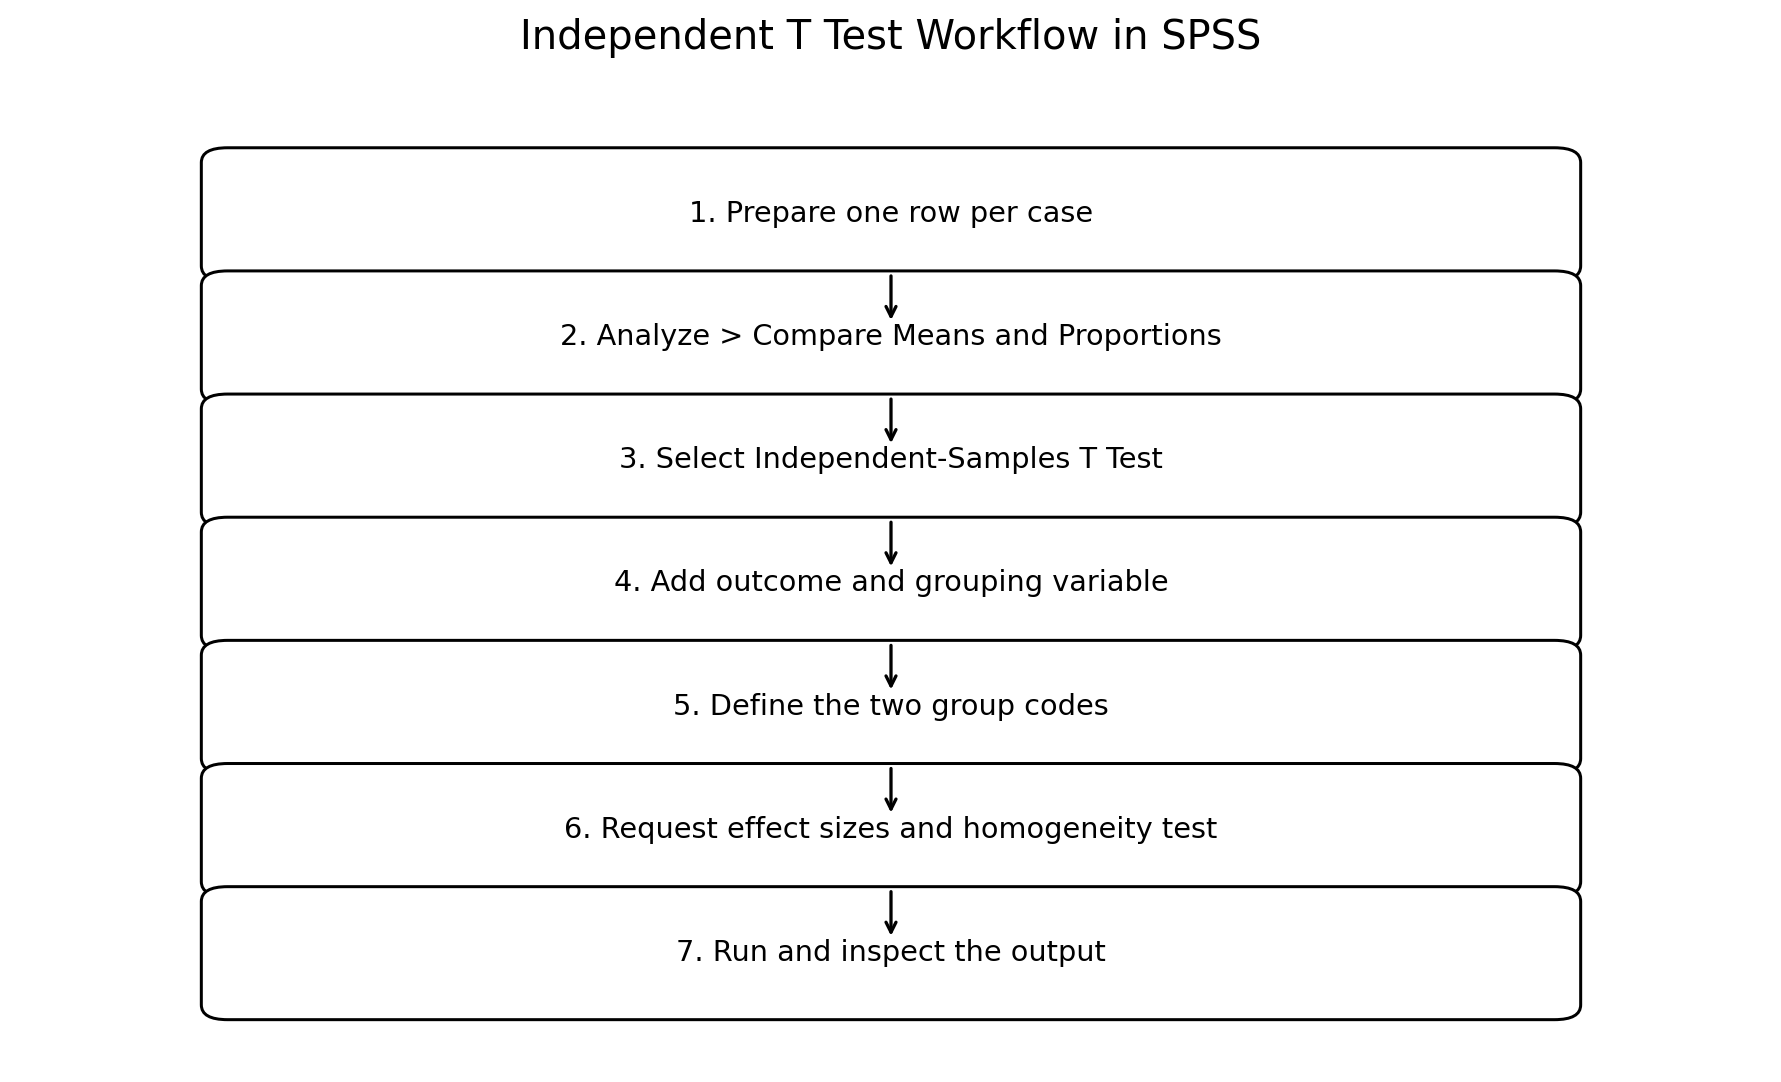
Figure 2. SPSS workflow from data setup to output review.
- Select Analyze > Compare Means and Proportions > Independent-Samples T Test.
- Move the continuous outcome into Test Variable(s).
- Move the categorical variable into Grouping Variable.
- Choose Define Groups and enter the two group codes.
- Request effect sizes and the homogeneity-of-variance test where available.
- Confirm the confidence level, normally 95%, and click OK.
In SPSS Statistics 31, Levene’s homogeneity-of-variance test may need to be requested rather than appearing automatically. In real use, saving the generated syntax is valuable because it records the variables, group codes, confidence level, missing-data rules, and requested output.
Want to calculate or verify the result without entering the data manually in SPSS? Use our Statistics Calculator — dataclue to compare two independent groups and obtain the t value, degrees of freedom, p-value, confidence interval, and effect size.
How to Interpret Independent T Test Results in SPSS
Start with the Group Statistics table. Review the sample size, mean, standard deviation, and standard error for each group. These values reveal the direction and practical scale of the observed difference before significance testing is considered.
Next, inspect the variance information and choose the appropriate row. Read across the selected row: t is the test statistic, df is the degrees of freedom, Two-Sided p is the significance probability, Mean Difference is Group 1 minus Group 2, and the 95% confidence interval estimates the population difference.
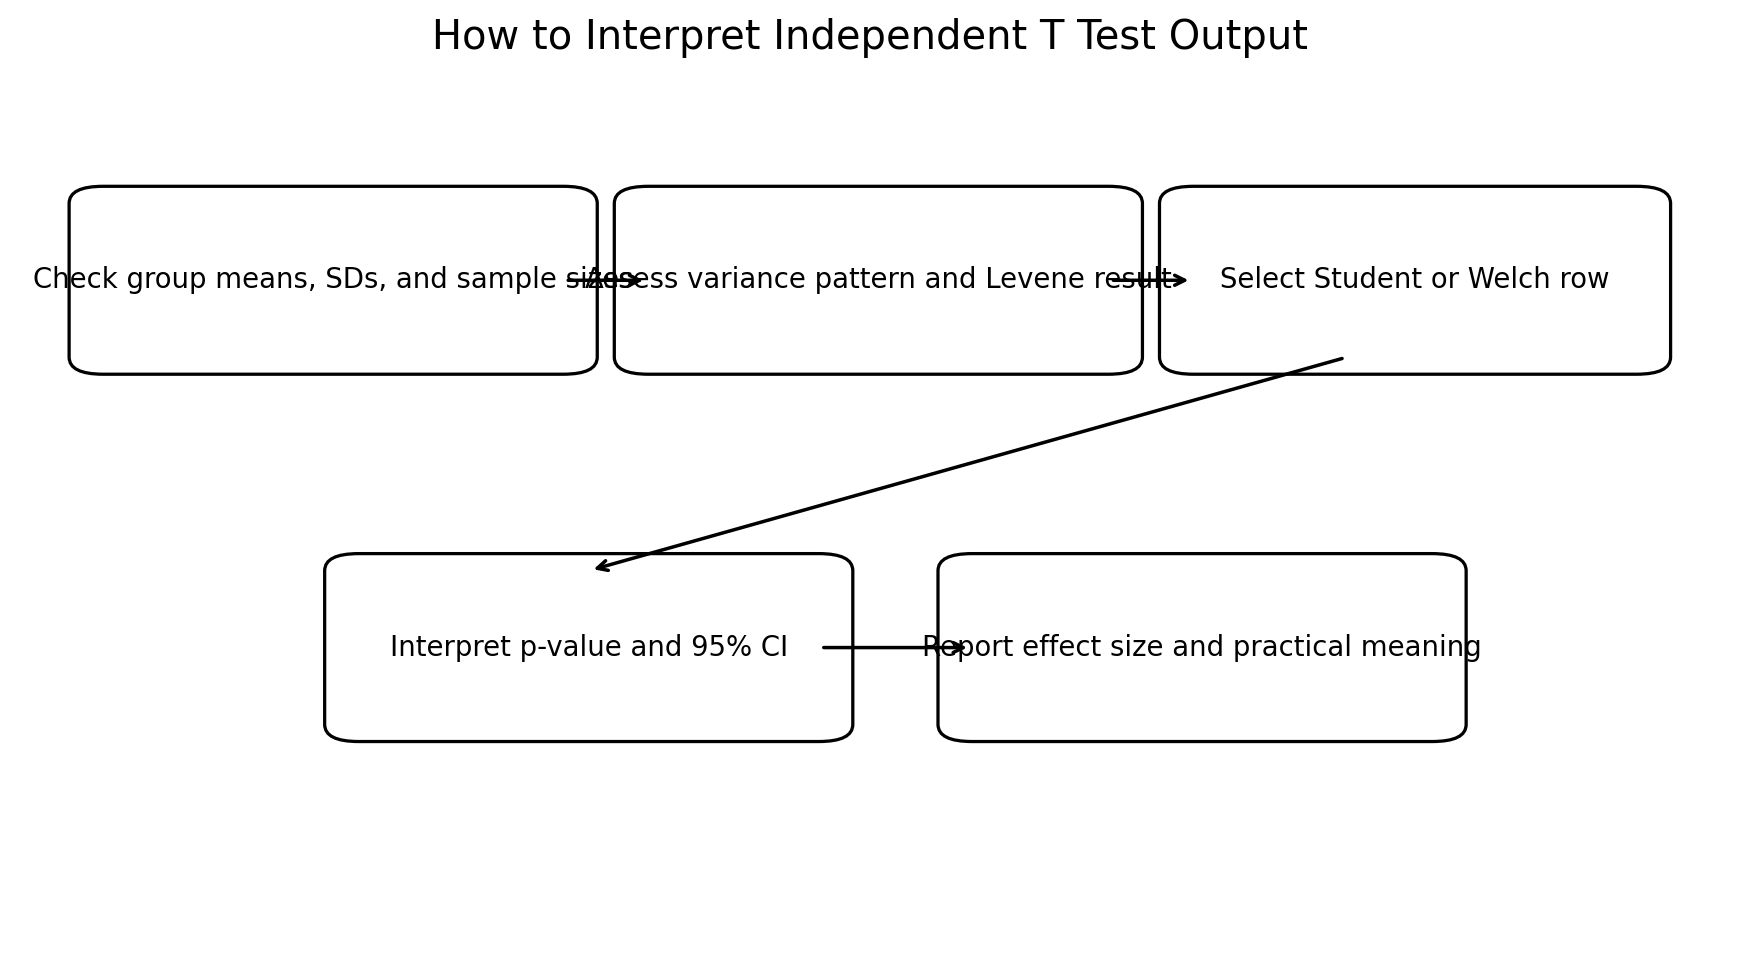
Figure 3. A decision sequence for interpreting SPSS independent t test output.
Student’s T Test vs Welch’s T Test
Student’s t test pools the two group variances and assumes they are equal. Welch’s t test does not require equal variances and adjusts both the standard error and degrees of freedom. Traditional SPSS teaching often treats Levene’s test as a switch between the two rows.
The contrarian but increasingly practical view is that Welch’s test is often a sensible default, especially when sample sizes or standard deviations differ. It performs well when variances are similar and is safer when they are not. Blindly using Levene’s p-value as the only decision rule can be misleading because its sensitivity changes with sample size.
Common Mistakes and Better Alternatives
Common errors include ignoring outliers, treating p > .05 as proof that the groups are equal, reporting only the p-value, and confusing statistical significance with practical importance. A large sample can detect a trivial difference, while a smaller study can estimate a meaningful difference too imprecisely to reach significance.
Use a paired t test for repeated or matched observations, one-way ANOVA for more than two independent groups, and the Mann-Whitney U test for ordinal or severely non-normal outcomes. However, Mann-Whitney should not automatically be described as a test of means because it evaluates ranks and broader distributional differences.
Beyond the P Value: Effect Size and Reporting
A complete interpretation includes group means, standard deviations, the mean difference, confidence interval, and an effect size. Cohen’s d expresses the difference in pooled standard-deviation units. Hedges’ g applies a small-sample correction, while Glass’s delta uses the standard deviation of a designated control group.
An APA-style result can be written as: “An independent-samples t test showed that Group 1 had a higher mean than Group 2, t(df) = value, p = value, mean difference = value, 95% CI [lower, upper], Cohen’s d = value.” The wording should reflect the design and should avoid causal claims unless randomization or another causal design supports them.
Is the Independent T Test Still Worth Using ?
Yes. The independent t test remains a strong method when the design, variables, and assumptions match the analysis. Its future is not replacement by AI but better implementation through reproducible syntax, automated diagnostics, effect-size reporting, and AI-assisted discovery.
AI agents can extract values from SPSS tables and create structured summaries for generative search, but human verification is still needed for group coding, independence, outliers, test selection, causal language, and practical significance. The result that actually works is the one that remains defensible after methodological scrutiny.
Frequently Asked Questions
What is an independent t test?
An independent t test compares the mean of a continuous variable between two unrelated groups. It helps determine whether the observed mean difference is unlikely to be due to random sampling variation.
When should you use an independent t test?
Use an independent t test when you have one continuous dependent variable and one categorical grouping variable with exactly two independent groups. Each participant or observation must belong to only one group.
What is the null hypothesis in an independent t test?
The null hypothesis states that the two population means are equal. In symbolic form, it is usually written as H₀: μ₁ = μ₂.
What assumptions does an independent t test require?
The main assumptions are independent observations, a continuous outcome, two unrelated groups, no influential outliers, approximate normality, and appropriate handling of group variances. In practice, outliers and unequal variances often matter more than minor departures from normality.
How do you run an independent t test in SPSS?
In IBM SPSS Statistics, select Analyze > Compare Means and Proportions > Independent-Samples T Test. Add the continuous variable as the Test Variable, define the two groups, and request effect sizes and Levene’s test where available.
Which SPSS row should you interpret?
Use the Equal variances assumed row when equal variances are defensible. Use the Equal variances not assumed row for Welch’s t test when variances or sample sizes differ.
What does the p-value mean in an independent t test?
The p-value shows how unusual the observed mean difference would be if the population means were actually equal. A p-value above .05 does not prove that the groups are identical.
How do you interpret the confidence interval?
A 95% confidence interval gives a plausible range for the population mean difference. If the interval includes zero, the two-tailed independent t test is usually not statistically significant at the .05 level.
Why should Cohen’s d be reported?
Cohen’s d describes the size of the group difference in standard-deviation units. It adds practical meaning because a statistically significant p-value can still represent a very small effect.
What is the difference between Student’s and Welch’s t test?
Student’s t test assumes equal group variances, while Welch’s t test does not. Welch’s t test is often the safer practical choice when sample sizes or standard deviations are unequal.
When should you use a paired t test instead?
Use a paired t test when the same people are measured twice or when observations are deliberately matched. An independent t test is incorrect when the two sets of scores are linked.
What should you use instead of an independent t test?
Use one-way ANOVA for more than two independent groups and consider the Mann-Whitney U test for ordinal or strongly non-normal outcomes. The correct alternative depends on the research design, not only on whether the data look non-normal.