
Location Parameter in Statistics: Meaning, Formula, Examples, and Estimation
Meaning, formula, examples, estimation methods, and a clear guide to choosing the mean, median, or mode.
Location Parameter in Statistics: Meaning, Formula, Examples, and Estimation
|
Location tells us where A shift moves the full distribution left or right. |
Scale tells us how wide A scale change stretches or compresses the distribution. |
- What Is a Location Parameter?
- Location Parameter Explained with Visual Intuition
- Measures of Location: Mean, Median, and Mode
- How Skew and Outliers Change the Center
- The Location Family of Distributions
- Location Parameter Formula
- Location Parameter vs Scale Parameter
- Location Parameter vs Shape Parameter
- How to Estimate a Location Parameter
- Worked Example: Finding a Typical Delivery Time
- Real World Uses of Location Parameters
- Advantages of Location Parameters
- Limitations and Cautions
- Common Misconceptions
- A Simple Checklist for Choosing a Measure of Location
- Frequently Asked Questions
- Conclusion
Two cities can have the same daily temperature pattern, yet one city is warmer almost every day. The curves may have the same width and the same shape, but one sits farther to the right. That simple movement is what a location parameter describes.
A location parameter tells us where a distribution is placed on a number line. It is one of the basic ideas behind probability models, data summaries, and statistical estimation. You will also see the phrase measures of location. That phrase usually refers to the mean, median, and mode, which describe the center or typical value of observed data.
Quick answerA location parameter is a value that tells you where a probability distribution sits on a number line. Increasing it moves the whole distribution to the right. Decreasing it moves the distribution to the left. The shape and spread stay the same. Mean, median, and mode are also called measures of location because they describe a typical or central value in data.
A useful language noteThe terms location parameter and measure of location are related, but they are not always identical. In a formal probability model, a location parameter shifts the full distribution. In descriptive statistics, a measure of location summarizes the center of a data set. The normal distribution links both ideas because its location parameter μ is also its mean, median, and mode.
What Is a Location Parameter?
In plain English, a location parameter tells you where the main body of a distribution lies. Imagine a bell-shaped curve printed on clear plastic. You can slide the sheet left or right without stretching it. The value that controls that slide is the location parameter.
In a simple location family, we begin with a standard random variable Z and add a constant μ. The new random variable X is written as follows.
μ is the location parameter. A larger μ moves every possible value to the right by the same amount.X = μ + Z
The same idea appears inside a location and scale family. Here, one parameter controls position and another controls spread.
a controls location. b controls scale. Z supplies the basic shape.X = a + bZ, where b > 0
If a changes while b stays fixed, the curve moves but keeps the same spread and shape. This is why a true location change does not make a distribution wider, narrower, more skewed, or more peaked.
Location Parameter Explained with Visual Intuition
The plot below shows three normal curves with the same scale. Their peaks have the same height and their widths are equal. Only the location changes. The curve with location 3 sits three units to the right of the standard curve. The curve with location minus 3 sits three units to the left.
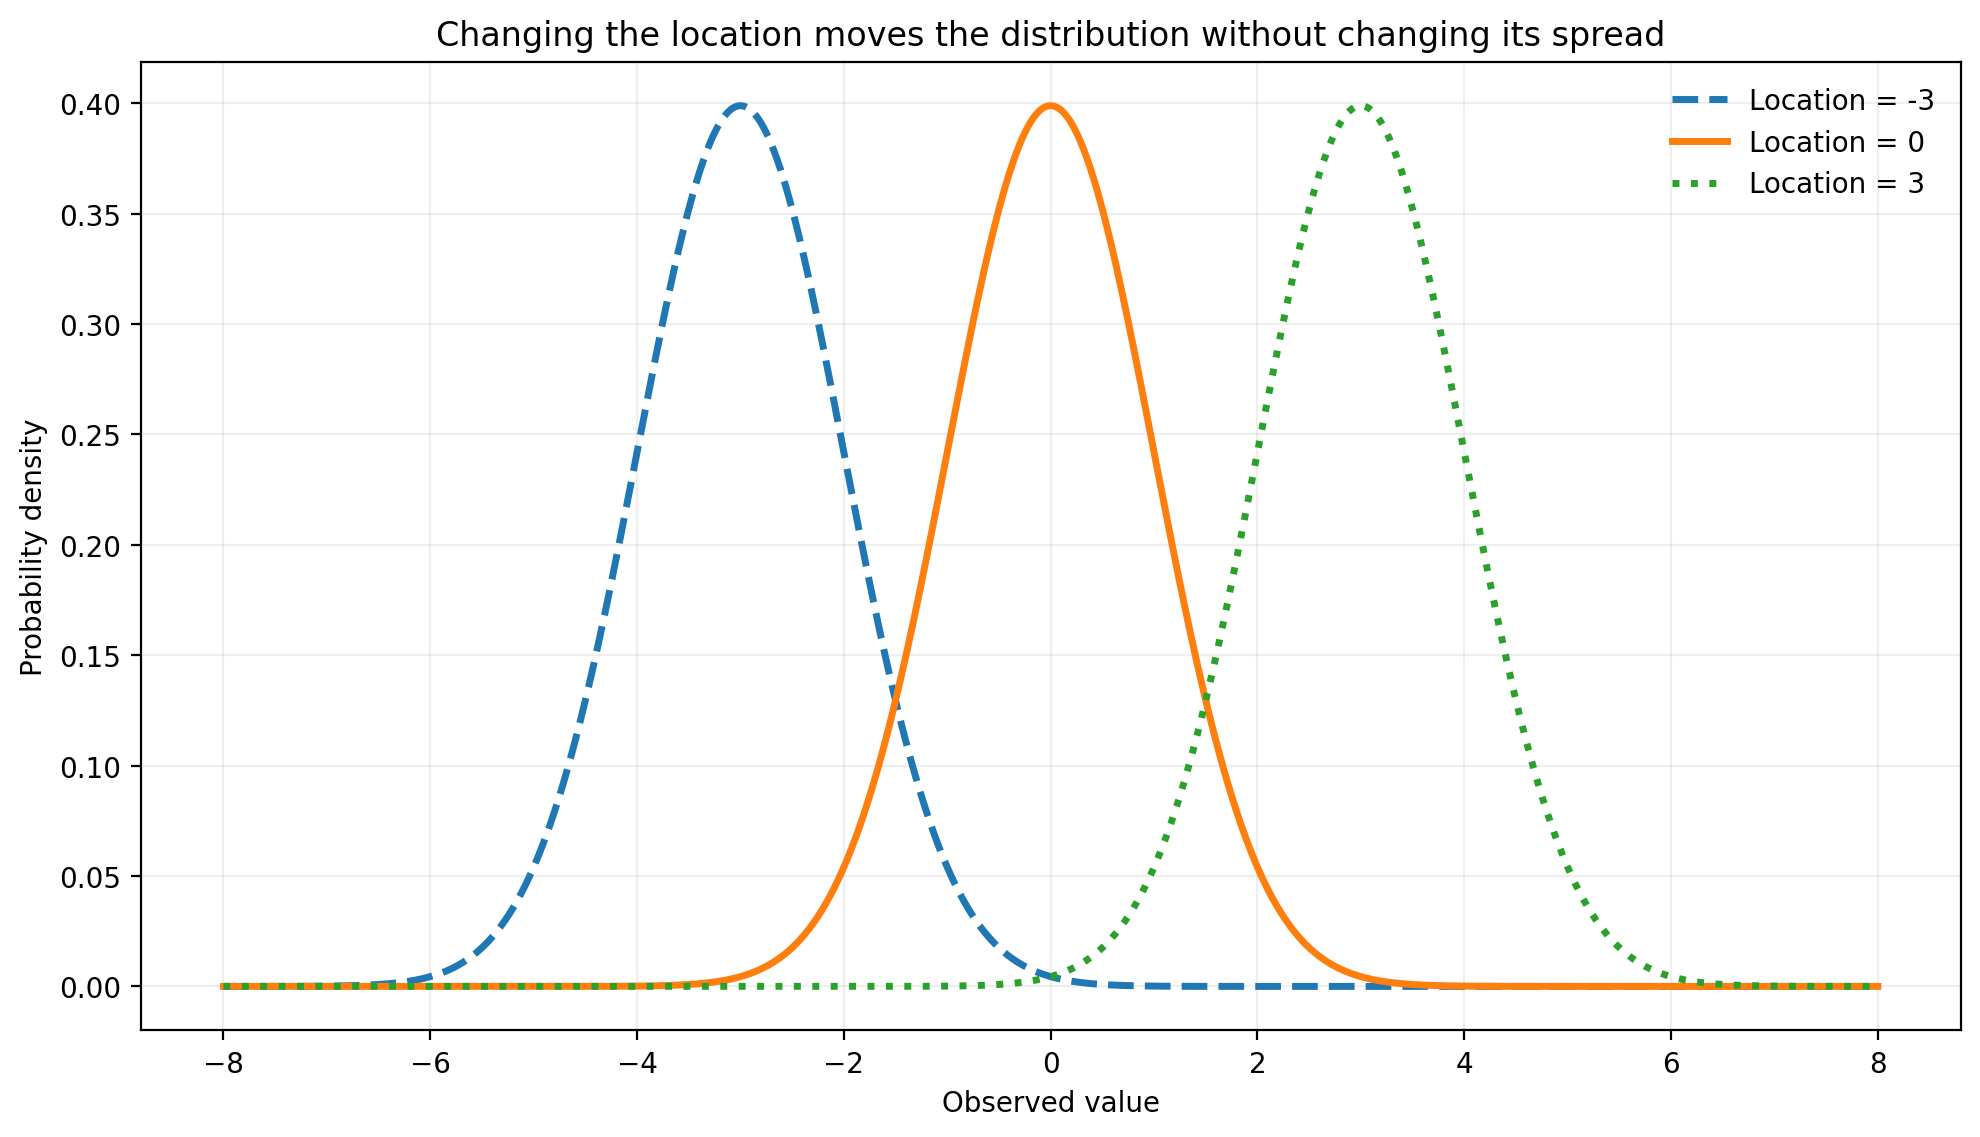
This picture gives you the main rule to remember. Location answers where. Scale answers how wide. Shape answers what form the curve takes.
Measures of Location: Mean, Median, and Mode
When people work with a data set rather than a full probability model, they often use a single number to describe a typical value. The mean, median, and mode are the three most common measures of location. They can point to the same center in a balanced distribution, but they can differ when the data are skewed or contain unusual values.
Mean
The arithmetic mean is the sum of all observations divided by the number of observations. It uses every value, so it carries a large amount of information. It is often the best choice for data that are roughly symmetric and do not contain strong outliers.
x̄ is the sample mean, and n is the number of observations.x̄ = (x₁ + x₂ + ... + xₙ) ÷ n
Suppose five students record 8, 10, 12, 14, and 16 hours of study. The total is 60 hours. Dividing 60 by 5 gives a mean of 12 hours.
Median
The median is the middle value after the observations are placed in order. Half of the values are at or below it, and half are at or above it. When the sample size is even, the median is the mean of the two middle values.
The median depends on order rather than the full size of every observation. That makes it more resistant to extreme values. It is often a good choice for income, house prices, waiting times, and other right-skewed data.
Mode
The mode is the value or category that appears most often. A data set can have one mode, more than one mode, or no repeated value at all. The mode is especially useful for names, categories, clothing sizes, product choices, and other data where calculating a mean would not make sense.
| Measure What | What it describes | Best use | Main caution |
|---|---|---|---|
| Mean | The arithmetic balance point | Symmetric numeric data without strong outliers | A few extreme values can move it |
| Median | The middle ordered value | Skewed data or data with outliers | It does not use the exact distance of every value |
| Mode | The most frequent value or category | Categorical or repeated data | It may not be unique or stable |
How Skew and Outliers Change the Center
A symmetric distribution has a similar pattern on both sides of its center. In that setting, the mean, median, and mode are often close. In a right-skewed distribution, a long right tail pulls the mean upward. The median usually moves less because it depends on rank.
Consider delivery times of 24, 26, 27, 27, 28, 29, 30, 31, 32, and 65 minutes. Most deliveries finish between 24 and 32 minutes. One delivery takes 65 minutes. The mean is 31.9 minutes, while the median is 28.5 minutes. The high value pulls the mean away from the main group.
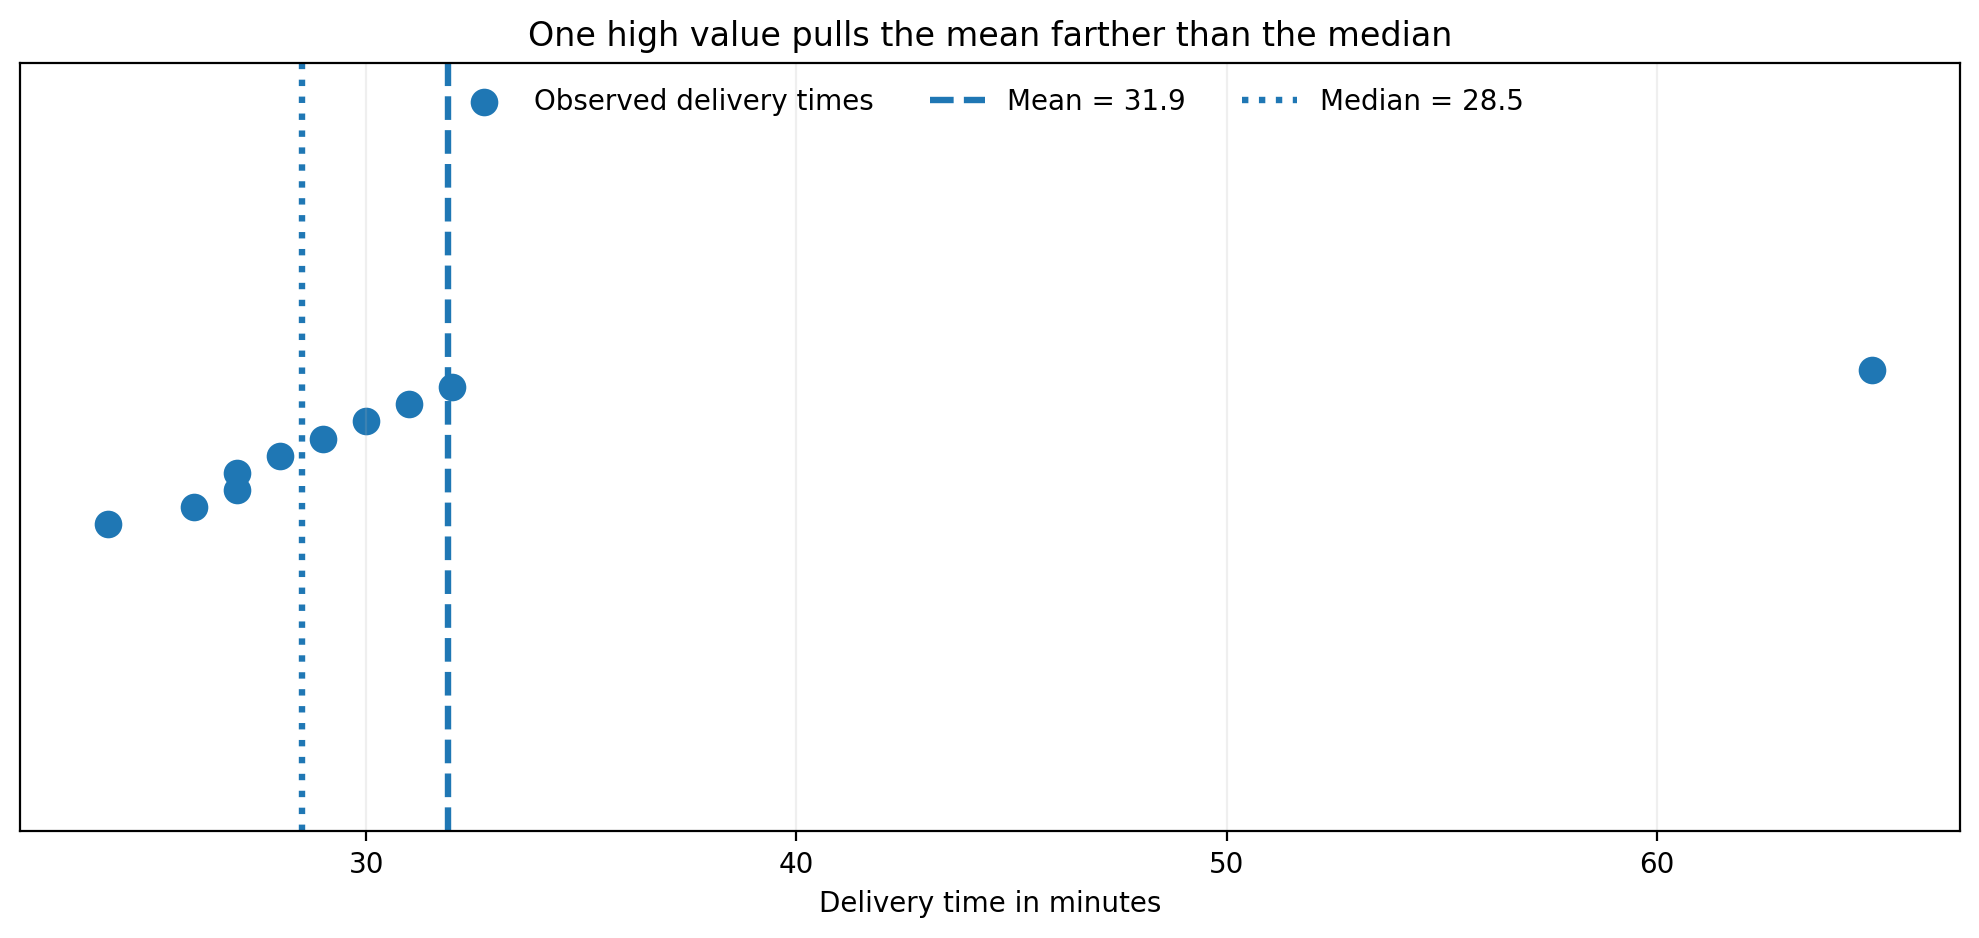
Use the mean when the distribution is reasonably balanced, and the values are meaningful on a numeric scale. Consider the median or a robust estimator when the data are strongly skewed or contain influential outliers.
The Location Family of Distributions
A location family is a group of distributions that share one basic shape. Each member is created by shifting that shape to a different place. If the standard density is f₀, a location family can be written as follows.
Changing μ moves the density left or right. It does not change the relative shape.f(x; μ) = f₀(x − μ)
When scale is also included, the continuous density takes a more general form.
a is location and b is a positive scale parameter. The factor 1 ÷ b keeps the total area under the density equal to one.f(x; a, b) = (1 ÷ b) f₀((x − a) ÷ b)
This structure matters because many calculations can be done first for a standard distribution. The result can then be shifted and rescaled for other parameter values.
Table 2. Common formulas used to describe or estimate location.
|
Purpose |
Formula |
How to use it |
|
General transformation |
X = a + bZ |
Create a location-and-scale version of a standard random variable Z. |
|
Sample mean estimator |
x̄ = Σxᵢ ÷ n |
For a normal model, the sample mean is the maximum likelihood estimate of μ. |
|
Sample median estimator |
Median = middle ordered value |
For an odd sample, select the center value. For an even sample, average the two center values. |
General transformation formula
Use this to create a location and scale version of a standard random variable Z.X = a + bZ
Sample mean as an estimator
For a normal model with unknown μ and known or unknown variance, the sample mean is the maximum likelihood estimate of μ.x̄ = Σxᵢ ÷ n
Sample median as a robust estimator
The sample mean and sample median estimate different mathematical targets in some distributions. Before choosing either one, define what location means in your model. It might mean an expected value, a median, a center of symmetry, a threshold, or a formal shift parameter.
Location Parameter vs Scale Parameter
Location and scale are easy to confuse because both change how a distribution appears. The difference is simple. Location moves the curve. Scale stretches or compresses it.
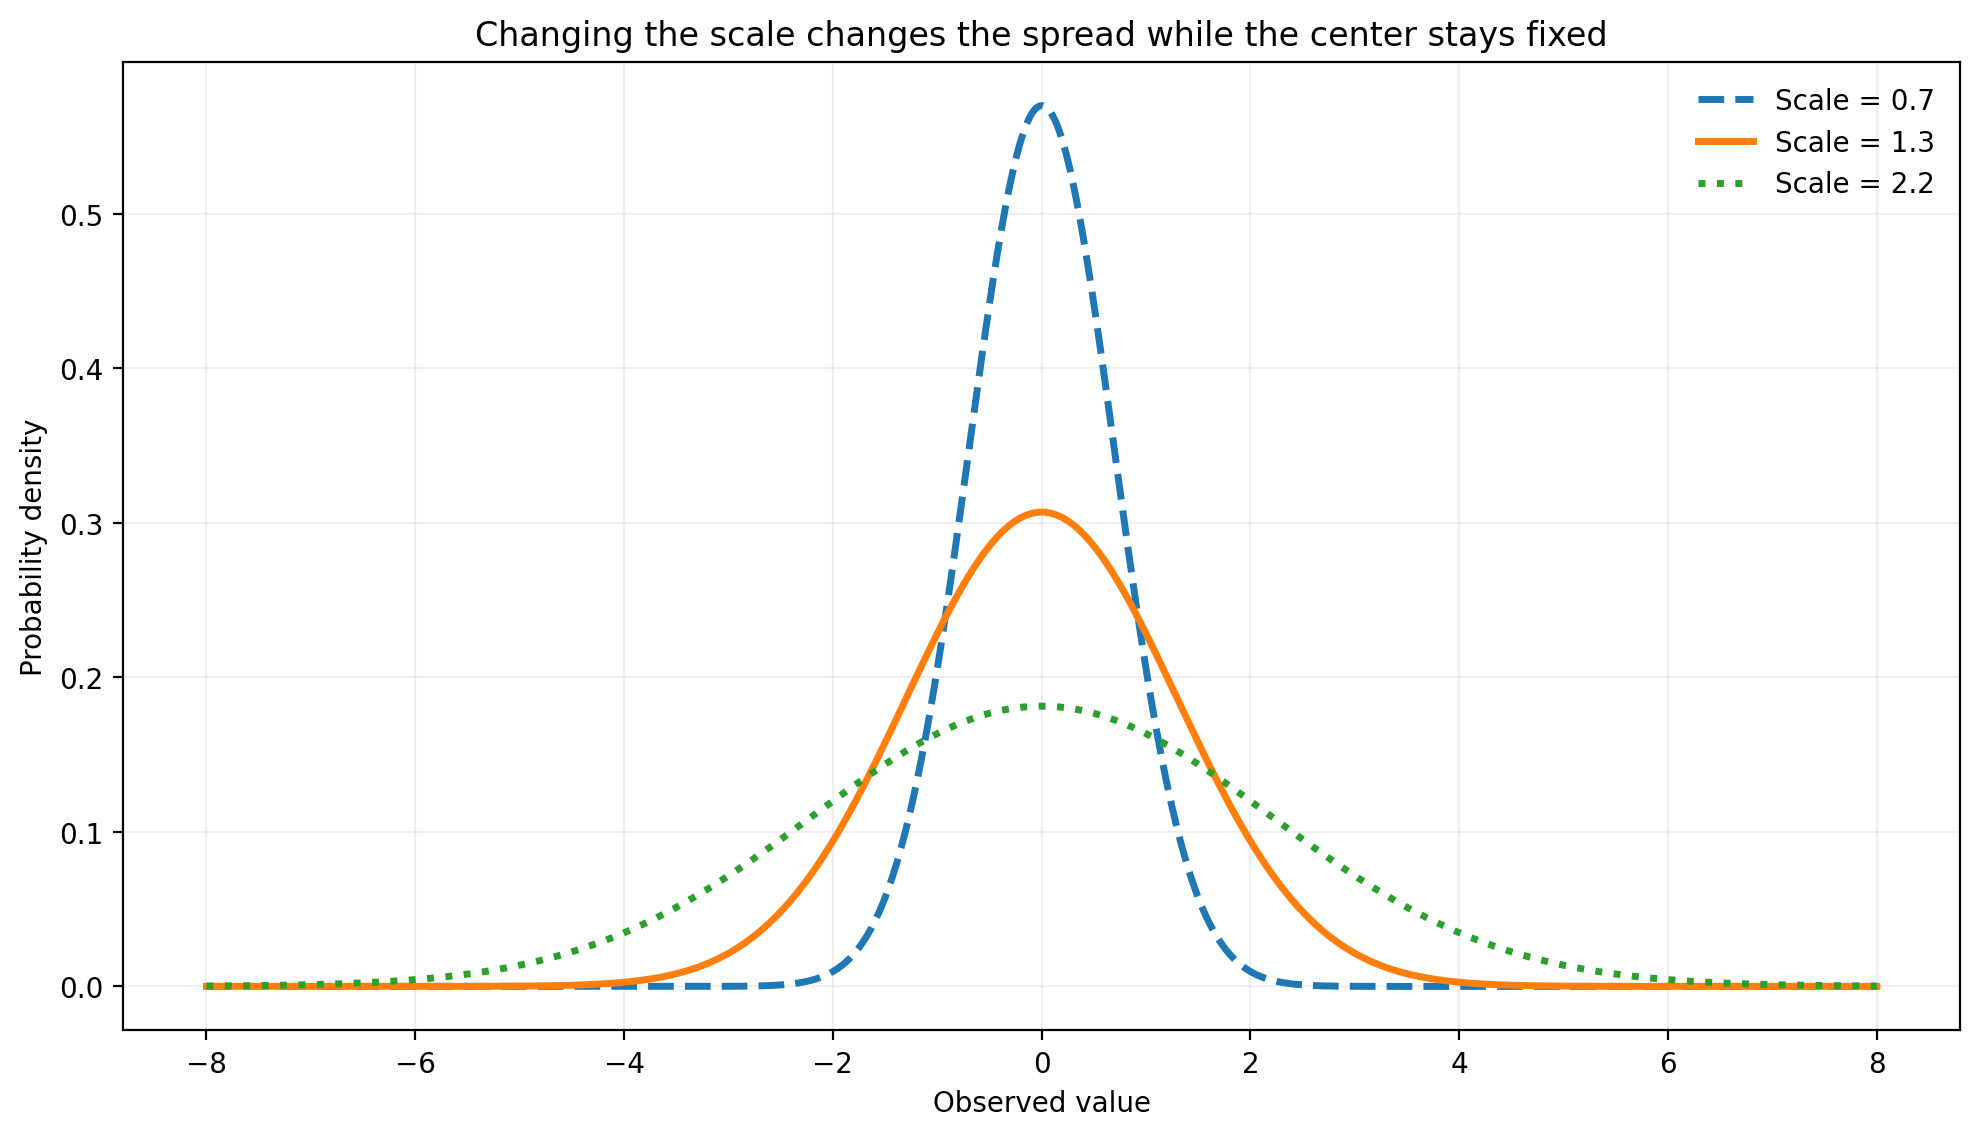
| Feature | Location parameter | Scale parameter |
|---|---|---|
| Main question | Where is the distribution? | How spread out is the distribution? |
| Visual effect | Moves the curve left or right | Makes the curve wider or narrower |
| Normal distribution example | μ | σ |
| Typical data summary | Mean or median | Standard deviation or interquartile range |
| Allowed values | Often any real number | Usually greater than zero |
| Effect on shape | No change to relative shape | No change to standardized shape |
Location Parameter vs Shape Parameter
A shape parameter changes the form of a distribution in a way that cannot be explained by a simple shift or stretch. It may change skewness, tail weight, peak sharpness, or the number of peaks.
For example, changing the shape parameter of a gamma distribution can move probability toward one side and alter skewness. A pure location change cannot do that. It only changes the reference point on the horizontal axis.
| Parameter type | Controls | Visual result | Examples |
|---|---|---|---|
| Location | Position | The full curve slides left or right | μ in a normal distribution |
| Scale | Spread | The curve widens or narrows | σ in a normal distribution |
| Shape | Form | Skewness, tails, or peak structure changes | Shape in gamma or Weibull models |
How to Estimate a Location Parameter
Estimation uses a sample to learn about an unknown population value. A good estimator should match the model and the purpose of the study. It should also behave well when the sample is small, skewed, or affected by outliers.
1. Sample mean
The sample mean is efficient under a normal model. It uses every observation and has familiar confidence interval methods. It is sensitive to extreme values, so always inspect the data before relying on it.
2. Sample median
The sample median is resistant to large or small outliers. It is useful for skewed data and for models where the median is the natural location target. It can be less precise than the mean when the data are truly normal and clean.
3. Trimmed mean
A trimmed mean removes a chosen share of the smallest and largest observations, then calculates the mean of the remaining data. It offers a practical balance between the efficiency of the mean and the resistance of the median. The trim level should be selected for a clear reason, not after looking for a preferred result.
4. Maximum likelihood estimation
Maximum likelihood chooses the parameter value that makes the observed sample most compatible with the assumed probability model. For a normal distribution, the maximum likelihood estimate of μ is the sample mean. For a Laplace distribution with known scale, the likelihood is maximized by the sample median. The answer changes with the model.
5. Method of moments
The method of moments matches sample summaries with their theoretical population versions. If the population mean exists and equals a known function of the location parameter, the sample mean can be used to solve for that parameter. This method is often simple, but it may be less efficient than maximum likelihood.
6. Robust location estimators
Robust methods reduce the influence of extreme observations. Examples include the median, trimmed mean, Winsorized mean, and Hodges-Lehmann estimator. These methods are useful when normal assumptions are doubtful or when a small amount of contamination may be present.
Table 4. Location, scale, and shape control different features of a distribution.
|
Parameter type |
Controls |
Visual result |
Examples |
|
Location |
Position |
The full curve slides left or right |
μ in a normal distribution |
|
Scale |
Spread |
The curve widens or narrows |
σ in a normal distribution |
|
Shape |
Form |
Skewness, tails, or peak structure changes |
Shape in gamma or Weibull models |
Worked Example: Finding a Typical Delivery Time
A small delivery team records ten times in minutes: 24, 26, 27, 27, 28, 29, 30, 31, 32, and 65. We want a useful estimate of the typical delivery time.
|
1 |
Order and inspect the values. The values are already ordered. Nine observations lie from 24 to 32 minutes, while one value is 65 minutes. |
|
2 |
Calculate the mean. The total is 319. Dividing by 10 gives a mean of 31.9 minutes. |
|
3 |
Calculate the median. The fifth and sixth values are 28 and 29. Their average is 28.5 minutes. |
|
4 |
Find the mode. The value 27 appears twice, more often than any other value, so the mode is 27 minutes. |
|
5 |
Compare the answers. The mean is several minutes above the main group because the 65 minute delivery has a strong effect. The median and mode sit closer to the cluster. |
|
6 |
Choose and report the estimate. For a short description of a typical delivery in this sample, the median of 28.5 minutes is more representative. The report should also mention the unusual 65 minute case rather than hiding it. |
The median delivery time was 28.5 minutes. Most deliveries took 24 to 32 minutes, but one delivery took 65 minutes. Because this high value pulled the mean upward to 31.9 minutes, the median gave a clearer summary of the usual delivery time.
Real World Uses of Location Parameters
Healthcare
Researchers estimate typical blood pressure, recovery time, biomarker level, or treatment response. The median may be more useful for hospital stay because a few long stays can create strong right skew.
Finance and economics
Analysts study returns, wages, prices, and household income. Median income is often easier to interpret as a typical household value because a small number of very high incomes can raise the mean.
Manufacturing and quality control
A process location tells engineers whether measurements are centered on a target. A shift in the mean diameter of a part may signal tool wear even when process spread has not changed.
Machine learning and data science
Centering is a common preparation step. Analysts may subtract a mean or median from each value before fitting a model. Robust centers can reduce the influence of extreme records. In high-dimensional work, location can also be represented by a vector rather than a single number.
Weather and environmental science
Location measures describe typical temperature, rainfall, pollution, or river flow. The right measure depends on the distribution. Median rainfall can be more informative when many days are dry, and a few storms are very large.
Business and customer analytics
Companies track typical order value, service time, customer age, and delivery delay. Comparing locations across groups can reveal meaningful differences, but the report should also include spread and sample size.
Advantages of Location Parameters
- They reduce a large set of values to a clear summary.
- They support comparisons between groups, periods, and populations.
- They help define probability models and simulation settings.
- They provide targets for estimation, confidence intervals, and hypothesis tests.
- They can be chosen to match symmetric, skewed, categorical, or heavy-tailed data. heavy-tailed
Limitations and Cautions
- One number cannot describe both center and spread. Always pair a location measure with a measure of dispersion.
- The mean can be misleading when a few values are extreme.
- The median can hide important differences in the tails or in the exact size of observations.
- The mode may change when categories or histogram bins change.
- A formal location parameter depends on the model. It is not automatically the same as the mean.
- Small samples can produce unstable estimates, so uncertainty should be reported when possible.
- Missing data, selection bias, and measurement error can move any estimator away from the population value.
Common Misconceptions
| Myth | Fact |
|---|---|
| The mean is always the location parameter. | The mean is a common measure of location, but some models use a median, threshold, or shift value. The Cauchy distribution has a location parameter even though its population mean is not defined. |
| Mean, median, and mode always match. | They match in some symmetric one-peak distributions, including the normal distribution, but they often differ in skewed data. |
| Changing location changes spread. | A pure location change moves the distribution without changing its spread. |
| The median is always better because it is robust. | The median is resistant to outliers, but the mean can be more precise for clean normal data. |
| A significant difference in means explains the full data story. | A good comparison also considers effect size, spread, sample size, uncertainty, and distribution shape. |
| A center value describes every observation. | A location measure is a summary. Individual values may be far from it. |
A Simple Checklist for Choosing a Measure of Location
-
1
Confirm the data type. Use mean or median for numeric data. Use mode for categories or repeated choices.
2
Draw a plot. A histogram, dot plot, or box plot can reveal skew, clusters, gaps, and outliers.
3
Define the scientific target. Decide whether you need an expected value, middle value, most common value, center of symmetry, or model shift.
4
Check model assumptions. A normal model supports the mean, but heavy tails or skew may call for a robust method.
5
Compare more than one summary. When mean and median differ, explain why rather than choosing silently.
6
Report spread and uncertainty. Add standard deviation, interquartile range, confidence interval, or another suitable measure.
Frequently Asked Questions7
Use clear language. State exactly what was calculated and why it represents the question of interest.
A location parameter tells you where a probability distribution sits on a number line. When the value increases, the distribution shifts to the right. When it decreases, the distribution shifts to the left. A pure location change does not alter the spread or relative shape of the distribution.
Is the mean a location parameter?The mean can be a location parameter, but not in every model. In the normal distribution, μ is both the formal location parameter and the population mean. In other distributions, a location parameter may equal the median, a threshold, or another center. Some location families do not have a defined population mean.
What are the three main measures of location?The three main measures of location are the mean, median, and mode. The mean is the arithmetic average. The median is the middle ordered value. The mode is the most frequent value or category. Each measure describes a different idea of what is typical.
What is the location parameter formula?A common transformation is X = μ + Z, where Z has a standard distribution and μ shifts it. For a location and scale family, X = a + bZ with b greater than zero. The exact estimation formula depends on the chosen probability model and the target parameter.
What is the difference between location and scale parameters?A location parameter moves a distribution left or right. A scale parameter changes how wide or narrow the distribution is. In a normal distribution, μ controls location and σ controls scale. Changing μ does not change σ, and changing σ does not move the center.
What is the difference between a location parameter and central tendency?Central tendency is a broad descriptive idea about the center of observed data. Mean, median, and mode are measures of central tendency. A formal location parameter belongs to a probability model and shifts the entire distribution. The ideas overlap, but they are not always exactly the same.
When should I use the median instead of the mean?Use the median when the data are strongly skewed, contain influential outliers, or have a natural middle value that matters more than the arithmetic balance point. Common examples include income, property prices, waiting times, and hospital stay. Show the distribution before making the choice.
Can a distribution have a location parameter but no mean?Yes. The Cauchy distribution has a location parameter that marks its center and median, but its population mean is not defined. This example shows why a location parameter should not be treated as a synonym for mean in every probability model.
How do outliers affect location measures?Outliers can move the mean because every value contributes its full size to the calculation. The median usually changes less because it depends mainly on order. The mode may stay the same if the most frequent value is unchanged. A plot helps show whether the outlier is an error or a real event.
How is a location parameter estimated?Common methods include the sample mean, sample median, trimmed mean, method of moments, and maximum likelihood. The best method depends on the distribution and the goal. For normal data, the sample mean estimates μ. For skewed or heavy-tailed data, a robust estimator may be safer.
Does changing location change skewness or kurtosis?No. A pure location shift adds the same constant to every possible value. This changes the numerical center, but it does not change standardized shape features such as skewness or kurtosis. A shape parameter is needed to change those properties.
Should a report include only the location estimate?No. A complete report should also describe spread, sample size, and uncertainty. Depending on the setting, report the standard deviation, interquartile range, confidence interval, or a visual plot. A center without spread can hide important variation.
Conclusion
A location parameter tells you where a distribution is placed. In a formal location family, changing the parameter shifts the full curve left or right while the spread and shape remain fixed. In descriptive statistics, the mean, median, and mode are measures of location that summarize a typical or central value.
The most important step is not memorizing one formula. It is defining what center means for your data and model. Use the mean for balanced numeric data when outliers are not a major concern. Use the median when skew or extreme values make the mean less representative. Use the mode for the most common category or repeated value. Then report spread and uncertainty so readers can see the full picture.
Sources and Further Reading
- Numiqo, Measures of Location. A practical introduction to mean, median, and mode.
- NIST, Measures of Location. Definitions, examples, robustness, and alternative location estimators.
- NIST, Location and Scale Parameters. Formal effects and formulas for location and scale transformations.
- NIST, Estimating the Parameters of a Distribution. Overview of parameter estimation methods.
- NIST, Maximum Likelihood. A concise explanation of maximum likelihood estimation.
- Statistics LibreTexts, Location and Scale Families. Formal transformation rules and examples of distribution families.