
Logistic Regression Calculator & Guide
Calculate a predicted probability from logistic regression coefficients, then learn how to interpret odds ratios, diagnose model problems, evaluate performance, and choose the right implementation.
Logistic Regression Calculator & Guide
Logistic Regression Calculator: Calculate Probability From Model Coefficients
If you already have an intercept and regression coefficients, the calculation has two stages. First compute the linear predictor, often written as z. Then transform z with the logistic, or sigmoid, function.
The result is the model-estimated probability of the outcome coded as 1. Before interpreting it, confirm what Y=1 means in the original model. Reversing the event coding reverses the meaning of the prediction.
Worked Logistic Regression Prediction Example
Suppose the fitted model is z = −2.5 + 0.8X₁ − 0.4X₂, and a new observation has X₁ = 3 and X₂ = 1.5. The linear predictor is:
Applying the logistic function gives P(Y=1) ≈ 0.3318. The model therefore assigns this observation a predicted probability of about 33.2% for the event coded as 1.
Calculate the Same Result in Python
import math

def logistic_probability(intercept, coefficients, values):
    z = intercept + sum(beta * x for beta, x in zip(coefficients, values))
    probability = 1 / (1 + math.exp(-z))
    odds = math.exp(z)
    return z, odds, probability

z, odds, probability = logistic_probability(
    -2.5, [0.8, -0.4], [3.0, 1.5]
)
print(z, odds, probability)
This is a prediction calculation, not a model fit. It does not tell you whether the supplied coefficients are stable, statistically precise, well calibrated, or valid for a new population.
What Is Logistic Regression in Simple Terms?
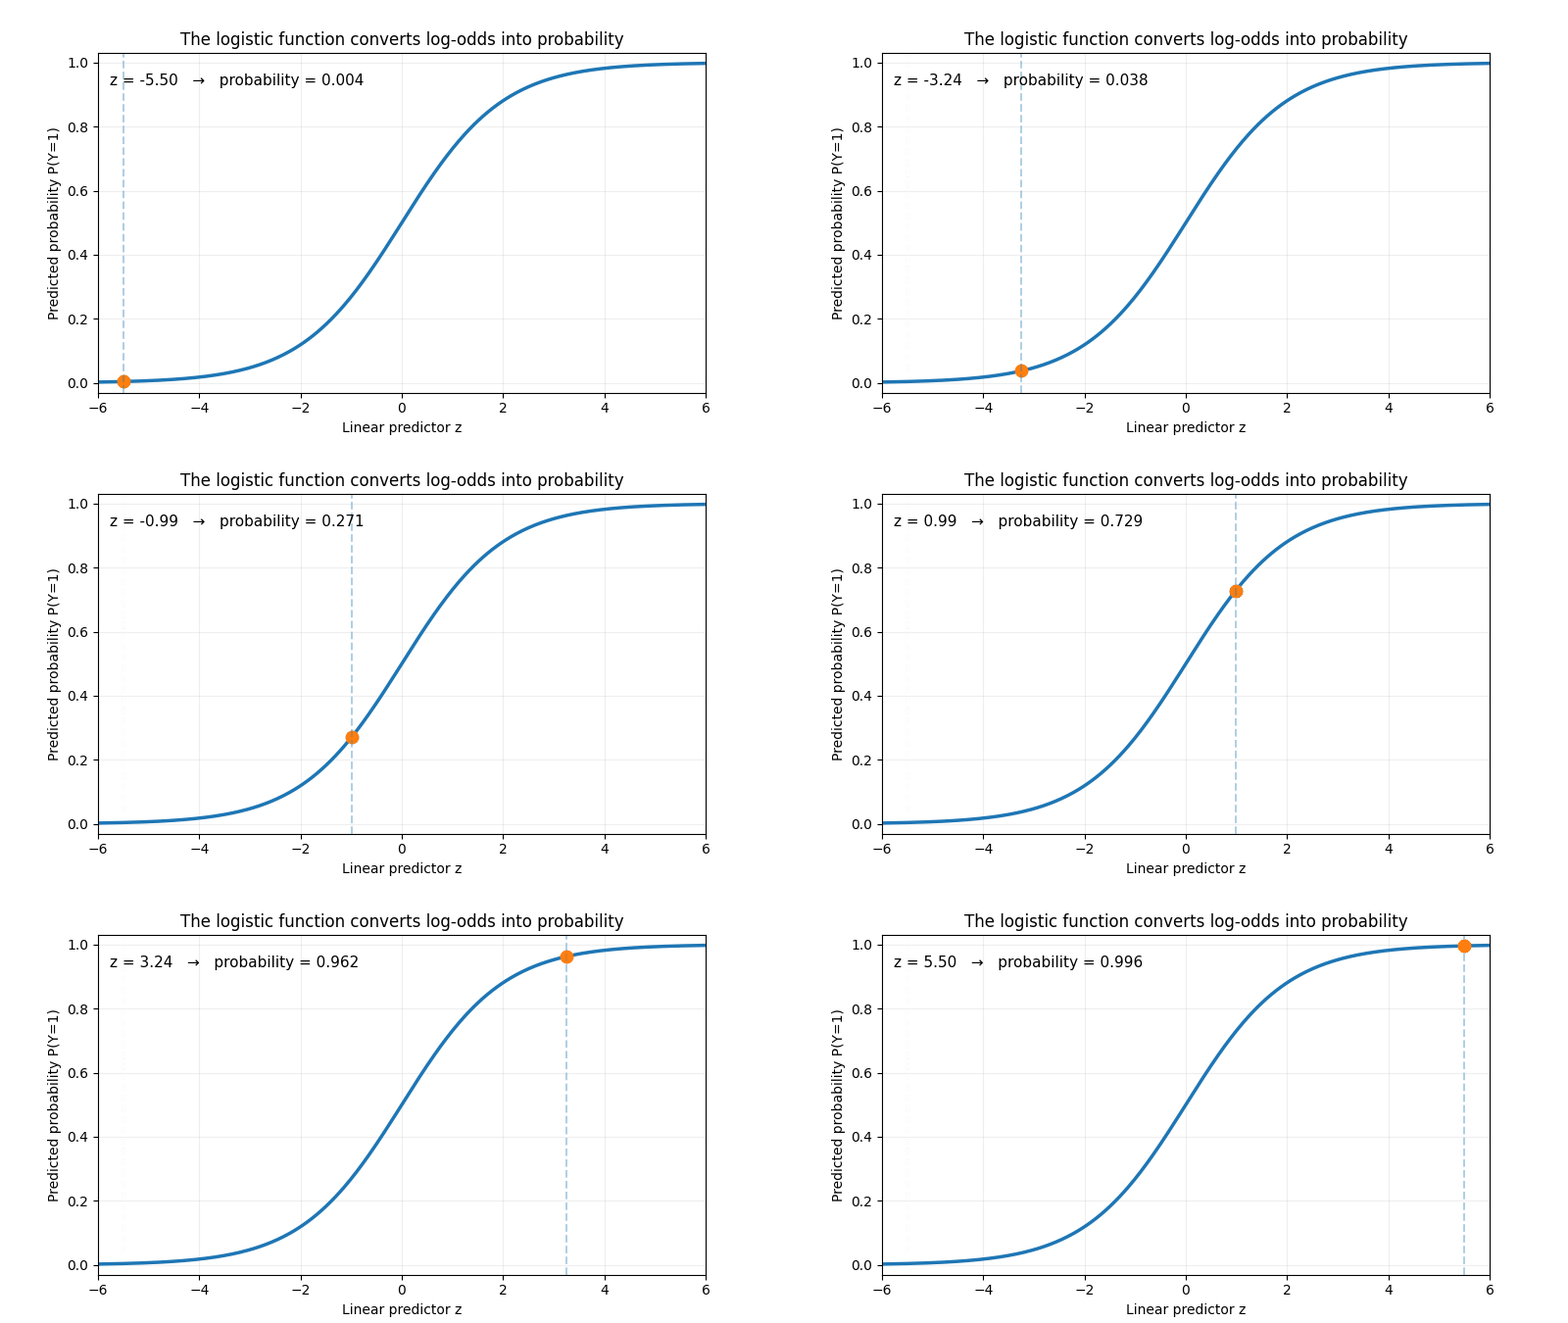
Logistic regression models the probability of a categorical event. In binary logistic regression, the outcome has two categories, commonly coded 0 and 1. Typical examples include purchase/no purchase, disease/no disease, pass/fail, churn/stay, and default/no default.
Instead of fitting a straight line directly to probability, logistic regression models the log-odds of the event as a linear combination of predictors. The logistic transformation then converts those log-odds back into a valid probability between 0 and 1.
Logistic Regression vs. Linear Regression
Linear regression is designed primarily for continuous outcomes and its predictions are not constrained to the 0–1 interval. Logistic regression uses a link function that is appropriate for a binary response, so a predicted value can be interpreted as an event probability when the model is properly specified.
The word “linear” still matters: the predictors combine linearly in the logit, even though their relationship with probability is S-shaped rather than a straight line.
Binary, Multinomial, and Ordinal Logistic Regression
Binary logistic regression is appropriate when the outcome has two categories. If the outcome has three or more unordered categories, multinomial logistic regression may be appropriate. If the categories have a meaningful order, such as low, medium, and high severity, an ordinal model is usually a more natural starting point. The outcome structure should determine the model family rather than forcing every categorical problem into a binary format.
How Logistic Regression Works
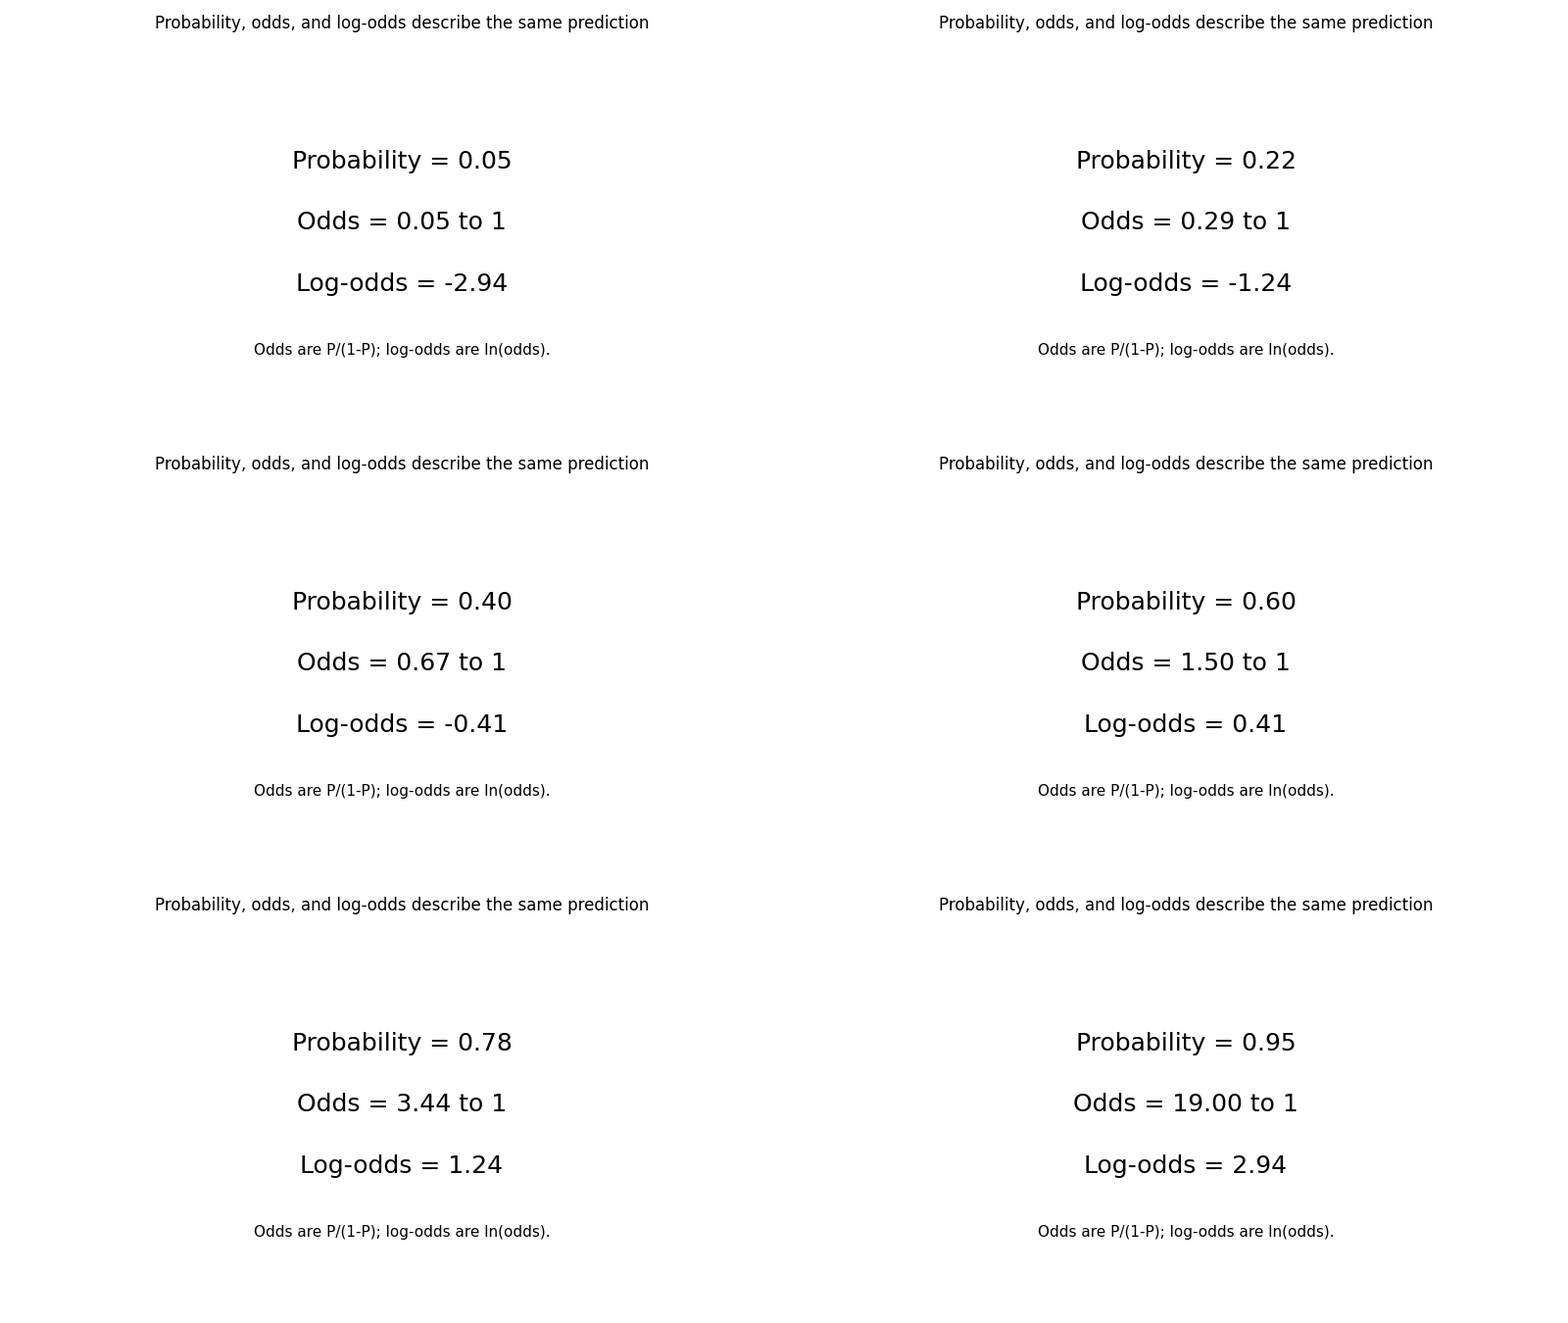
The model connects predictors to an event probability through a sequence of related quantities. Predictor values produce a linear predictor z. That value is the modeled log-odds. The sigmoid function then converts the log-odds into probability.
When z = 0, the predicted probability is 0.5. Positive z values correspond to probabilities above 0.5; negative z values correspond to probabilities below 0.5.
Probability Is Not the Same as Classification
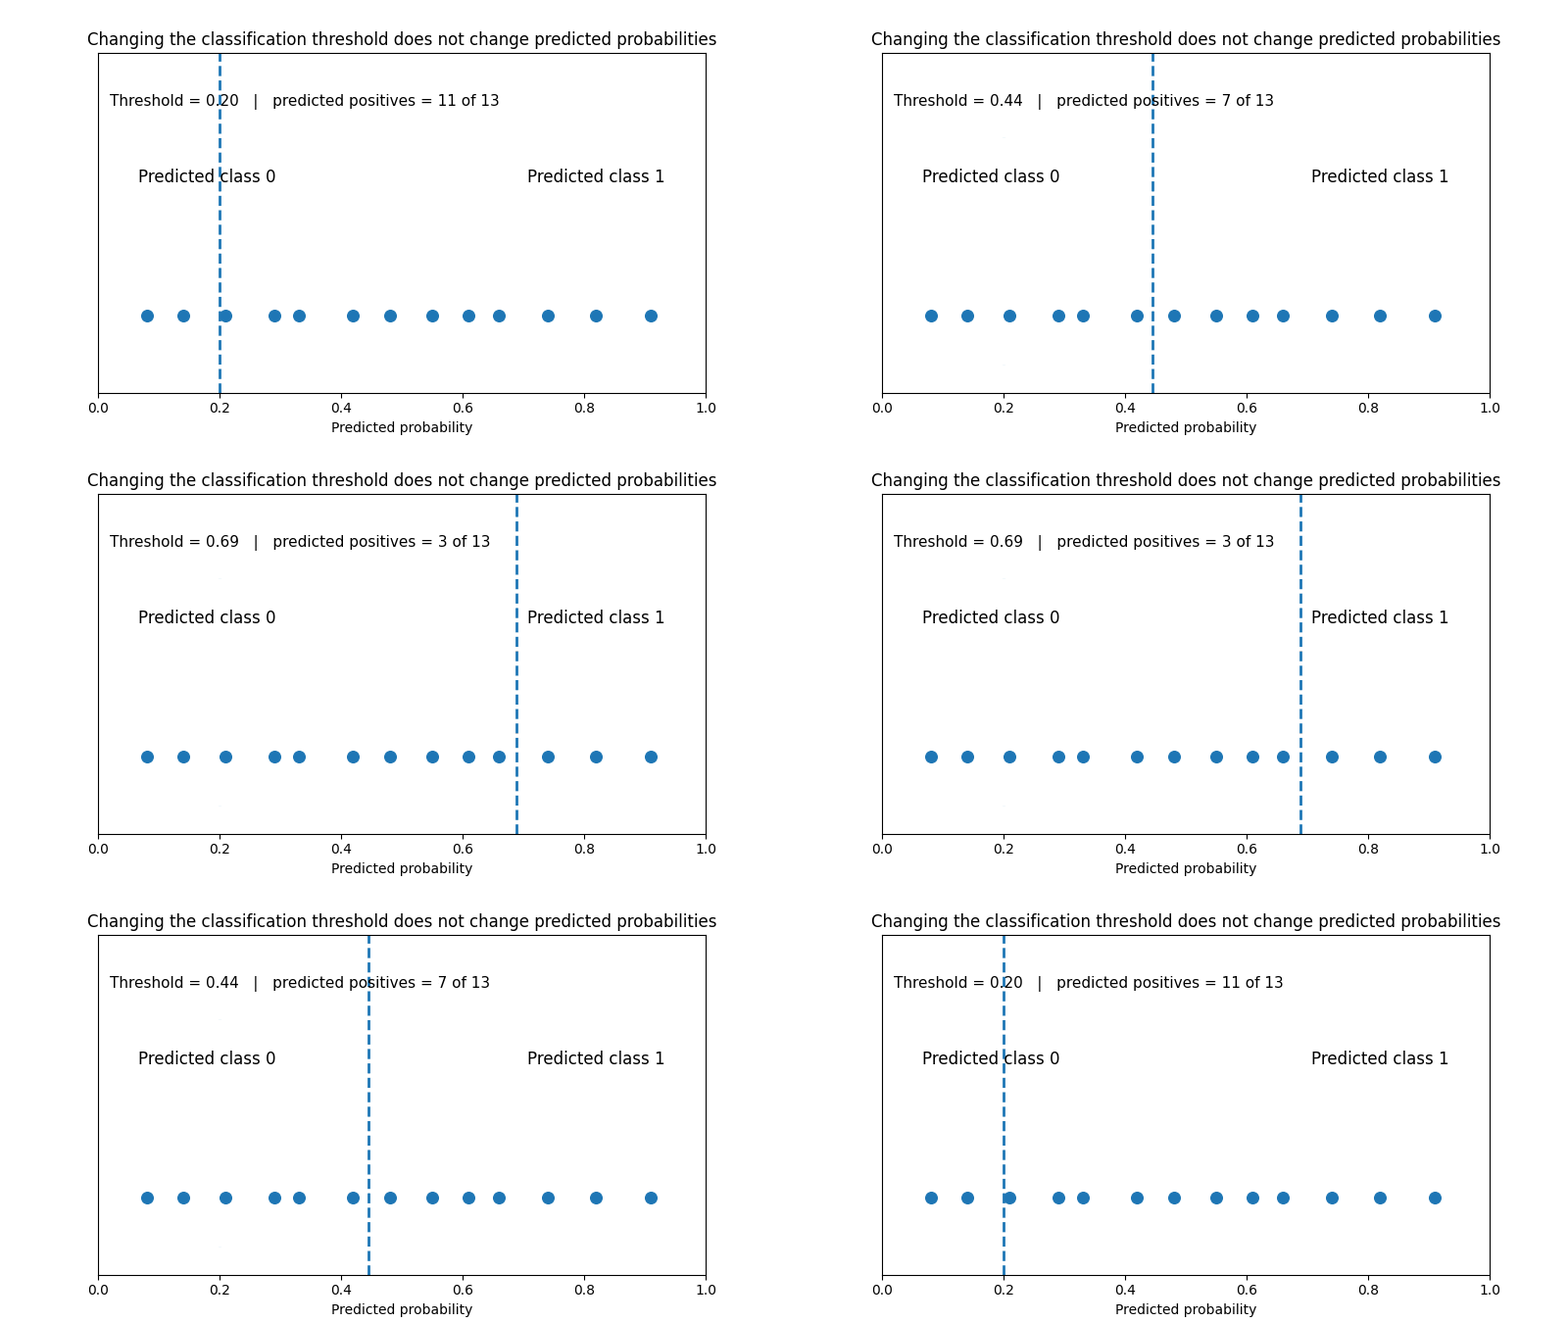
A logistic model estimates probabilities. A classification is a later decision. A model can predict P(Y=1)=0.43 and still be classified as positive if the operational cutoff is 0.30, or negative if the cutoff is 0.50. Changing the threshold changes the decision, not the fitted probability.
This distinction is explicit in current scikit-learn guidance: probability estimation and the decision rule are separate problems, and a default 0.5 threshold need not be optimal for a particular application [7].
How to Interpret Logistic Regression Results
Coefficients Describe Changes in Log-Odds
A positive coefficient means that increasing the predictor increases the modeled log-odds of Y=1, holding the other terms in the model constant. A negative coefficient means the modeled log-odds decrease. A coefficient of zero corresponds to no change in log-odds from that predictor under the specified model.
Odds Ratios Are Multiplicative Changes in Odds
Exponentiating a coefficient produces an odds ratio in the usual no-interaction interpretation. If β = 0.223, then e^β ≈ 1.25. That corresponds to about 25% higher odds for a one-unit increase in the predictor, holding the other modeled variables constant. UCLA’s statistical guidance makes the same distinction between coefficients on the log-odds scale and exponentiated coefficients on the odds-ratio scale [1].
Important interpretation warningAn odds ratio of 1.25 means 25% higher odds, not necessarily a 25% higher probability.
Why the Same Odds Ratio Can Produce Different Probability Changes
Suppose an event begins with a 10% probability. The odds are 0.10/0.90 ≈ 0.111. Doubling those odds gives about 0.222, which converts to a probability of approximately 18.2%. The probability did not double to 20%.
If the starting probability is 50%, the starting odds are 1. Doubling the odds gives 2, which converts to about 66.7%. The same odds ratio therefore produces different absolute probability changes depending on the starting probability and the values of the other predictors.
| Probability | Odds | Log-odds |
|---|---|---|
| 0.10 | 0.111 | −2.197 |
| 0.25 | 0.333 | −1.099 |
| 0.50 | 1.000 | 0.000 |
| 0.75 | 3.000 | 1.099 |
| 0.90 | 9.000 | 2.197 |
P-Values and Confidence Intervals Need Context
A p-value is not an importance score. It addresses evidence against a specified null hypothesis under the assumptions of the analysis. A predictor can have a small p-value but a practically trivial effect, while an apparently large effect can remain highly uncertain in a small or sparse sample. Confidence intervals help show that uncertainty.
Statistical significance also does not establish causation. Logistic regression describes conditional associations unless the study design and identifying assumptions justify a causal interpretation.
Categorical Predictors Depend on a Reference Category
Categorical predictors are usually represented relative to a reference category. If a plan variable contains Basic, Standard, and Premium and Basic is the reference, the Standard and Premium coefficients describe comparisons with Basic while the other modeled variables are held constant. Changing the reference changes the coefficient comparisons, not the fitted probabilities from an otherwise equivalent model.
How to Fit Logistic Regression From Raw Data
If you have observations rather than coefficients, you need model fitting rather than a probability calculator. A sound workflow starts with the meaning and structure of the data, not with the Fit button.
Define the Outcome Before You Fit the Model
Decide exactly what the event means and how it is coded. If 1 means “default” in one dataset and “no default” in another, the coefficient signs and predicted probabilities change meaning. Confirm the event category before interpreting any output.
Prepare Predictors With the Intended Analysis in Mind
Continuous variables can often remain continuous. Categorical predictors require suitable coding. Missing values need an explicit handling strategy. Scaling may be important for numerical stability or regularized models, but standardization is not a universal statistical requirement for ordinary logistic regression.
Fit, Interpret, Predict, Then Validate
After estimating the coefficients, interpret effects and uncertainty in the context of the model specification. Generate predicted probabilities for realistic cases, then evaluate performance using observations that did not determine the fitted coefficients when prediction is the objective.
Logistic Regression Assumptions and Failure Conditions
Independent Observations
Standard logistic regression assumes observations provide independent information. Repeated measurements from the same person or clustered observations within hospitals, schools, companies, or regions may require methods that account for that dependence.
Linearity in the Logit
The model does not require a continuous predictor to have a straight-line relationship with probability. It requires its functional form to be appropriate on the log-odds scale. Curvature can be modeled with transformations, splines, or other terms when justified.
Multicollinearity
Strong dependence among predictors can make individual coefficient estimates unstable and widen uncertainty. The practical issue is not merely whether two variables are correlated, but whether the design contains enough independent information to estimate their separate contributions. Removing variables mechanically based on a correlation threshold can discard substantively important information.
Complete and Quasi-Complete Separation
A particularly important failure occurs when one predictor, or a combination of predictors, perfectly separates the two outcome classes. Ordinary maximum-likelihood coefficients can then diverge or become extremely large. Very large coefficients, huge standard errors, and convergence warnings should trigger a diagnostic check rather than immediate interpretation.
Sample Size Is More Nuanced Than “10 Events per Variable”
The familiar 10-events-per-variable rule is a historical rule of thumb, not a universal guarantee. Methodological work on prediction-model development shows that required sample size depends on the number of predictor parameters, the total sample size, outcome prevalence, expected predictive performance, and the amount of overfitting that can be tolerated [6].
Practical priorityBefore adding more predictors, make sure the dataset contains enough outcome information to support them. Extra model complexity consumes information even when software can technically produce an estimate.
How to Evaluate a Logistic Regression Model
There is no single metric that proves a model is good. Evaluation should match the intended use. A model built to rank cases has different requirements from one whose predicted probabilities will drive treatment, pricing, outreach, or another decision.
Confusion Matrix Metrics Depend on the Threshold
Once a classification threshold is chosen, predictions can be separated into true positives, false positives, true negatives, and false negatives. Accuracy measures the overall fraction classified correctly. Sensitivity or recall measures how many actual positives are detected. Specificity measures how many actual negatives are correctly rejected. Precision asks how many predicted positives are truly positive. F1 combines precision and recall.
Accuracy Can Be Misleading With Imbalanced Outcomes
If only 2% of observations experience an event, a classifier that predicts “no event” for everyone achieves 98% accuracy while detecting none of the events. This is why class balance and error costs must be considered before treating accuracy as the headline metric.
ROC AUC Measures Discrimination, Not Probability Accuracy
ROC AUC summarizes how well prediction scores separate positives from negatives across thresholds. It is useful for discrimination, but it does not tell you whether a predicted 70% risk corresponds to an observed event rate near 70%. There is also no context-free AUC value that makes a model universally acceptable.
Calibration Tests Whether Probabilities Mean What They Say
Calibration addresses the numerical reliability of predicted probabilities. In a well-calibrated binary classifier, observations assigned probabilities near 0.8 should experience the positive outcome at roughly an 80% rate in an appropriate validation setting. Current scikit-learn documentation describes calibration curves, or reliability diagrams, as comparisons between predicted probabilities and observed positive-label frequencies [5].
This distinction is especially important in medicine, finance, forecasting, and other settings where users act on the probability itself rather than merely ranking cases.
Choose a Threshold for the Decision, Not for Tradition
A 0.50 threshold is a common software default, not a universal optimum. If missing a positive case is costly, a lower threshold may be preferable. If false positives are costly, a higher threshold may be justified. Current scikit-learn examples explicitly show post-hoc threshold tuning for a chosen metric or cost objective [7].
Validate Beyond the Training Data
For predictive work, performance should be estimated on data that did not determine the fitted coefficients, using an appropriate design such as resampling, cross-validation, temporal validation, or external validation. The right approach depends on sample size, data structure, and the intended deployment population.
Practical Logistic Regression Examples
The same mathematics can serve very different decisions. In education, a model may estimate admission or dropout probability. In ecommerce and marketing, it may estimate conversion, response, or churn. In manufacturing, it may estimate defect or failure risk. In finance, it may contribute to default or fraud prediction. In healthcare, it may estimate diagnosis or prognosis.
The model form is similar, but the practical standard is not. A classroom exercise can tolerate simplifications that would be unacceptable in a clinical or regulated decision system. High-stakes applications require stronger validation, governance, fairness assessment where relevant, and domain-specific review. This general calculator guide should not be treated as regulatory or clinical guidance.
The most important operational difference across industries is often the cost of errors. Missing a dangerous medical condition, wrongly blocking a legitimate financial transaction, and sending an unnecessary marketing offer have very different consequences. The classification threshold should reflect that context.
Logistic Regression in Python and R
Fit a Statistical Logistic Model With statsmodels
import statsmodels.api as sm

X = data[["x1", "x2", "x3"]]
X = sm.add_constant(X)
y = data["outcome"]

model = sm.Logit(y, X)
result = model.fit()
print(result.summary())
A practical implementation detail is easy to miss: statsmodels.Logit does not add an intercept automatically. The official documentation states that a constant should be added by the user when required [3].
Fit a Machine-Learning Logistic Classifier With scikit-learn
from sklearn.linear_model import LogisticRegression

X = data[["x1", "x2", "x3"]]
y = data["outcome"]

model = LogisticRegression()
model.fit(X, y)
probabilities = model.predict_proba(X)[:, 1]
Scikit-learn positions LogisticRegression as a classifier and applies regularization by default [2]. That differs from many traditional unpenalized maximum-likelihood analyses. Coefficients from two tools therefore need not match unless regularization, scaling, coding, missing-data handling, and the rest of the model specification are aligned.
Run Logistic Regression in R
model <- glm(
  outcome ~ x1 + x2 + x3,
  data = data,
  family = binomial
)

summary(model)
In R, the binomial family uses the logit link by default unless another supported link is specified [4].
Why Two Logistic Regression Calculators Can Disagree
Different answers are not automatically evidence that one tool is broken. Differences can arise from regularization, whether an intercept is included, standardization, categorical encoding, outcome/reference coding, missing-value handling, sample weights, convergence tolerances, or optimization settings. Before comparing coefficients, verify that the two tools are fitting the same mathematical model to the same observations.
Logistic Regression vs. Other Classification Methods
| Method | Useful when | Main trade-off |
|---|---|---|
| Logistic regression | You want interpretable probability modeling and a relatively transparent baseline. | Requires appropriate functional form and model specification. |
| Decision tree | Rules and nonlinear splits are central to the problem. | Can be unstable and prone to overfitting. |
| Random forest | Flexible nonlinear prediction is more important than simple coefficients. | Less direct coefficient-level interpretation. |
| Naive Bayes | Fast classification is needed and its assumptions are reasonable for the feature structure. | Conditional-independence assumptions can be restrictive. |
| Support vector machine | A flexible decision boundary is more important than direct probability interpretation. | Probability outputs and interpretation are less direct. |
A more complex model is not automatically better. If logistic regression provides adequate validated performance and interpretability matters, replacing it solely because another method sounds more advanced can add complexity without useful decision value.
When Should You Use Logistic Regression?
Logistic regression is a strong candidate when the outcome is binary, the predictors can be represented with an appropriate functional form, probability estimates are useful, and interpretability matters. It is particularly helpful when analysts need a clear relationship between predictors, log-odds, odds ratios, and predicted probabilities.
Consider another model or an extension when the response has ordered or multiple unordered categories, observations are strongly clustered or repeated, the outcome is time-to-event, separation prevents ordinary maximum-likelihood estimation, or important nonlinear and interaction structure cannot be represented adequately in the chosen specification.
Suitability micro-answerUse logistic regression because it fits the outcome and decision problem, not merely because the software makes it easy to run.
Common Logistic Regression Mistakes and How to Avoid Them
Treating Odds Ratios as Probability Ratios
An odds ratio of 1.25 means 25% higher odds under the model comparison. The corresponding probability change depends on the baseline probability and other predictor values.
Assuming P < 0.05 Proves Importance
Statistical significance does not establish a large effect, useful prediction, or causation. Read the estimate, uncertainty, model design, and practical consequences together.
Automatically Using a 0.50 Cutoff
The model predicts probability; the threshold determines action. Pick the threshold according to the operating objective and error costs, ideally using validation data rather than training-set optimization alone.
Ignoring Nonlinearity in the Logit
A sigmoid-shaped probability curve does not mean every continuous predictor has been modeled correctly. Functional form still matters on the log-odds scale.
Evaluating Only the Training Data
Training performance can be optimistic. Predictive claims should be supported with a validation design appropriate to the intended use.
Ignoring Calibration
Good ranking does not guarantee good probabilities. If decisions depend on a reported 10%, 40%, or 80% risk, probability calibration deserves explicit evaluation.
How to Choose a Logistic Regression Calculator or Tool
For a quick probability from known coefficients, a lightweight logistic regression calculator should accept the intercept, coefficients, and predictor values and return at least the linear predictor and predicted probability. Showing odds as well is useful because it connects the numerical result to coefficient interpretation.
For fitting raw data, choose a tool that exposes enough information to understand what was estimated. At minimum, you should be able to confirm the event coding, intercept treatment, predictor coding, regularization setting, sample actually used, coefficient estimates, uncertainty where relevant, and convergence status.
For reproducible research or repeated analysis, statistical software such as R, statsmodels, scikit-learn, Stata, SPSS, or another documented environment is usually more appropriate than relying only on a webpage output. The relevant choice is not which brand is most familiar, but whether the tool supports the intended inference, prediction, validation, and reproducibility workflow.
FAQs
What Is the Logistic Regression Formula?
The linear predictor is z = β₀ + β₁X₁ + … + βₖXₖ. The predicted probability is P(Y=1) = 1/(1+e^(−z)). The equivalent logit form is ln(P/(1−P)) = z.
How Do You Calculate Probability From Logistic Regression Coefficients?
Multiply each predictor value by its coefficient, add those products to the intercept to obtain z, then apply P = 1/(1+e^(−z)). Always confirm which outcome is coded as 1 before interpreting the result.
What Does an Odds Ratio Greater Than 1 Mean?
It indicates higher modeled odds of the event for the specified predictor comparison, holding other modeled terms constant. The exact interpretation depends on whether the predictor is continuous, categorical, transformed, or involved in an interaction.
What Does an Odds Ratio Below 1 Mean?
It indicates lower modeled odds. An odds ratio of 0.80 corresponds to about 20% lower odds, not automatically a 20% lower probability.
What Is a Good AUC for Logistic Regression?
There is no universal cutoff that makes an AUC good enough. Required discrimination depends on the application, error consequences, competing models, and validation population. AUC also does not replace calibration.
Does Logistic Regression Require Normally Distributed Predictors?
No. Predictor variables do not need to be normally distributed. More relevant concerns include outcome specification, dependence among observations, appropriate functional form, separation, and whether the available data support the intended model complexity.
Does Logistic Regression Require a 0.5 Cutoff?
No. A 0.5 threshold is a common default for converting probabilities into binary labels, but another threshold can be more appropriate when the consequences of false positives and false negatives are unequal [7].
How Many Predictors Can a Logistic Regression Model Have?
There is no universal fixed maximum. The practical limit depends on the amount and distribution of outcome information, predictor parameterization, anticipated performance, penalization, and acceptable overfitting. Fixed events-per-variable rules should not be treated as guarantees [6].
Can Logistic Regression Handle More Than Two Outcomes?
Yes, through related models. Multinomial logistic regression addresses multiple unordered categories, while ordinal logistic regression is designed for ordered categories.
What Is the Difference Between Logistic Regression and a Logit Model?
In ordinary binary-outcome usage, “binary logistic regression” and “binary logit model” usually refer to the same model: a binomial response modeled with a logit link.
Quick Summary: From Calculator Input to a Defensible Decision
A logistic regression calculator is useful when you need to turn known coefficients and predictor values into a probability quickly. If you have raw binary outcome data, the correct first step is to fit the model, not to invent coefficients or treat a prediction formula as estimation.
The most important practical insight is that the number on the screen is only the start of interpretation. Coefficients operate on log-odds, odds ratios are not probability ratios, 0.50 is not a universal decision threshold, and strong discrimination does not guarantee calibrated probabilities.
Use logistic regression when its outcome structure, assumptions, and level of complexity fit the problem. For research or consequential decisions, validate the model beyond the training data and use software that makes the fitting choices reproducible. The calculator supplies the probability; the surrounding analysis determines whether that probability deserves to guide a decision.
Sources and Verification Notes
The technical claims in this guide were checked against current software documentation and methodological or statistical references. Software defaults can change, so implementation-specific details should be rechecked when the page is meaningfully updated.
- UCLA Statistical Consulting. How do I interpret odds ratios in logistic regression?
- scikit-learn. LogisticRegression documentation
- statsmodels. Logit documentation
- R Project. Family objects for models: binomial(link = "logit")
- scikit-learn. Probability calibration documentation
- Riley et al., BMJ. Calculating the sample size required for developing a clinical prediction model
- scikit-learn. Post-hoc tuning of the decision threshold