
Machine Learning Projects for Final Year Students
Machine learning projects for final year students are capstone assignments that use data to classify, predict, recommend, detect, forecast, or optimize an outcome. Typical examples include fraud detection, crop…
A practical guide to choosing, building, testing, deploying, and presenting a credible final year project
| Machine learning projects for final year students should solve a clear problem, use suitable data, compare a baseline with stronger models, and produce a result that can be tested. The best project is not necessarily the most complex one; it is the one you can evaluate, explain, deploy, and defend with evidence. |
|---|
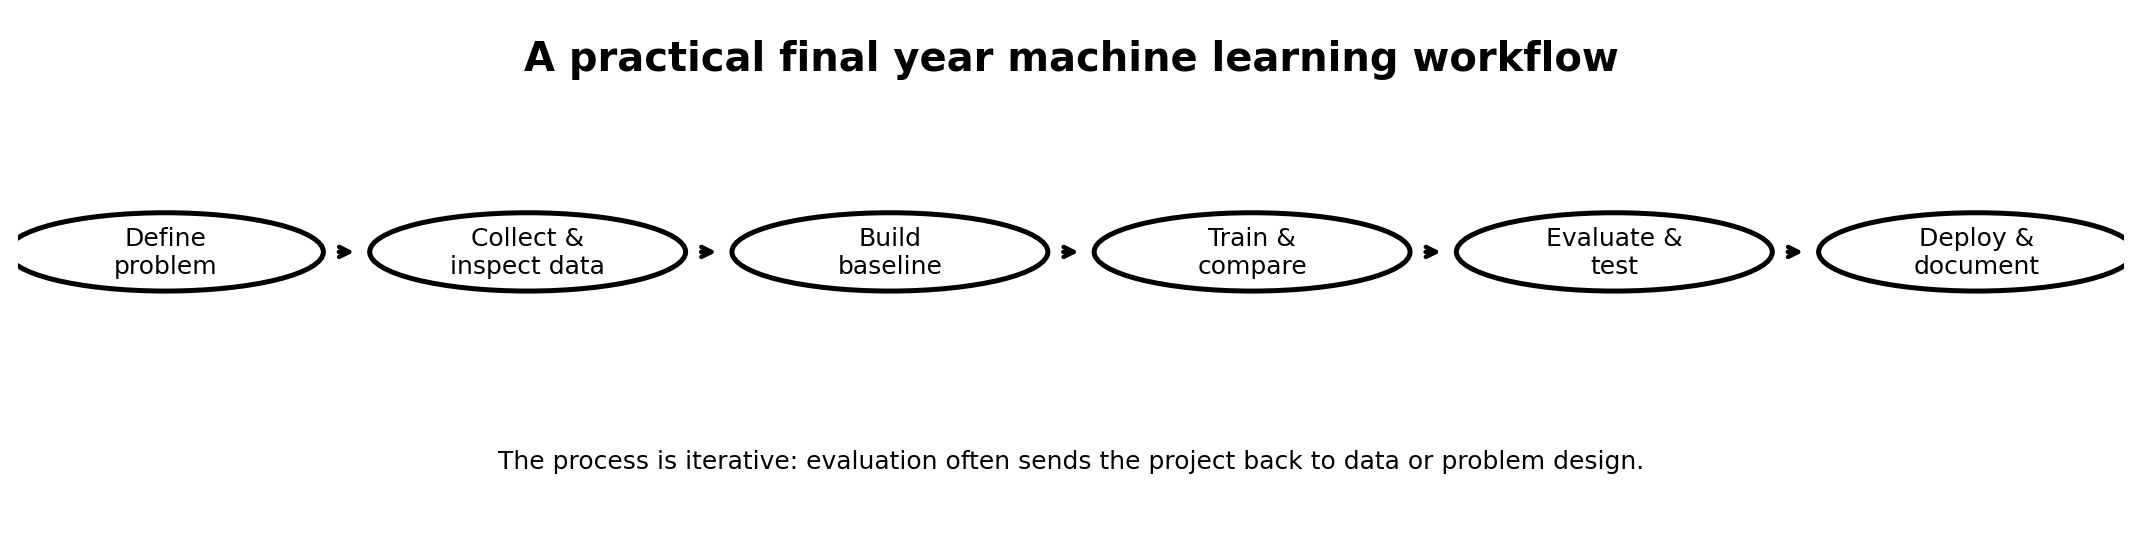
Figure 1. A complete project moves from problem definition to deployment and documentation.
What Are Machine Learning Projects for Final Year Students?
Machine learning projects for final year students are capstone assignments that use data to classify, predict, recommend, detect, forecast, or optimize an outcome. Typical examples include fraud detection, crop recommendation, sentiment analysis, medical image classification, traffic forecasting, and recommendation systems.
A complete project normally includes a problem statement, dataset selection, exploratory data analysis, feature engineering, model training, validation, error analysis, deployment, and project documentation. The result may be presented as a web application, API, dashboard, research report, GitHub repository, or live demonstration.
| Extractable fact: A trained model is only one component of a final year project. The complete work connects a defined problem, reproducible data processing, measurable evaluation, and a usable output. |
|---|
Why These Projects Matter
These projects convert classroom knowledge into evidence of practical ability. They show whether a student can handle messy data, choose appropriate metrics, compare alternatives, identify limitations, and communicate results to both technical and non-technical audiences.
From what I’ve seen, evaluators respond more positively to a modest end-to-end system than to an ambitious idea that stops at model training. A deployed customer-churn dashboard with honest error analysis can be more persuasive than a complex language model with no reliable test plan.
Modern project work increasingly includes retrieval-based assistants, multimodal systems, automated workflows, model monitoring, and MLOps. These technologies are valuable only when they improve the use case, not when they are added to make the title sound advanced.
| Practical observation: Reproducibility, deployment, and honest evaluation often create stronger portfolio value than a small increase in model accuracy. |
|---|
Core Concepts Every Project Should Demonstrate
A strong project should define the target, identify useful features, separate training and test data correctly, establish a baseline, and select metrics that reflect the real cost of errors. For classification, precision, recall, F1-score, ROC-AUC, or PR-AUC may be more useful than accuracy when classes are imbalanced.
Regression and forecasting projects commonly use MAE, RMSE, MAPE, and R-squared. Time-series projects should preserve chronology during validation, because randomly mixing future observations into training data can produce misleading results.
Theoretical advice often says to maximize predictive performance, but in practice, interpretability, inference speed, data availability, privacy, and maintenance can be equally important. A slightly less accurate model may be the better engineering decision when it is faster, cheaper, and easier to explain.
| Decision rule: The best metric is the one that reflects the consequence of the model’s mistakes, not the one that creates the largest score. |
|---|
How a Final Year Project Works in Real Use
In real use, development is iterative. Students frequently discover missing labels, duplicates, biased samples, weak features, data leakage, or unrealistic assumptions after the first experiment. The project then returns to data preparation or even problem definition.
What practitioners often do is build a simple baseline first. Logistic Regression, a Decision Tree, or a rule-based method creates a reference point before Random Forest, XGBoost, neural networks, transformers, or ensemble methods are introduced.
A baseline forces advanced models to justify their complexity. A deep network that improves a metric by only a small amount may not be worthwhile if it needs expensive hardware, takes much longer to train, and cannot be explained during the viva.
| Mini-fact: A baseline changes the claim from “the model performs well” to “the model outperforms a defined and reproducible alternative.” |
|---|
How to Choose the Right Project
Choose a project by balancing personal interest, data access, project duration, computing resources, academic value, and career relevance. Confirm that the problem has a measurable outcome and that the required data can be obtained legally and ethically.
A common mistake is selecting a topic because its name sounds impressive. A healthcare assistant or multi-agent platform becomes weak when the student cannot verify outputs, protect sensitive information, or define success. A focused project such as regional-language complaint classification or campus energy forecasting may provide greater originality and clearer evidence.
The contrarian insight is that originality does not require inventing a new algorithm. It can come from a new dataset, a local problem, a better evaluation design, a useful interface, or a careful analysis of where an existing approach fails.
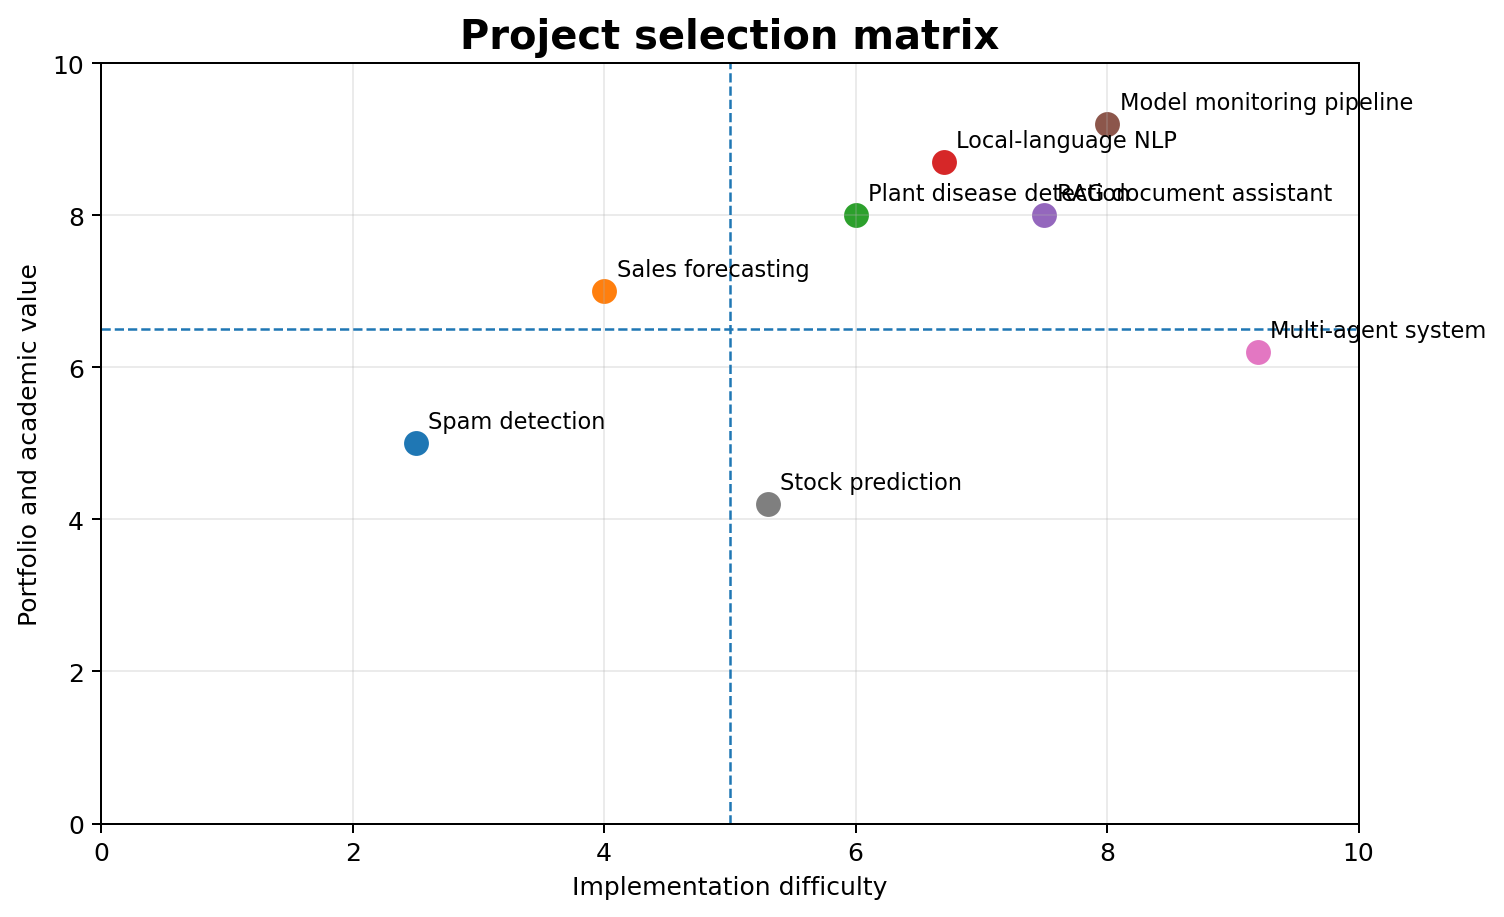
Figure 2. A smaller, well-scoped project can deliver more value than an overambitious system.
Detailed machine-learning project table
| # | Project | Core problem and output | Suggested dataset | Baseline → stronger models | Key evaluation metrics | Final deliverable | Difficulty | Suggested duration |
|---|---|---|---|---|---|---|---|---|
| 1 | Email Spam Detection | Classify an email or message as spam or legitimate. Add explanations showing which terms influenced the prediction. | UCI Spambase, SMS Spam Collection, or a locally collected bilingual message dataset | Keyword rules or Naive Bayes → Logistic Regression, SVM, DistilBERT | Precision, recall, F1-score, PR-AUC, confusion matrix | Web app where users paste a message and receive a prediction with highlighted keywords | Beginner | 4–6 weeks |
| 2 | Wine Quality Prediction | Predict a wine-quality score from physicochemical measurements, or group wines into low, medium, and high quality. | UCI Wine Quality, which includes red and white wine measurements and sensory-quality outputs. | Mean predictor or Linear Regression → Random Forest, XGBoost, CatBoost | MAE and RMSE for regression; macro F1 for classification | Interactive dashboard with quality prediction, feature distributions, and SHAP explanations | Beginner | 4–6 weeks |
| 3 | Loan Approval Risk Assessment | Estimate whether a loan application is likely to be approved or whether an applicant represents elevated repayment risk. | Public credit-risk dataset or a carefully anonymized synthetic banking dataset | Majority-class rule or Logistic Regression → Random Forest, XGBoost, CatBoost | Recall, precision, F1, ROC-AUC, fairness measures across demographic groups | Risk-assessment dashboard with probability, reason codes, and fairness analysis | Beginner–Intermediate | 6–8 weeks |
| 4 | Customer Segmentation | Divide customers into meaningful groups based on spending, recency, frequency, product preferences, or engagement. | UCI Online Retail or transactional data from a local shop. UCI’s dataset contains transactions from a UK-based online retailer. | Manual RFM grouping → K-means, Gaussian Mixture, hierarchical clustering, DBSCAN | Silhouette score, Davies–Bouldin index, cluster stability, business interpretability | Dashboard showing cluster profiles and recommended marketing actions | Beginner | 5–7 weeks |
| 5 | Insurance Cost Prediction | Predict expected insurance charges from age, health indicators, lifestyle, and coverage information. | Medical Cost Personal Dataset or a synthetic insurance dataset | Mean prediction or Linear Regression → Random Forest, Gradient Boosting, CatBoost | MAE, RMSE, R², residual analysis | Web calculator with predicted range, influential variables, and uncertainty warning | Beginner | 4–6 weeks |
| 6 | Retail Sales Forecasting | Forecast daily or weekly product sales to support purchasing and inventory planning. | Store sales, supermarket sales, or locally collected point-of-sale data | Previous-period value or moving average → Prophet, SARIMA, XGBoost, LightGBM | MAE, RMSE, MAPE or WAPE, forecast bias | Dashboard with future forecasts, prediction intervals, seasonality, and stock alerts | Beginner–Intermediate | 6–9 weeks |
| 7 | Customer Churn Prediction | Predict which customers are likely to cancel a subscription or stop using a service. | Telecom, SaaS, banking, or local membership data | Majority rule or Logistic Regression → Random Forest, XGBoost, CatBoost | Recall at top-k, PR-AUC, F1, ROC-AUC, calibration | Retention dashboard ranking customers by churn risk and showing likely causes | Intermediate | 6–8 weeks |
| 8 | Crop Recommendation System | Recommend a suitable crop based on soil nutrients, temperature, humidity, rainfall, and pH. | Crop Recommendation Dataset, ideally enhanced with regional agricultural or weather records. A commonly used public version combines rainfall, climate, and fertilizer-related data from India. | Rule-based agricultural ranges → Decision Tree, Random Forest, XGBoost | Macro F1, per-crop recall, top-3 accuracy, confusion matrix | Farmer-facing app that recommends crops and explains the influencing conditions | Intermediate | 7–10 weeks |
| 9 | Air-Quality Forecasting | Forecast AQI or pollutant levels and warn when unhealthy conditions are expected. | UCI Air Quality, government monitoring stations, weather APIs, or locally installed sensors | Persistence forecast → SARIMA, Random Forest, XGBoost, LSTM | MAE, RMSE, MAPE, threshold-event recall | City dashboard with pollutant trends, next-day forecast, and health-risk categories | Intermediate | 8–10 weeks |
| 10 | Human Activity Recognition | Classify walking, sitting, standing, lying down, or climbing stairs using smartphone sensor signals. | UCI Human Activity Recognition Using Smartphones, listed among UCI’s time-series datasets. | Majority class or handcrafted threshold rules → Random Forest, SVM, 1D CNN, LSTM | Macro F1, per-activity recall, confusion matrix, inference latency | Mobile or desktop demo processing accelerometer and gyroscope readings | Intermediate | 8–10 weeks |
| 11 | Speech Emotion Recognition | Detect emotions such as happiness, sadness, anger, fear, or neutrality from speech audio. | RAVDESS, CREMA-D, TESS, or locally recorded Urdu/regional-language emotional speech | MFCC features with SVM → CNN, CNN-LSTM, wav2vec 2.0 fine-tuning | Macro F1, unweighted average recall, confusion matrix | Audio-upload app displaying emotion probabilities and waveform features | Intermediate | 8–12 weeks |
| 12 | Customer-Support Ticket Routing | Automatically assign incoming support tickets to the correct team, category, or priority level. | Public support-ticket data, Hugging Face support-routing datasets, or anonymized university IT tickets. Current examples include cleaned ticket-routing datasets designed for intent classification. | Keyword rules or TF-IDF Logistic Regression → SVM, DistilBERT, sentence embeddings | Macro F1, top-2 accuracy, per-department recall, routing latency | Ticket interface recommending department, priority, and confidence | Intermediate | 7–10 weeks |
| 13 | Fake-News Classification with Evidence | Classify a news article as potentially unreliable and retrieve evidence supporting the assessment. It should be framed as decision support, not a definitive truth detector. | LIAR, FakeNewsNet, or a clearly documented Kaggle corpus. Some available corpora contain older articles, so temporal and source bias must be analyzed. | TF-IDF Logistic Regression → BERT or RoBERTa plus evidence retrieval | Macro F1, precision, recall, calibration, source-held-out performance | Browser-style app with risk score, evidence passages, and explicit limitations | Intermediate–Advanced | 10–14 weeks |
| 14 | Personalized Recommendation System | Recommend products, books, films, courses, or research papers based on user history and item similarity. | MovieLens, Amazon reviews, university course records, or library-borrowing data | Most-popular-items baseline → Collaborative Filtering, Matrix Factorization, LightFM, neural recommender | Precision@K, Recall@K, NDCG@K, coverage, diversity | Recommendation web app with user profiles and explanations such as “because you liked…” | Intermediate | 8–12 weeks |
| 15 | Traffic-Flow Forecasting | Predict vehicle volume, average speed, or congestion level for future time intervals. | City traffic sensors, METR-LA, PeMS, or locally collected road-camera counts | Historical average → SARIMA, XGBoost, LSTM, temporal graph neural network | MAE, RMSE, MAPE, peak-congestion recall | Map-based dashboard with hourly forecasts and congestion alerts | Intermediate–Advanced | 10–14 weeks |
| 16 | Document Retrieval Assistant | Answer questions using a controlled collection of university rules, research papers, policies, manuals, or organizational documents, while citing source passages. | Institution-approved PDFs, policies, handbooks, or a research-paper collection | Keyword search or BM25 → Dense retrieval, reranking, retrieval-augmented generation | Recall@K, MRR, answer faithfulness, citation accuracy, response latency | Chat interface with document citations, source snippets, and “not found” handling | Advanced | 10–14 weeks |
| 17 | Medical Chest X-Ray Classification | Detect selected findings in chest radiographs and provide visual explanation maps. The project must remain a research prototype, not a diagnostic product. | MIMIC-CXR or a smaller curated chest X-ray dataset. MIMIC-CXR contains de-identified radiographs and free-text reports, but access and responsible-use requirements must be followed. | Majority-class baseline or pretrained linear classifier → DenseNet, EfficientNet, Vision Transformer | Per-condition AUROC, AUPRC, sensitivity, specificity, calibration | Research dashboard with predictions, Grad-CAM views, uncertainty, and safety disclaimer | Advanced | 12–16 weeks |
| 18 | Model Drift Monitoring System | Detect when live input data or model performance has changed enough to require investigation or retraining. | Historical dataset divided into simulated time periods, or live logs from another project | Fixed threshold on feature means → PSI, KS tests, embedding drift, performance monitoring | Detection delay, false-alert rate, drift-detection recall, post-drift performance loss | Monitoring dashboard with alerts, feature changes, model metrics, and retraining recommendation | Advanced | 10–14 weeks |
Best Project Ideas by Difficulty and Domain
Beginner options include spam detection, loan approval prediction, wine quality classification, customer segmentation, sales forecasting, and insurance price prediction. These projects are suitable for learning pandas, scikit-learn, feature engineering, cross-validation, and model comparison.
Intermediate choices include speech emotion recognition, human activity recognition, recommendation systems, image classification, traffic forecasting, fake news detection, and customer-support ticket routing. Common tools include TensorFlow, PyTorch, OpenCV, Librosa, spaCy, and Hugging Face Transformers.
Advanced projects include document retrieval assistants, medical image analysis, model drift monitoring, multimodal recommendation, multi-object tracking, and automated training pipelines. Strong local angles include crop recommendation for regional soil, rainfall forecasting, local-language speech recognition, city air-quality prediction, and university attendance analysis.
| Information gain: Local datasets often improve academic originality because they require context-specific cleaning, labeling, validation, and stakeholder decisions that generic tutorials do not cover. |
|---|
Step-by-Step Guide to Building the Project
1. Define the problem. State who has the problem, what the model must predict or automate, and how success will be measured.
2. Inspect the data. Document the source, variables, missing values, licensing, class balance, and possible bias.
3. Build a reproducible pipeline. Include cleaning, encoding, scaling, tokenization, image resizing, or augmentation where relevant.
4. Establish a baseline. Use a simple method before testing two or three stronger alternatives.
5. Evaluate on unseen data. Use appropriate metrics, a confusion matrix where useful, and detailed error analysis.
6. Deploy and document. Create a Streamlit interface or FastAPI endpoint, then add setup instructions, limitations, and sample inputs to GitHub.
Error analysis is a frequent competitor gap. It explains which classes, user groups, time periods, or input conditions cause failure, creating more useful insight than another round of blind hyperparameter tuning.
Python, R, or Low-Code Platforms?
Python is the best default for most projects because its ecosystem includes pandas, scikit-learn, TensorFlow, PyTorch, OpenCV, FastAPI, Streamlit, MLflow, and many deployment tools. R remains strong for statistics, forecasting, research-heavy analysis, and visualization.
Low-code platforms can speed up prototypes, but students must still understand preprocessing, assumptions, metrics, and limitations. Writing more code does not automatically make a project stronger. Clear experimental design and defensible decisions are more valuable than unnecessary implementation volume.
When to Use Traditional Models, Deep Learning, or Agents
Use traditional machine learning for structured data, moderate sample sizes, and problems where interpretability matters. Use deep learning for images, audio, video, complex text, and large datasets where learned representations provide a measurable advantage.
Use retrieval-augmented generation for document question answering or knowledge search when the source material changes regularly. Use agents only when the system genuinely needs to retrieve information, call tools, plan several steps, or coordinate actions. A single prediction task rarely benefits from agent complexity.
Search and AI-assisted discovery also reward well-structured project pages. Descriptive headings, concise definitions, named tools, clear metrics, and transparent limitations make documentation easier for people and answer systems to extract and cite.
| Risk check: Adding an agent to a simple prediction task often increases cost, latency, and failure modes without improving the core outcome. |
|---|
From Notebook to a Production-Ready Project
A production-ready student project should include version-controlled code, dependency management, input validation, saved model artifacts, and a usable interface. Useful additions include Docker for reproducibility, MLflow for experiment tracking, GitHub Actions for automated testing, and monitoring for data or concept drift.
The reality layer is simple: many models perform well inside a controlled notebook but fail when users provide missing, unexpected, or differently formatted data. Test the complete application, not only the model, and record deployment bottlenecks, measured inference speed, and lessons learned.
A strong GitHub repository should contain a clear README, system architecture, setup commands, dataset notes, evaluation results, screenshots, known limitations, and a demonstration link. These assets also make the project easier to explain in a viva, technical interview, or research presentation.
| Practical observation: Deployment reveals problems hidden by model training, including invalid inputs, dependency conflicts, slow inference, and changes in real-world data. |
|---|
Are Machine Learning Projects Worth It?
Yes, when the project demonstrates independent problem-solving rather than copied code. It should show a clear path from an uncertain question to a tested, documented, and usable solution.
A smaller working project can outperform an ambitious system because it is easier to reproduce, test, explain, and defend. Select a meaningful problem, compare against a baseline, evaluate honestly, deploy the result, and state what failed as clearly as what worked.
The long-term value comes from the process: data reasoning, engineering judgment, communication, and evidence-based decision-making. Those skills remain useful even as tools and model families change.
Snippet-Ready FAQs
1. Is a simple machine learning project too weak for a final year submission?
No. A simple project becomes strong when it uses a meaningful dataset, compares baselines, includes error analysis, and delivers a working demonstration. Complexity without reliable evidence is usually less convincing.
2. Should I avoid this?
Yes, avoid a project when the data is unavailable, the outcome cannot be measured, or the scope exceeds your time and hardware. Also avoid copying a GitHub repository that you cannot explain, reproduce, or modify.
3. Is an LLM or agent project always better than traditional machine learning?
No. Language models and agents are appropriate for retrieval, generation, tool use, and multi-step workflows, but they can add cost and unreliable behavior. Structured prediction problems are often better served by simpler models.
4. What hidden risk causes otherwise good projects to fail?
Data leakage is one of the most damaging hidden risks because it makes evaluation appear better than real performance. Split data correctly, keep future information out of training, and fit preprocessing only on training data.
5. Will a final year project have long-term career value?
Yes, when it shows reproducible code, sound evaluation, deployment, and clear reasoning. A well-documented project can support interviews and portfolio reviews long after the specific model becomes outdated.
References
1. Scikit-learn, “Metrics and scoring: quantifying the quality of predictions.”
2. Scikit-learn, “Precision-Recall.”
3. Hugging Face Transformers, “Retrieval-Augmented Generation (RAG).”
4. MLflow, “ML Experiment Tracking.”
5. GitHub Docs, “Understanding GitHub Actions.”
6. ProjectPro, “Top Machine Learning Projects for Final Year Students,” updated June 2025.
7. DataCamp, “Machine Learning Projects for All Levels,” updated February 2026.