
Mann-Whitney U Test: Assumptions, Steps and Example
The Mann-Whitney U test is a nonparametric method for comparing two independent groups using ranked observations rather than raw means. Use it when the outcome is at least ordinal, observations are independent, and the…
What Is the Mann-Whitney U Test in Simple Terms?
The Mann-Whitney U test is a nonparametric method for comparing two independent groups using ranked observations rather than raw means. Use it when the outcome is at least ordinal, observations are independent, and the question asks whether values in one population tend to be higher or lower than values in another.
It is also called the Wilcoxon rank-sum test, reflecting related work by Frank Wilcoxon, Henry Mann, and Donald Whitney. The practical idea is to combine observations, rank them, and evaluate how strongly the ranks separate by group.
| Quick definition: The Mann-Whitney U test compares the rank patterns of two independent samples. |
|---|
Core Concepts of the Mann-Whitney U Test Explained
Five elements drive the analysis: pooled ranks, group rank sums, the U statistic, the null hypothesis, and the p-value. The null model usually represents equal population distributions. A small p-value indicates that the observed rank separation would be unusual under that model.
U also has a pairwise meaning: how often an observation from one group exceeds one from the other, with ties handled explicitly. Probability of superiority and rank-biserial correlation therefore complement the p-value.
What Does the Mann-Whitney U Test Actually Tell You?
A common mistake is to describe the Mann-Whitney U test as an automatic test of medians. Medians are not used to calculate U. IBM’s current SPSS guidance states that the test evaluates equality of two distributions; a location interpretation requires the distributions to have the same shape.[1]
When group distributions have similar shapes and mainly differ by location, discussing a shift in central tendency or medians can be reasonable. When shapes or spreads differ, the safer conclusion is that the distributions or rank patterns differ. Two samples can have identical medians and still produce a significant result.
| Interpretation rule: A median interpretation is conditional on similarly shaped distributions, not guaranteed by the test name. |
|---|
When Should You Use the Mann-Whitney U Test?
Use it for exactly two independent groups and an ordinal or continuous outcome that can be meaningfully ranked. Typical applications include symptom ratings, response times, customer scores, biomarkers, exam performance, product metrics, and other outcomes affected by skew or influential outliers.
Theoretical advice often says to switch whenever a normality test is significant, but in practice that rule is too shallow. Welch’s t-test may remain appropriate when the question concerns means. Test choice should follow the estimand and design, not one normality p-value.
Mann-Whitney U Test Assumptions: A Practical Checklist
The outcome must be at least ordinal, the grouping variable must contain two categories, and observations must be independent within and between groups. Independence is a design requirement, not something software can prove from the values alone.
Inspect group shapes, ties, missingness, and influential observations. Similar shapes support a cleaner location-shift interpretation, while ties can affect the choice among exact, asymptotic, and permutation inference.
| Decision rule: Choose the test by the research question and data design, not by a normality test alone. |
|---|
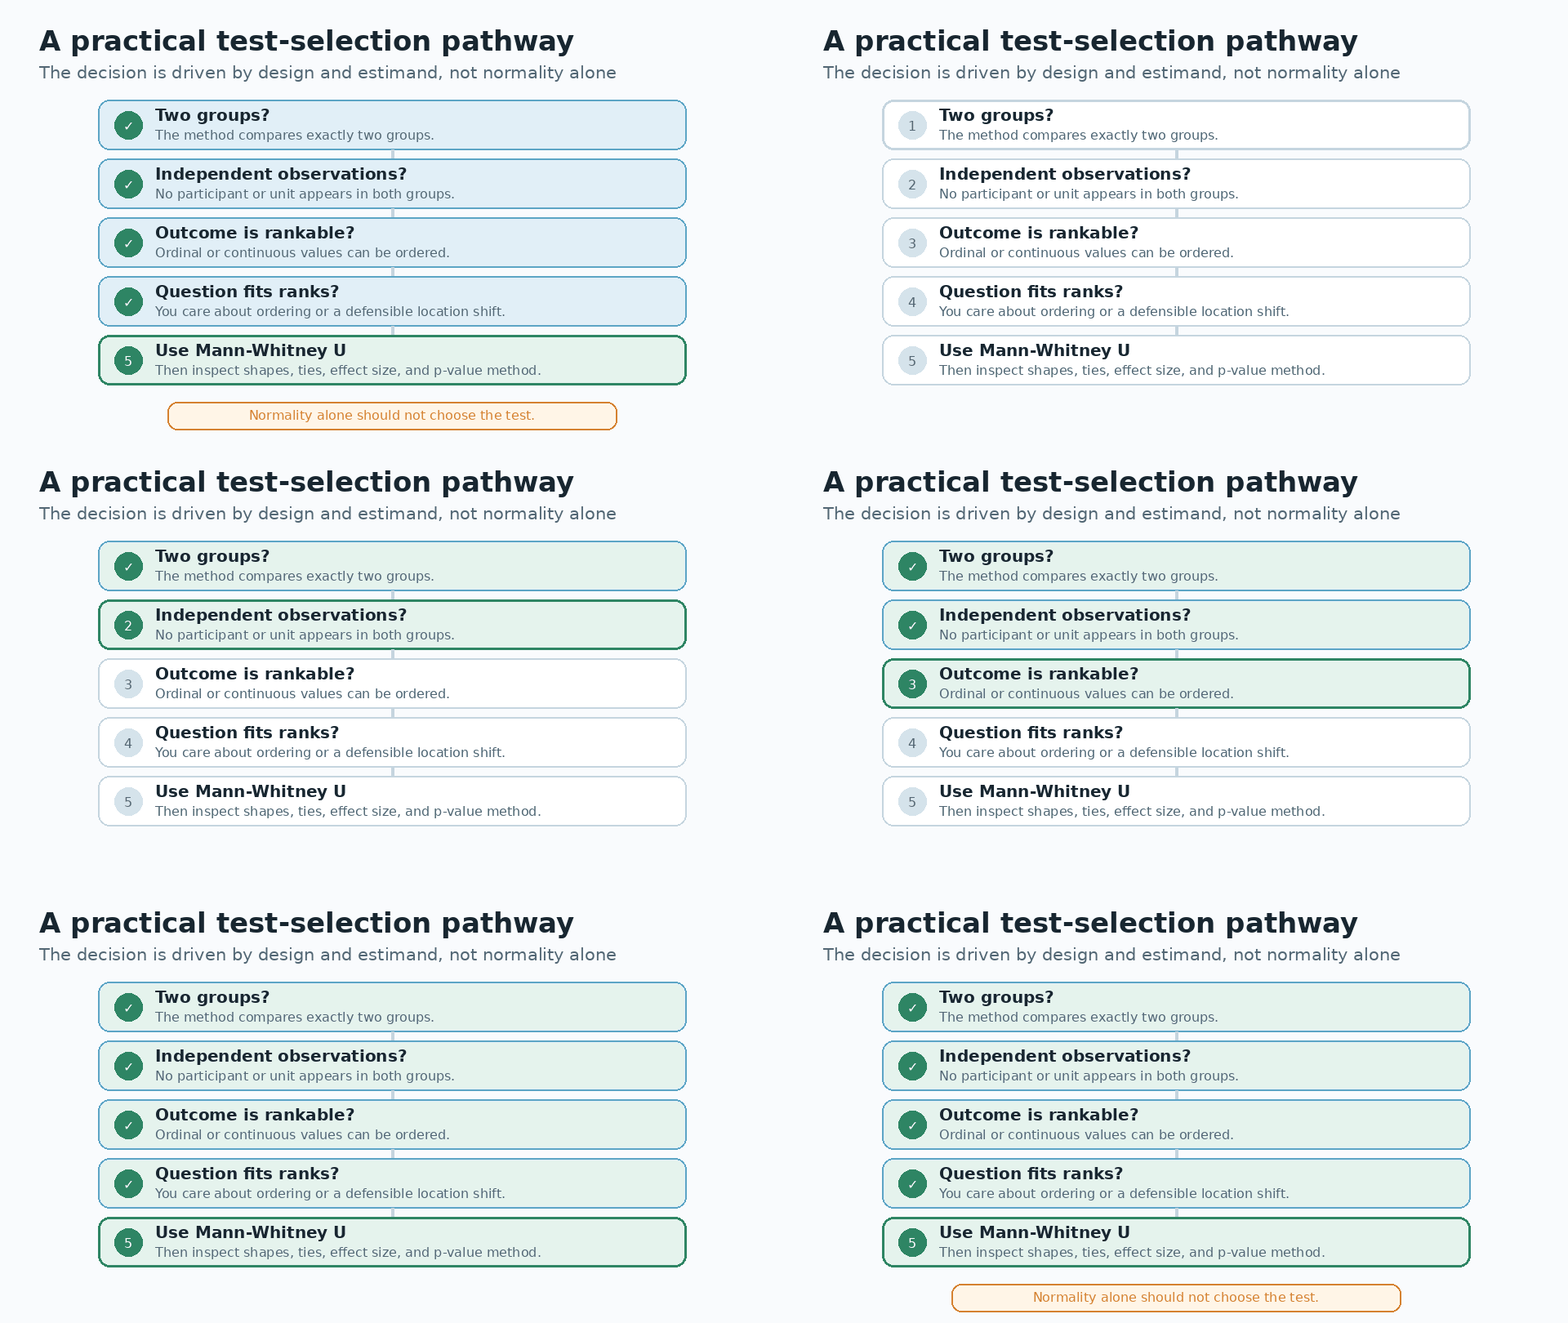
Animation 1. A design-first pathway for deciding whether the Mann-Whitney U test fits the analysis. Animation plays in supported Word views; static and print views show a poster frame.
How the Mann-Whitney U Test Works With Real Data
Consider recovery scores for Treatment A: 8, 9, 10, 12, 13, 15, and Treatment B: 14, 16, 18, 19, 21, 23. After pooling and ranking all 12 observations, Treatment A receives ranks 1, 2, 3, 4, 5, and 7, so its rank sum is 22.
With six observations in each group, U for Treatment A is 22 − 6(7)/2 = 1. The complementary value is 36 − 1 = 35, and the smaller value is reported as U = 1. A two-sided exact calculation gives p ≈ .0043, indicating a clear rank separation in this example.
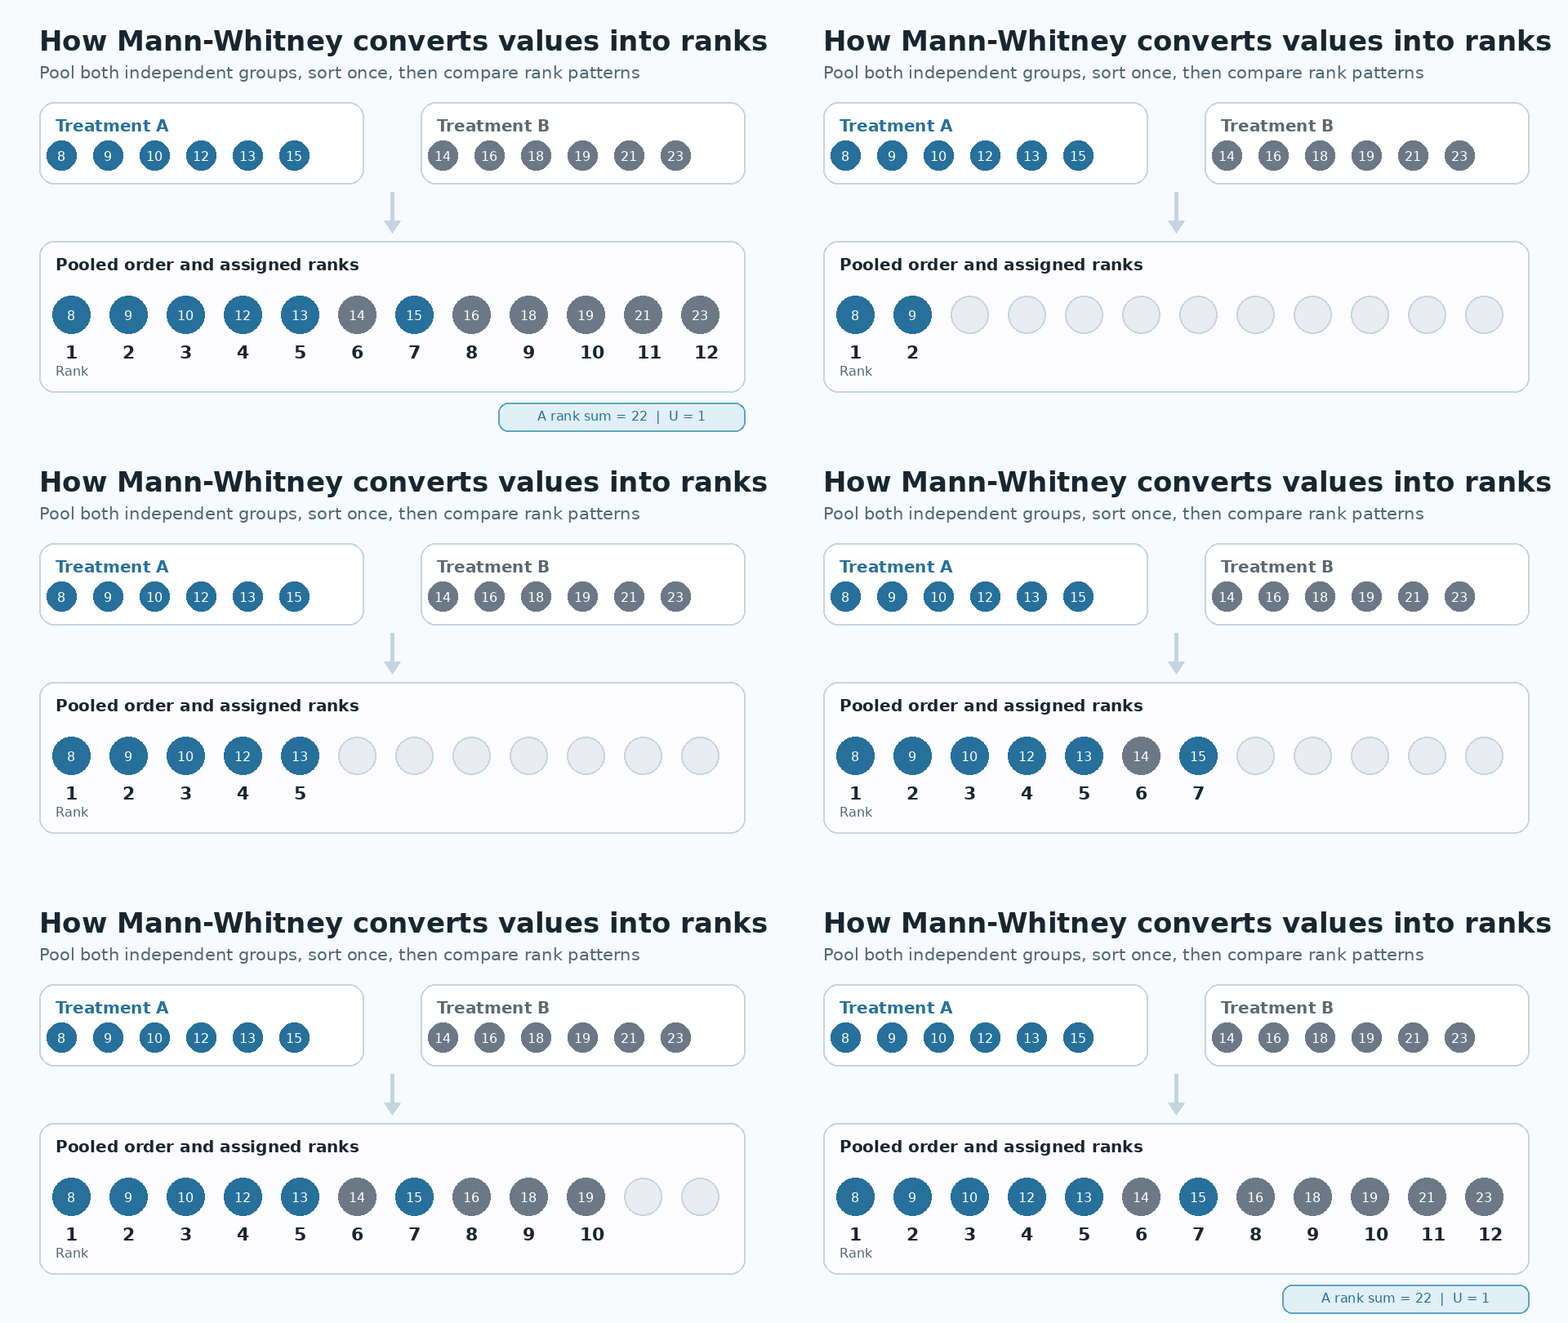
Animation 2. Pooling observations, assigning ranks, and deriving U in the worked example.
How to Perform a Mann-Whitney U Test Step by Step
First, define the directional or two-sided hypothesis. Confirm two independent groups and a rankable outcome. Plot the data, inspect shapes and ties, pool and rank observations, calculate rank sums, and derive the complementary U values.
Choose the inference method deliberately. Small samples without ties may support an exact calculation; larger samples commonly use a tie-corrected normal approximation. With small tied samples, permutation inference can be more defensible.
| Calculation fact: The two group-specific U statistics always sum to n₁ × n₂. |
|---|
Calculate your result: Use our Statistics Calculator — dataclue to enter two independent samples and calculate U, p-value, rank sums, and effect size.
Mann-Whitney U Test Example With Interpretation
In the recovery example, U = 1 and p ≈ .0043. A defensible conclusion is: recovery scores tended to be lower under Treatment A than Treatment B. Whether lower is clinically better must be established by the measurement scale and research context.
From what I’ve seen in manuscripts, the statistical sentence is often stronger than the design permits. A significant U test does not establish causality, prove complete group separation, or identify which feature of unequal shapes produced the result.
Mann-Whitney U Test vs Independent-Samples t-Test
The t-test and Mann-Whitney U test are not interchangeable versions of the same question. The independent-samples t-test targets a difference in means. Mann-Whitney is rank based and can address distributional ordering, with a location interpretation available under additional shape assumptions.
In real use, the better test depends on the outcome scale, research question, sample design, distribution behavior, and desired interpretation. Running both tests and reporting whichever becomes significant is a hidden form of outcome-driven analysis and should be avoided.
| Reporting rule: Report group summaries, U, p, the inference method, and a rank-based effect size. |
|---|
SPSS vs R vs Python for the Mann-Whitney U Test
SPSS suits menu-driven workflows; R supports transparent, reproducible analysis; and Python’s SciPy integrates with notebooks and automated pipelines. Each is valid when settings and interpretation are documented.
Software defaults can differ. SciPy 1.18 recommends its exact method when there are no ties and either sample is smaller than eight; it suggests a permutation method for small samples with ties.[2] Current R development documentation uses exact inference by default below 50 finite observations and can perform conditional inference with ties.[3]
| Software fact: Exact, asymptotic, and permutation settings can produce different p-values from the same data. |
|---|
Common Misconceptions About the Mann-Whitney U Test
It is not automatically a median test, restricted to continuous data, or required for every non-normal sample. It is inappropriate for matched pairs or repeated measurements, which call for a paired method such as the Wilcoxon signed-rank test.
What practitioners often do is accept the software label and default p-value without checking what was computed. Better practice records the alternative hypothesis, exact or asymptotic method, tie handling, continuity correction, software version, and effect-size definition.
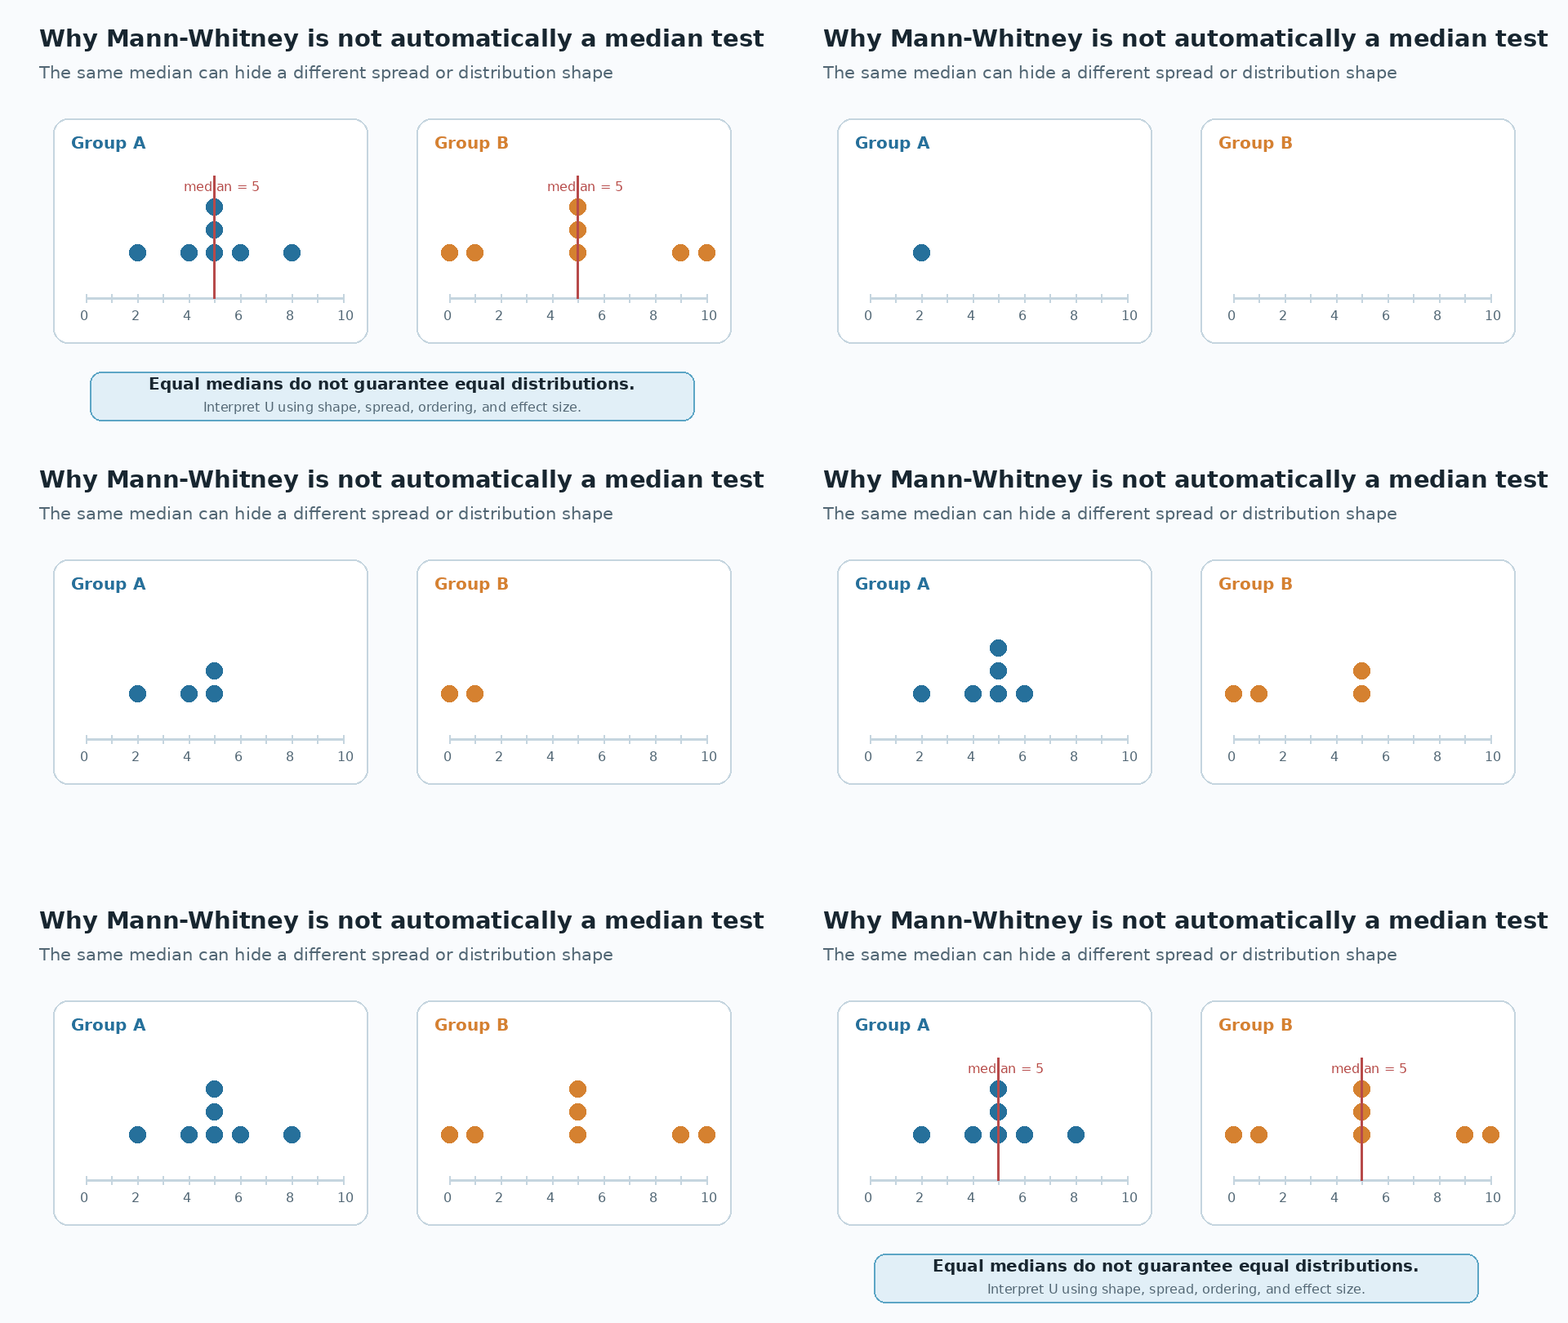
Animation 3. Equal medians can coexist with different distribution shapes, so interpretation must go beyond the median.
Top Mann-Whitney U Test Mistakes and Statistical Risks
Risks include treating dependent observations as independent, ignoring unequal shapes, selecting a one-sided test after seeing the data, overlooking ties, and reporting only p. Non-significance is not proof of equivalence and may reflect low power.
A long-term reporting problem appears when researchers preserve only screenshots. Save syntax, code, data-cleaning decisions, and software versions so the analysis can be reproduced. AI-generated code should be validated against a manual rank check or a second implementation before publication.
| Risk signal: Non-significance is not evidence of equivalence unless the study was designed for that claim. |
|---|
Advanced Mann-Whitney U Test Interpretation: What Textbooks Often Miss
The reality layer is that significance may reflect location, spread, shape, or their combination. A plot is part of the analysis, not decoration. Probability of superiority and rank-biserial correlation communicate magnitude and direction.
The contrarian insight is that “nonparametric” does not mean assumption-free or automatically robust. Mann-Whitney replaces some distributional assumptions with design and interpretation requirements that are easier to overlook. It may answer the wrong question perfectly if the estimand was never defined.
Real-World Uses of the Mann-Whitney U Test Across Research Fields
The method is used across healthcare, psychology, education, economics, epidemiology, and product experimentation for outcomes such as symptoms, reaction times, achievement, customer scores, biomarkers, and skewed metrics.
The strongest applications align the scientific question, data-generating process, estimand, computation method, visual evidence, and reporting language. That alignment matters more than the software brand or whether the test is labeled “distribution-free.”
Mann-Whitney U Test Summary, Reporting Template, and Next Steps
Use the Mann-Whitney U test for two independent groups when the outcome is rankable and the research question concerns ordering or a defensible location shift. Check independence, group shapes, ties, the chosen inference method, and practical magnitude before writing the conclusion.
A concise reporting template is: “Scores were lower in Treatment A than Treatment B. A two-sided Mann-Whitney U test indicated a statistically significant difference, U = 1, p = .004; group summaries and a rank-based effect size were also examined.” The next step is to align the hypothesis, estimand, software method, effect size, and substantive decision.
FAQs
Is the Mann-Whitney U test really a test of medians?
No. It tests rank-based distributional differences, and a median or location interpretation is justified only when the group distributions have similar shapes.
Should I avoid this?
Yes, when observations are paired, the outcome cannot be meaningfully ranked, or your scientific question specifically targets means. Avoid it also when you cannot explain what a significant result means under unequal distribution shapes.
Can unequal spread create a significant Mann-Whitney result?
Yes. A significant result can reflect differences in spread or shape as well as location, which is why distribution plots should be reviewed before claiming a median difference.
Is Mann-Whitney automatically safer than a t-test for non-normal data?
No. Mild non-normality does not automatically invalidate Welch’s t-test, and Mann-Whitney may answer a different question. Select the method according to the estimand, scale, design, and robustness needs.
Can AI agents choose and interpret the test without review?
No. AI agents can generate code and summarize output, but they may miss dependence, ties, software defaults, or an unclear estimand. Human verification is required for defensible long-term use and reproducibility.
References
[1] IBM SPSS Statistics 32, “Two-Independent-Samples Tests.”
[2] SciPy 1.18.0 Manual, scipy.stats.mannwhitneyu.
[3] R Development Manual, stats::wilcox.test.
Content strategy note: The keyword, entity, topical-map, and search-journey framework supplied for this project guided the article structure and integration choices.