
McNemar Test: How It Works, When to Use It & Examples
A practical guide to recognizing paired binary data, understanding discordant pairs, choosing the test version, running the analysis, and reporting the result correctly.
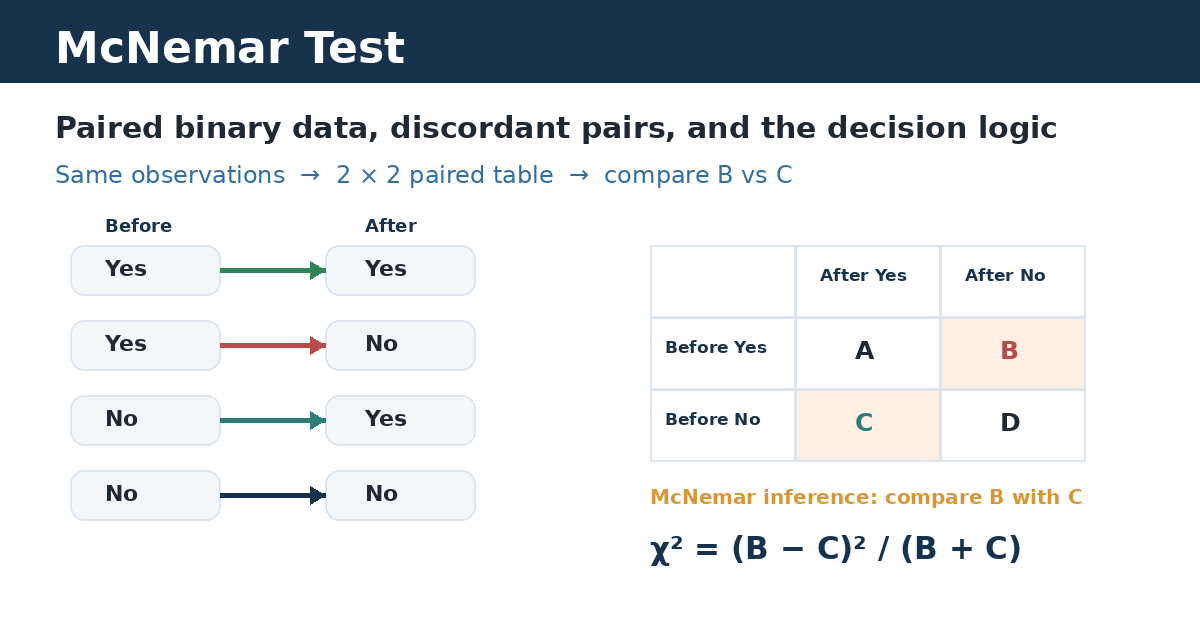
McNemar’s test is used when the same people, items, or matched pairs produce two binary outcomes and you want to know whether the probability of change differs between the two directions. In practical terms, it is the test for questions such as “Did the proportion of Yes responses change after an intervention?” when each person is measured twice. The McNemar test is not for two independent groups; its logic depends on the pairing.[1][2]
The key idea is simpler than the formula: McNemar’s test is a test of directional disagreement in paired binary data. It concentrates on the observations that switch categories, compares the two possible directions of switching, and then evaluates whether that imbalance is larger than expected under the null hypothesis. Understanding that structure helps you choose the right test, select an exact or approximate procedure sensibly, and interpret more than a p-value.[1][3]
What Is the McNemar Test in Simple Terms?
What question does the McNemar test answer?
The test asks whether the two possible directions of change occur with the same probability. If a binary response is coded No/Yes, one discordant group changes from No to Yes and the other changes from Yes to No. Under the usual null hypothesis, those two directional probabilities are equal. A large imbalance between them is evidence that the paired marginal proportion changed between the two conditions.[1]
Why is McNemar’s test considered a non-parametric test?
McNemar’s test is commonly grouped with non-parametric procedures because it does not compare means and does not require a normally distributed continuous outcome. It works with categorical counts. “Non-parametric,” however, does not mean assumption-free: the data must still have the correct binary paired structure, and different pairs should be independent of one another for the ordinary formulation.[1][4]
What type of data does the McNemar test analyze?
The standard 2 × 2 McNemar test analyzes two related binary variables. Examples include pass/fail before and after training, symptom present/absent before and after treatment, or correct/incorrect predictions from two classifiers on the same cases. Each observational unit therefore contributes a pair such as Yes/Yes, Yes/No, No/Yes, or No/No. That paired cross-classification is what separates McNemar from an ordinary chi-square test of independence.[1]
When Should You Use the McNemar Test?
Pre-test vs. post-test studies
Use McNemar when a pre-test and post-test outcome is genuinely binary and the same participants contribute both measurements. A common example is pass versus fail before and after an educational intervention. The phrase “pre-test/post-test” alone is not enough: if the score is continuous, a paired t-test or another paired continuous-data method is more appropriate. McNemar applies because the response categories, not the measurement times, define the data type.
Before-and-after treatment comparisons
A before-and-after clinical or behavioral study can use McNemar when each participant is classified into one of two states at both times. The test evaluates whether the paired proportion changes, not whether a treatment caused the change. Causal language requires a study design that supports causal inference, such as an appropriate randomized design with control of relevant biases; the McNemar p-value alone does not establish treatment effectiveness.
Matched-pair and case-control studies
McNemar also fits matched-pair designs in which two different people or units are deliberately paired and each has a binary response. In a 1:1 matched case-control setting, for example, the evidence about association comes from pairs that differ in exposure status. The matching must be meaningful and each matched pair should be independent of other pairs. An unmatched case-control table requires a different analysis strategy.
Comparing two machine-learning models on the same observations
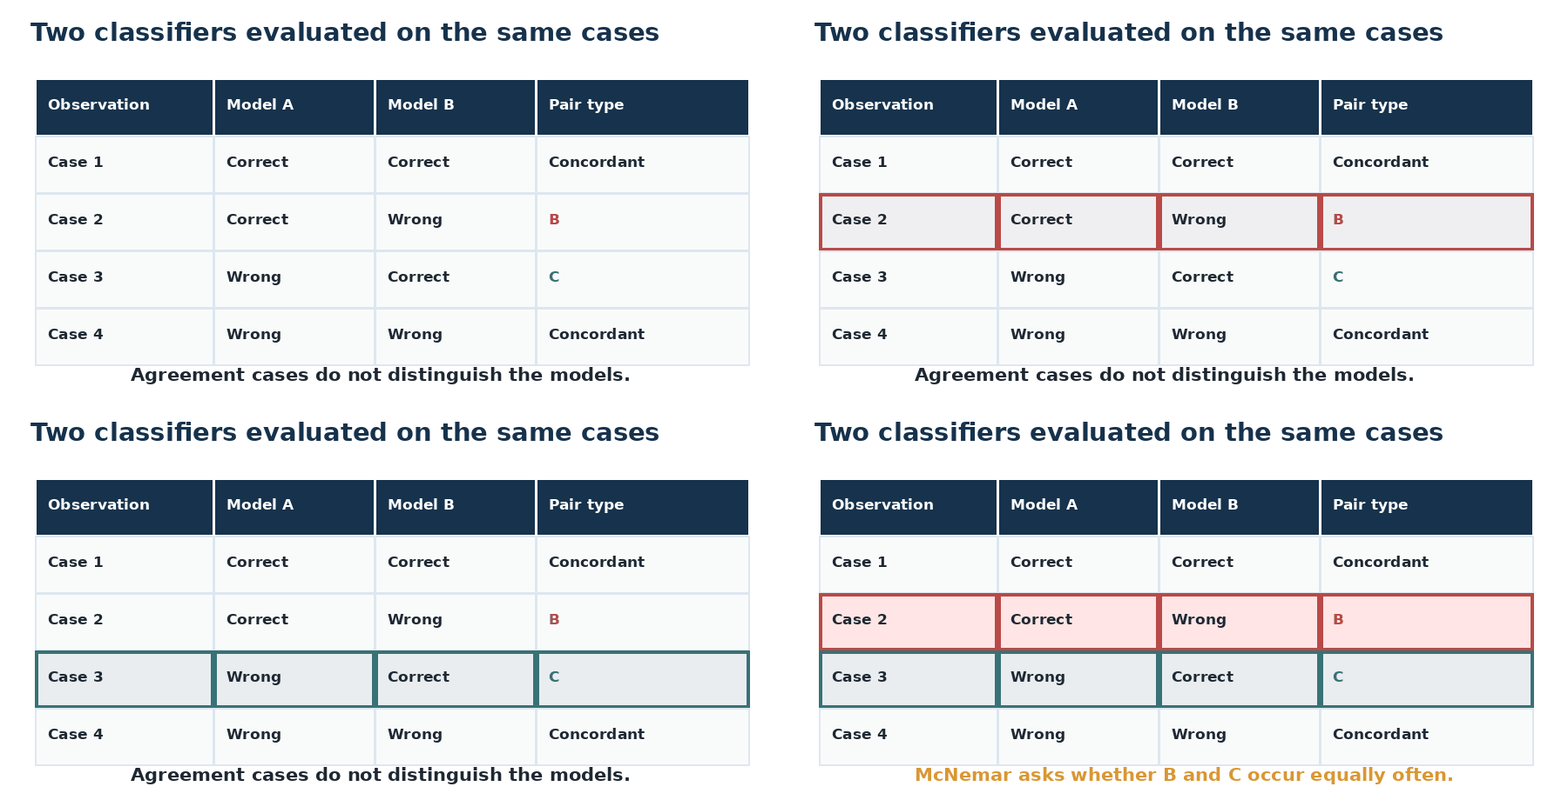
For two classifiers evaluated on the same test cases, code each model’s result on each case as correct or incorrect. McNemar then compares the count of cases where Model A alone is correct with the count where Model B alone is correct. This is a paired comparison because both models are judged on the same observations. It does not automatically prove that one learning algorithm is superior across new training samples, resamples, datasets, or tasks; that broader claim needs a design that represents those sources of variation.[8]
When McNemar’s test is not appropriate
Do not use the standard McNemar test when the two groups are independent, when the outcome has more than two categories, when there are more than two related binary conditions, or when the response is continuous. IBM’s related-samples guidance distinguishes McNemar for two binary fields, Cochran’s Q for more than two related binary fields, and marginal-homogeneity procedures for paired multinomial outcomes.[4]
McNemar Test Assumptions and Data Requirements
Requirement 1: The outcome must be binary
Each of the two measurements must reduce to two mutually exclusive outcome categories for the standard 2 × 2 test. Common codings are 0/1, No/Yes, Negative/Positive, or Incorrect/Correct. If a five-level rating is collapsed to two levels, that recoding changes the question and can discard information, so the threshold should be substantively defensible rather than chosen merely to make McNemar available.
Requirement 2: Observations must be paired or matched
The two responses in a row must belong together: the same person at two times, the same item under two methods, or an explicitly matched pair. This dependence within a pair is the reason ordinary independent-sample methods are not the default. If baseline and follow-up records cannot be linked reliably, or if the matching is broken, the table no longer represents the study design McNemar assumes.
Requirement 3: Categories must be mutually exclusive
At each measurement, an observation should fall into one and only one of the two categories. A participant cannot simultaneously be counted as both Yes and No in the same condition. If multiple labels can coexist, first define a binary endpoint that reflects the actual research question or choose a method designed for multi-label or multinomial outcomes.
Requirement 4: Pairs should be independent of other pairs
Dependence is expected within each pair but not normally across pairs. For example, one participant’s before/after response should not be statistically tied to another participant’s response through unmodeled clustering such as household, classroom, clinic, or repeated observations beyond the two measurements. NIST explicitly lists mutual independence of the pairs as an assumption of its McNemar formulation.[1]
Why the study design matters more than the total sample size
A dataset can contain thousands of participants yet provide little information for McNemar if almost everyone gives the same response twice. The inferential evidence is concentrated in the discordant pairs, so the count B + C matters directly. A large total N therefore does not rescue a design with very few changers. Missing follow-up data also cannot be treated as an observed category; ordinary complete-pair McNemar analysis requires both responses for the pair.
How the 2 × 2 McNemar Contingency Table Works
Understanding concordant and discordant pairs
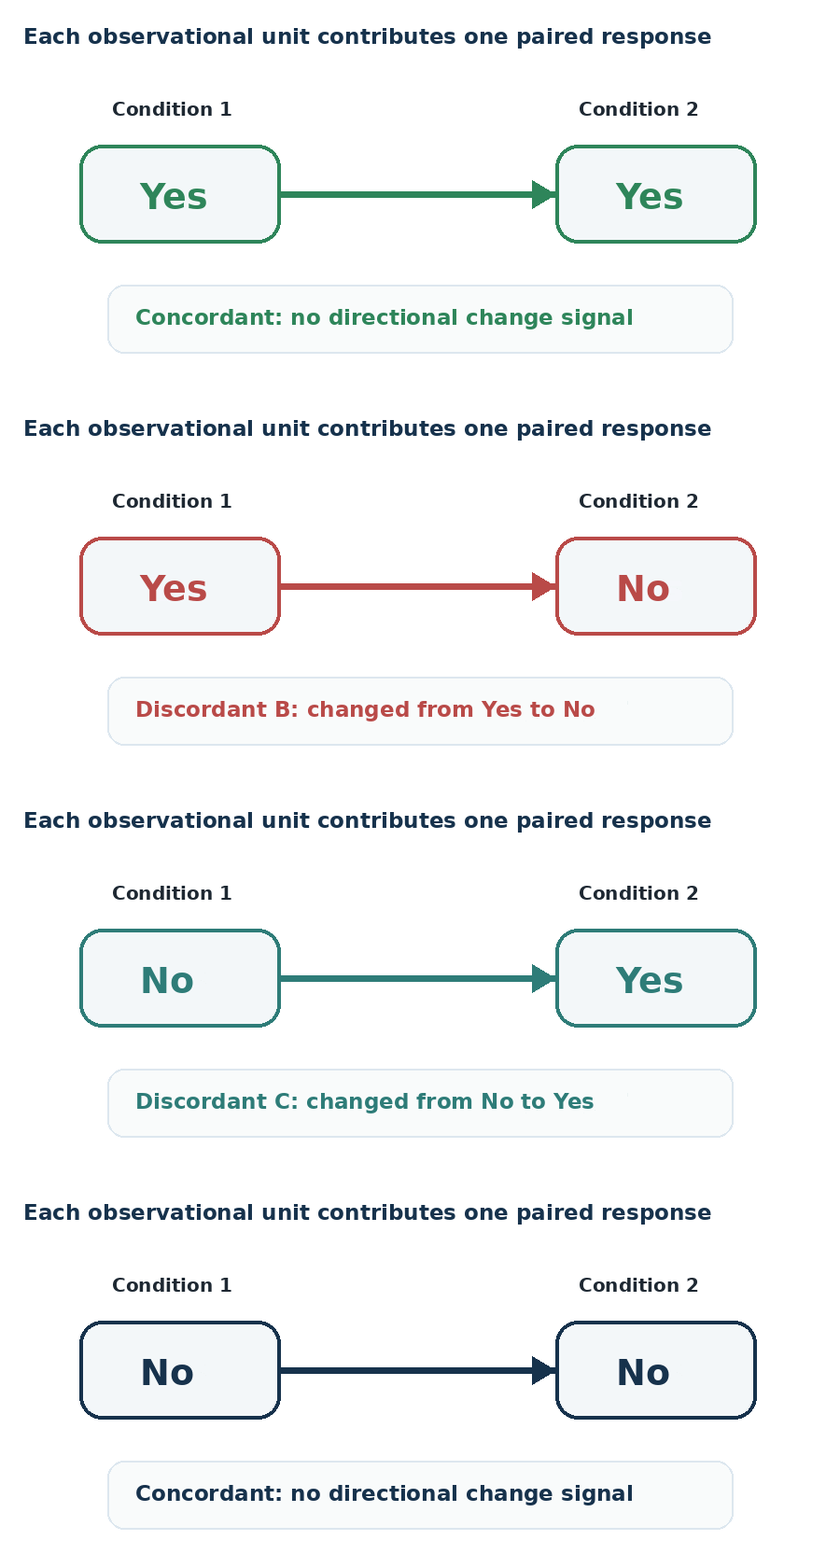
A pair is concordant when the two measurements agree and discordant when they disagree. Yes/Yes and No/No are concordant. Yes/No and No/Yes are discordant. McNemar’s test focuses on discordance because only those observations distinguish the direction of change. This is the conceptual bridge between the study design and the test statistic.
What do A, B, C, and D represent?
Using rows for Condition 1 and columns for Condition 2, A is Yes/Yes, B is Yes/No, C is No/Yes, and D is No/No. Letter conventions vary across textbooks and software, so never rely on a letter without checking the row and column labels. What matters is identifying the two off-diagonal cells that represent opposite directions of change.
| Condition 1 | Condition 2: Yes | Condition 2: No |
|---|---|---|
| Yes | A: Yes → Yes | B: Yes → No |
| No | C: No → Yes | D: No → No |
Why McNemar’s test focuses on B and C
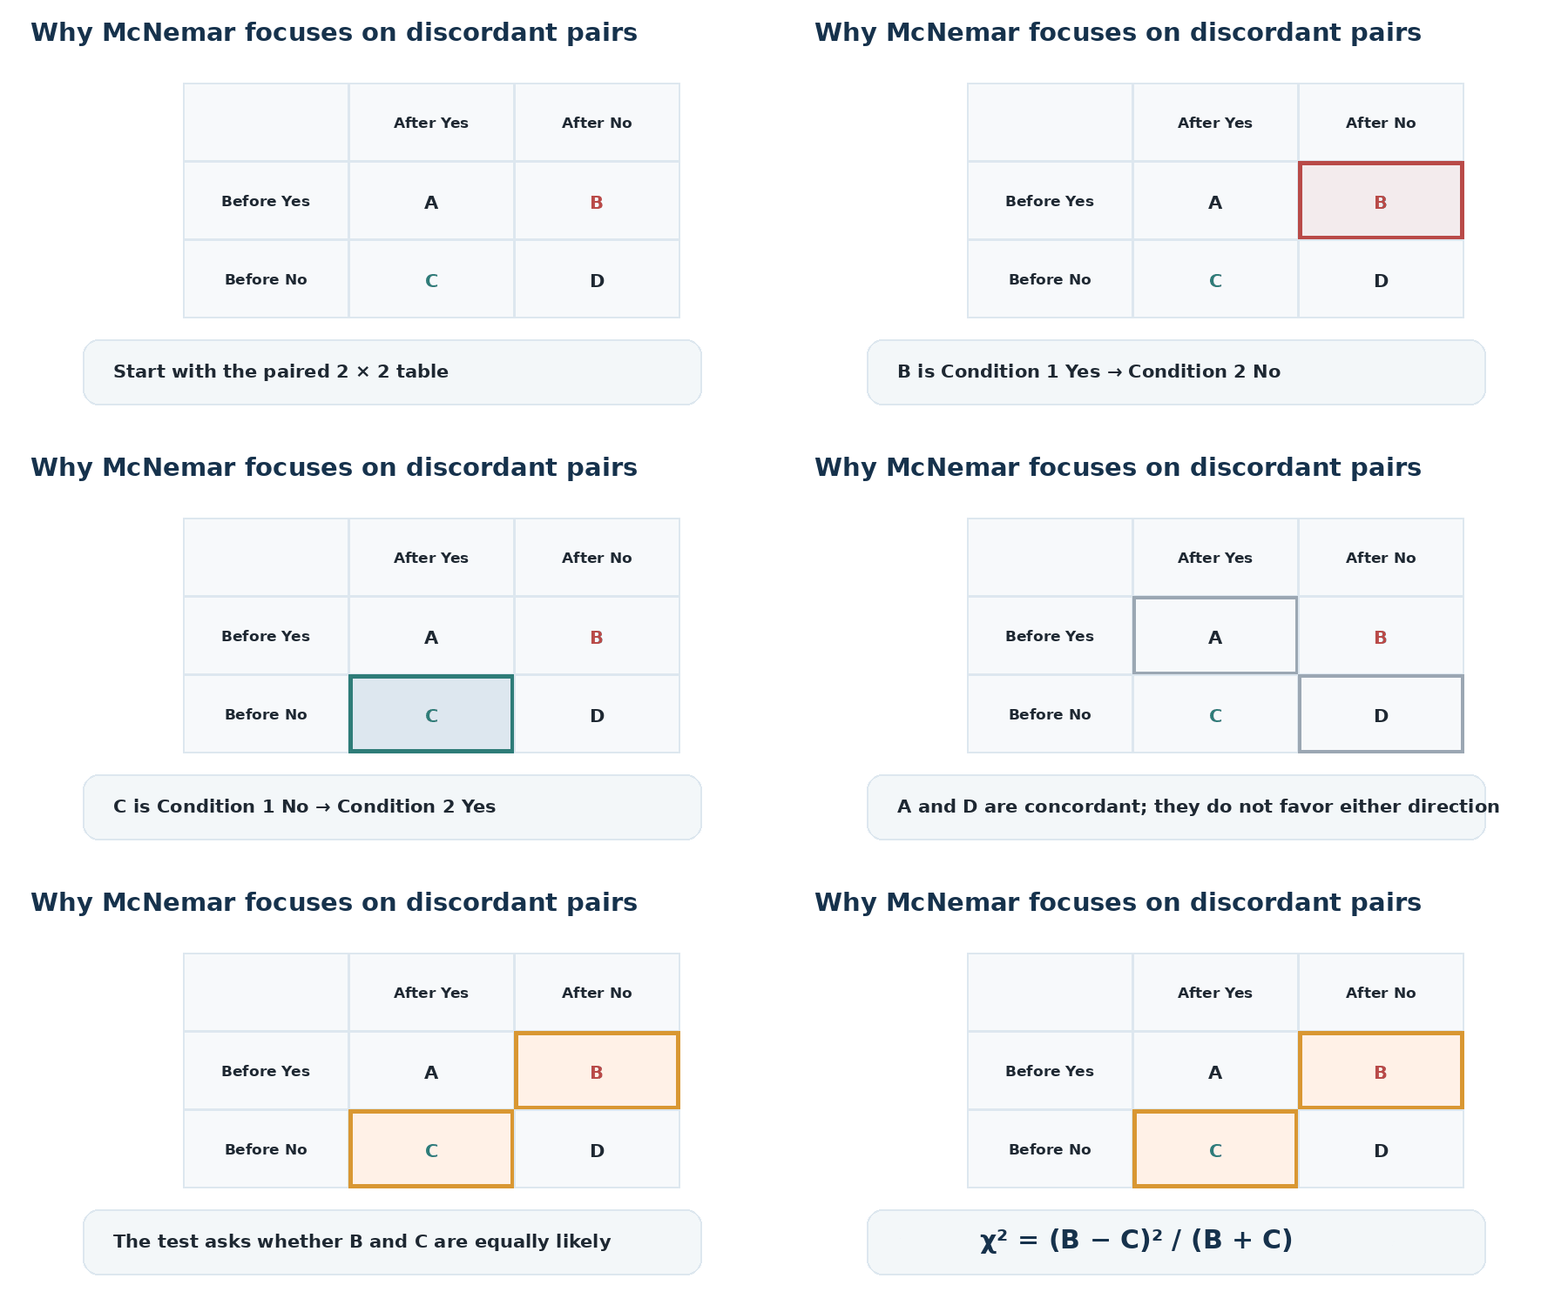
B and C are the only cells in which the two conditions disagree. If the marginal Yes proportion is genuinely the same in both conditions, the expected directional switching is symmetric: Yes→No and No→Yes should be equally likely under the null. The standard statistic therefore measures the squared difference between B and C relative to their total.[1]
Why A and D do not determine the test statistic
A and D can be important descriptively because they show stability, but they do not favor one direction of change over the other. Adding 1,000 extra Yes/Yes observations increases total sample size without changing B, C, or the ordinary McNemar statistic. This is why reporting only overall N can be misleading: the amount of disagreement often matters more for the test than the number of concordant pairs.
What Does the McNemar Test Actually Test?
The null hypothesis in McNemar’s test
For the 2 × 2 paired table, the null hypothesis is that the probability of a Condition 1 No/Condition 2 Yes pair equals the probability of a Condition 1 Yes/Condition 2 No pair. In symbols, H₀: p₀₁ = p₁₀, with the exact subscripts depending on coding. This is more precise than saying “the means are equal” or that observed row totals must literally equal column totals.[1]
The alternative hypothesis
For the usual two-sided test, the alternative is that the two discordant probabilities differ: H₁: p₀₁ ≠ p₁₀. A one-sided scientific question is possible in principle, but it should be specified before examining the data and implemented with an appropriate one-sided procedure. Many software defaults report two-sided inference, so the reporting must match the analysis actually performed.
Understanding marginal homogeneity
In the binary 2 × 2 setting, equality of the two directional discordance probabilities corresponds to equality of the paired marginal proportions. This is why McNemar is often described as a test of marginal homogeneity. The margins are population quantities under the hypothesis; the observed row and column totals do not need to be exactly equal before the test can be run.[1][6]
What a significant result really means
A statistically significant result provides evidence that the two directions of discordance are not equally common, which implies a difference in the paired marginal proportions. It does not tell you that the difference is large, clinically important, educationally meaningful, profitable, or causal. Those conclusions require the observed proportions, effect magnitude, uncertainty, and the design context in addition to the p-value.
McNemar Test Formula and Test Statistic
Standard McNemar chi-square formula
For a 2 × 2 table with discordant counts B and C, the familiar large-sample statistic is:
Under the null and an adequate approximation, this statistic is compared with a chi-square distribution with one degree of freedom. Because only B and C appear, the formula makes the data structure explicit: concordant pairs do not drive the test statistic.[1]
How to calculate the test statistic step by step
Identify the two discordant cells first. Subtract one from the other, square the difference so direction does not make the statistic negative, and divide by the total number of discordant pairs. Then obtain the p-value from the chosen reference distribution or software. Direction is recovered separately by comparing B with C; the chi-square statistic itself is nonnegative and does not indicate which condition has the higher proportion.
Degrees of freedom in McNemar’s test
The ordinary 2 × 2 asymptotic McNemar statistic uses one degree of freedom. Conceptually, once the total number of discordant pairs B + C is fixed, there is one free component describing how those discordant pairs split between the two directions. Software may report a chi-square statistic or an equivalent Z-form in some procedures, so focus on the stated method and p-value rather than the label alone.[5][6]
Continuity-corrected McNemar test
A traditional continuity-corrected form subtracts 1 from the absolute difference before squaring:
NIST documents this form. The correction generally increases the p-value relative to the uncorrected asymptotic statistic. It should not be treated as automatically superior: methodological evaluations have found that continuity correction can be conservative, so the choice should follow a justified analysis plan or domain standard rather than habit.[1][3]
Exact McNemar test for small numbers of discordant pairs
Conditional on B + C discordant pairs and under H₀, one direction can be modeled with a Binomial(B + C, 0.5) distribution. That gives the conventional exact conditional McNemar test. NIST uses an exact/binomial procedure for smaller discordant counts in its implementation, while modern methodological work shows an important trade-off: exact conditional inference controls type I error conservatively but can lose power, whereas mid-p and uncorrected asymptotic approaches may be less conservative.[1][3]
The practical lesson is not “always use exact below 25.” There is no universal cutoff that replaces statistical judgment. Pay attention to B + C, the analysis plan, software behavior, and the standards of your field. If results near a decision threshold depend strongly on the method, report that sensitivity instead of hiding it.
Step-by-Step McNemar Test Example
Step 1: Organize the paired observations
Suppose 100 participants answer a binary question before and after a program. Fifty answer Yes before the program and 66 answer Yes after it. Because each participant has both measurements, the data must be paired person by person before being summarized; two separate percentages are not enough to reconstruct the McNemar table.
Step 2: Create the 2 × 2 contingency table
Assume the paired counts are 38 Yes/Yes, 12 Yes/No, 28 No/Yes, and 22 No/No. The table below preserves the direction of every participant’s response change.
| Before | After: Yes | After: No | Row total |
|---|---|---|---|
| Yes | 38 (A) | 12 (B) | 50 |
| No | 28 (C) | 22 (D) | 50 |
| Column total | 66 | 34 | 100 |
Step 3: Identify the discordant pairs
The discordant counts are B = 12 and C = 28. Twelve participants changed from Yes to No, while 28 changed from No to Yes. The net paired change in the Yes proportion is therefore (28 − 12) / 100 = 0.16, or 16 percentage points. That descriptive effect is distinct from the hypothesis test and should be reported alongside it.
Step 4: Calculate the McNemar test statistic
Using the uncorrected asymptotic formula, χ² = (12 − 28)² / (12 + 28) = 256 / 40 = 6.40. The statistic has one degree of freedom under the usual large-sample approximation. The calculation shows exactly why the 60 concordant participants do not change the statistic: only the 40 discordant participants determine the numerator and denominator.
Step 5: Find and interpret the p-value
For χ² = 6.40 with 1 degree of freedom, the two-sided asymptotic p-value is approximately 0.011. The continuity-corrected statistic is 5.625 with p ≈ 0.018, while the conventional exact two-sided binomial p-value for 12 versus 28 discordant pairs is approximately 0.0166. All three are below 0.05 in this example, although they are not numerically identical.
Step 6: Write the statistical conclusion
A clear conclusion is: “The paired Yes proportion increased from 50% before the program to 66% after it. The directional discordance was 12 Yes→No versus 28 No→Yes pairs, and an uncorrected McNemar test indicated a difference in the paired marginal proportions, χ²(1) = 6.40, p = .011.” If the study is observational or uncontrolled, stop short of saying the program caused the increase.
How to Interpret McNemar Test Results
What does p < 0.05 mean?
If 0.05 was the pre-specified significance level, p < 0.05 means the observed imbalance in the discordant directions would be sufficiently unusual under the null model to reject H₀ at that level. It is evidence against equality of the directional discordance probabilities, not the probability that the null hypothesis is false and not a measure of effect size.
What does p ≥ 0.05 mean?
A p-value at or above the chosen alpha means the data do not provide enough evidence to reject the null with that procedure. It does not prove “no difference.” Sparse discordance, low power, noisy measurement, or a genuinely small effect can all produce a non-significant result. Report the observed proportions and B/C counts so readers can distinguish lack of evidence from evidence of exact equality.
Statistical significance vs. practical significance
Statistical significance concerns compatibility with a null model; practical significance concerns whether the size of the change matters in context. A two-percentage-point increase may be important in a high-stakes public-health setting and trivial in another setting. Conversely, a visibly large difference may remain statistically uncertain if few pairs are discordant. The decision layer therefore needs both inference and effect description.
How the direction of change is determined
Look at the two discordant cells, not the sign of χ². With the orientation used here, C is No→Yes and B is Yes→No. If C > B, the Yes proportion rises from Condition 1 to Condition 2; if B > C, it falls. Always state the coding because reversing row/column labels reverses the verbal direction even though the two-sided p-value remains the same.
How to report McNemar’s test in research
A strong report includes the paired sample size, the two marginal proportions, B and C or an equivalent paired table, the exact test version used, the statistic when applicable, degrees of freedom for asymptotic χ², the p-value, and an effect estimate or confidence interval when useful. Confidence intervals for paired proportion differences provide information the p-value cannot, particularly about the plausible magnitude of change.[9]
How to Perform the McNemar Test in SPSS
Preparing paired binary data in SPSS
Store one row per observational unit and use two variables for the paired measurements, such as before and after. Each variable should have two well-defined categories. Preserve missing values rather than inventing a category for missing follow-up. Before testing, run a cross-tabulation or frequency check so you can verify the coding and see the four paired cells.
Step-by-step SPSS procedure
In current IBM SPSS Statistics documentation, one route is Analyze → Compare Means → Paired-Samples Proportions, where the Tests dialog can request exact binomial, mid-p adjusted binomial, McNemar, and continuity-corrected McNemar statistics. IBM also documents McNemar under related-samples nonparametric testing, and the Legacy Dialogs route remains available as Analyze → Nonparametric Tests → Legacy Dialogs → 2 Related Samples.[4][5]
Where to find the McNemar significance value
In the output, locate the row or test panel labeled for McNemar and read the associated significance or p-value. The exact label can differ by SPSS procedure and version because the Paired-Samples Proportions workflow can display several inferential methods at once. Record the method as well as the number; “p = .03” is incomplete if the reader cannot tell whether it came from asymptotic, corrected, exact, or mid-p inference.[5]
How to interpret SPSS output
First verify the paired table and coding, then interpret the p-value against your pre-specified alpha. Next compare the two discordant directions to determine where the change went, and compare the before/after marginal proportions to describe its magnitude. If multiple McNemar variants are displayed, do not choose whichever one crosses 0.05 after seeing the results; use the method justified by the analysis plan.
Example of reporting McNemar results from SPSS
A software-neutral report is usually safer than copying every output label: “Among 100 complete pairs, the positive response increased from 50% to 66%. Discordant responses were 12 positive→negative and 28 negative→positive. McNemar’s test was statistically significant, χ²(1) = 6.40, p = .011.” If SPSS output used an exact or mid-p procedure instead, replace the statistic and p-value with that method and name it explicitly.
How to Run McNemar’s Test in Python and R
McNemar test in Python with Statsmodels
Statsmodels provides statsmodels.stats.contingency_tables.mcnemar. The function accepts a 2 × 2 table and can use either an exact binomial calculation or the chi-square approximation. For the worked example:
from statsmodels.stats.contingency_tables import mcnemar

table = [[38, 12],
         [28, 22]]

result = mcnemar(table, exact=False, correction=False)
print(result.statistic)  # 6.4
print(result.pvalue)     # about 0.0114
The documented default is exact=True; when exact=False, the function uses the chi-square approximation, and correction=True applies continuity correction in that approximate mode.[7]
Choosing exact, corrected, or asymptotic testing in Python
Make the choice deliberately. mcnemar(table, exact=True) uses the binomial distribution in Statsmodels. exact=False, correction=False gives the uncorrected asymptotic statistic, while exact=False, correction=True applies continuity correction. If your field prefers a mid-p method, calculate it with an appropriate validated implementation rather than labeling Statsmodels’ exact result as mid-p; they are different procedures.[3][7]
McNemar test in R with mcnemar.test()
Base R provides mcnemar.test() in the stats package. Its documented function is a chi-squared McNemar test and uses continuity correction by default in the 2 × 2 case. For the worked example:
tab <- matrix(c(38, 12,
                28, 22),
              nrow = 2, byrow = TRUE)

mcnemar.test(tab, correct = FALSE)
mcnemar.test(tab, correct = TRUE)
The official R documentation describes correct as controlling continuity correction and does not present mcnemar.test() as an exact-test switch. If you need the conventional exact conditional version in base R, the discordant counts can be analyzed with binom.test() under p = 0.5, provided the two-sided definition matches your protocol.[6]
How to interpret software-generated statistics and p-values
Software removes arithmetic burden, not design responsibility. Confirm that the table orientation is correct, the data are truly paired, the displayed method matches the one you intended, and missing pairs were handled as planned. Then report the method, B/C direction, marginal proportions, and p-value together. Different software defaults can produce different p-values from the same table when correction or exactness settings differ.
Practical Uses of the McNemar Test
Medical and clinical research
McNemar is useful for paired binary endpoints such as symptom present/absent, responder/non-responder, or positive/negative status measured on the same patient under two conditions. The major practical limitation is interpretive: a significant paired change does not by itself prove a treatment is clinically effective or causal. Study design, endpoint validity, effect magnitude, adverse outcomes, and uncertainty remain part of the clinical conclusion.
Psychology and behavioral studies
Behavioral research often turns responses into binary states such as behavior observed/not observed, criterion met/not met, or attitude category A/B. McNemar can evaluate paired changes when that dichotomy is meaningful. If the original scale is ordinal or continuous, automatic dichotomization can reduce information and power; keeping the richer measurement and choosing an appropriate paired method may be better.
Education and pre-test/post-test research
For pass/fail, mastered/not mastered, or correct/incorrect outcomes collected from the same students before and after instruction, McNemar directly answers whether the paired proportion changed. It does not test the mean change in a numeric exam score. Classroom clustering can also matter: if many students are nested within classes and class-level effects are important, a simple independent-pairs assumption may be too optimistic.
Machine-learning model comparison
For a fixed test set, create a 2 × 2 table from whether each model is correct or wrong on each case. Cases both models get right and both get wrong are concordant; cases where only one model is correct are discordant. McNemar tests the symmetry of those one-model-only wins. That is more informative than comparing two headline accuracies alone, but broader algorithm comparison across training randomness or datasets needs a resampling or multi-dataset design.[8]
Diagnostic test evaluation
Two diagnostic methods applied to the same patients create paired binary results, so McNemar can compare paired proportions in suitable questions. But “different positivity rates” is not automatically “different diagnostic accuracy.” When a gold standard exists, sensitivity comparisons should be made among truly diseased subjects and specificity comparisons among truly non-diseased subjects, with the paired structure preserved. Diagnostic performance usually needs more than one summary statistic.
Marketing and paired-response studies
In marketing research, the same customers may answer Yes/No before and after seeing a message, or two methods may classify the same leads into binary outcomes. McNemar can test a paired proportion shift, but practical decisions should also consider absolute change, commercial value, sample selection, repeated exposure, and whether the observed sample represents the audience to which the decision will be applied.
McNemar Test vs. Other Statistical Tests
McNemar test vs. Chi-square test of independence
The ordinary Pearson chi-square test of independence assumes independent observations in the cells. McNemar is designed for paired binary observations, where the two measurements within a pair are dependent. Treating paired data as independent discards the matching and answers a different question. The easiest decision rule is structural: independent groups point toward independent-sample methods; the same or matched units measured twice point toward paired methods.
McNemar test vs. paired-samples t-test
A paired t-test analyzes a numeric difference score and asks about the mean of those within-pair differences. McNemar analyzes a binary categorical change pattern and asks whether the two discordant directions are equally likely. They can share the same before/after study design but operate on different outcome scales. Converting a continuous variable into pass/fail solely to use McNemar is usually a loss of information unless the threshold is substantively important.
McNemar test vs. Fisher’s exact test
Fisher’s exact test is classically used for a 2 × 2 table with independent groups when exact conditional inference is desired. It is not simply the small-sample replacement for McNemar. For paired binary data, the conventional exact McNemar procedure conditions on the total number of discordant pairs and uses a binomial distribution with probability 0.5 under the null. Pairing determines the test family before sample size does.[1][3]
McNemar test vs. Cochran’s Q test
Cochran’s Q extends the related-binary idea to more than two related conditions or time points. IBM’s current related-samples guidance applies McNemar to two categorical flag fields and Cochran’s Q to k related binary fields. If a three-time-point binary study is reduced to several pairwise McNemar tests, multiple-testing control and the loss of an overall test should be considered.[4]
Which test should you choose for paired categorical data?
Choose by study design and measurement scale, not by which formula looks familiar. The table below summarizes the first decision.
| Data structure | Typical question | More appropriate starting test |
|---|---|---|
| Two related binary measurements | Did the paired proportion change? | McNemar |
| More than two related binary measurements | Do related binary proportions differ across k conditions? | Cochran’s Q |
| Two related multinomial/ordinal classifications | Did paired category distribution/margins change? | Marginal-homogeneity or symmetry method |
| Two independent binary groups | Are independent proportions associated/different? | Pearson chi-square or an appropriate exact/independent-proportion method |
| Two related continuous measurements | Did the mean paired value change? | Paired t-test when its assumptions fit |
| Two related ordinal/continuous measurements with non-normal difference concerns | Did paired ranks/locations change? | Wilcoxon signed-rank or another appropriate paired method |
Common McNemar Test Mistakes and Misinterpretations
Treating paired observations as independent
This is the most fundamental mistake. A before/after table from the same people contains within-person dependence. Running an ordinary chi-square independence test on pooled counts ignores that structure and can produce a different standard error and conclusion. Preserve the pair identifier until the 2 × 2 paired table has been constructed correctly.
Using the test for outcomes with more than two categories
Standard McNemar is a 2 × 2 procedure. If the response has three or more categories, the off-diagonal structure is more complex and a multinomial marginal-homogeneity or symmetry method may be needed. IBM explicitly describes its marginal-homogeneity test as an extension beyond the binary response setting.[4]
Looking at total percentages instead of discordant pairs
Before/after percentages are important descriptively but cannot replace the paired table. Two studies can have the same 10-point increase and very different B/C patterns. The McNemar p-value depends on how many individuals changed in each direction, so analysis based only on marginal totals throws away the information the test needs.
Using the asymptotic test when discordant counts are very small
A tiny B + C can make large-sample approximations questionable, but a mechanical cutoff is not a complete solution. Exact conditional, mid-p, continuity-corrected, and uncorrected asymptotic methods have different error and power behavior. Pre-specify a defensible method when possible, inspect the discordant count, and consider sensitivity if competing procedures produce materially different conclusions.[1][3]
Confusing statistical significance with treatment effectiveness
A significant McNemar result says the paired binary proportions differ beyond what the selected null model would predict at the chosen threshold. It does not quantify benefit, harm, cost, clinical importance, student learning value, customer value, or model deployment impact. Report the observed change and its context before making a decision claim.
Claiming causation from a statistically significant result
McNemar can detect paired change in an uncontrolled before/after study, but many explanations may exist for that change: time, selection, regression to the mean, measurement drift, co-interventions, or external events. Causal claims come from design and identification assumptions, not from the name of the statistical test or the size of the p-value.
FAQs
Is McNemar’s test parametric or non-parametric?
It is commonly categorized as a non-parametric test for paired nominal data because it does not assume normality of a continuous outcome or compare means. It still has a probability model and structural assumptions, especially binary responses, valid pairing, and independence between pairs, so “non-parametric” should not be interpreted as “no assumptions.”
What sample size is needed for McNemar’s test?
There is no universal minimum total sample size. Power depends strongly on how many pairs are expected to be discordant and how asymmetric the two discordant probabilities are. A study with N = 1,000 but only ten changers can be less informative for this question than a much smaller study with substantial discordance. Formal planning should therefore use expected paired cell probabilities, alpha, desired power, and the planned test version rather than a single N rule.
When should I use the exact McNemar test?
Exact conditional inference is most relevant when the discreteness of a small discordant count makes the asymptotic reference questionable, but “small” has no universally correct cutoff. Exact conditional McNemar can be conservative, and methodological work has found useful alternatives such as mid-p or uncorrected asymptotic inference under stated trade-offs. Follow your protocol, software documentation, and field guidance, and disclose the version used.[3]
Can McNemar’s test be used with three or more time points?
Not as one standard McNemar test. For a binary outcome measured at three or more related times, Cochran’s Q is a common overall test. Planned or post-hoc pairwise McNemar comparisons may then be considered with appropriate multiplicity control. For richer repeated-measures questions, generalized estimating equations or mixed-effects models may provide more flexible modeling.
Does McNemar’s test measure the strength of an association?
No. McNemar’s test is primarily a hypothesis test about paired marginal homogeneity or directional discordance. The p-value does not measure effect size. Depending on the scientific question, report the paired proportion difference, a confidence interval, the discordant-pair ratio/odds framing, or another interpretable effect measure in addition to the test.[9]
Can McNemar’s test compare two classifiers?
Yes, when both classifiers are evaluated on the same cases and each case is coded correct/incorrect for each model. The test compares cases where only Model A is correct with cases where only Model B is correct. It is best interpreted as a paired comparison on that evaluation design, not automatically as a universal statement about the algorithms across all possible training sets and datasets.[8]
What happens if B and C are equal?
If B = C, the uncorrected McNemar statistic is zero and there is no directional imbalance among the discordant pairs; the ordinary two-sided p-value is 1. If B = C = 0, all pairs are concordant and the asymptotic formula has a zero denominator. Some software will return an undefined statistic, while the substantive conclusion is that the observed data contain no discordant evidence of change. Report the table rather than forcing a meaningless calculation.
What is the difference between paired and independent binary data?
Paired binary data link two outcomes to the same observational unit or an explicit matched pair, so the measurements are dependent within that pair. Independent binary data come from separate units with no such matching. That distinction determines the analysis family: McNemar preserves the within-pair structure, whereas independent-proportion methods assume observations across groups are independent.
McNemar Test Quick Summary and Decision Guide
Use McNemar’s test when these conditions are met
Use the McNemar test when your research question concerns a difference between two related binary measurements, every analyzed unit supplies a valid pair, the two categories are mutually exclusive, and different pairs can reasonably be treated as independent. Build the 2 × 2 paired table first, verify B and C, and select the inferential version before interpreting the result.
Choose another statistical test when these conditions are not met
Choose an independent-sample method for unrelated groups, Cochran’s Q for more than two related binary conditions, a marginal-homogeneity or symmetry method for richer paired categorical outcomes, or an appropriate paired continuous/ordinal method when the response is not binary. If clustering, multiple repeated measurements, covariates, or missingness are central to the research question, a regression-based repeated-measures model may be more suitable than a simple 2 × 2 test.
Final checklist before running the analysis
Before pressing Run, confirm five things in plain language: the outcome is truly binary; the two measurements belong to the same subject or valid matched pair; every analyzed pair has both measurements; the table orientation makes B and C unambiguous; and the chosen exact, mid-p, corrected, or asymptotic procedure is justified in advance. After the test, report direction, magnitude, uncertainty, and study limitations rather than stopping at “significant” or “not significant.”
The main decision is therefore structural, not computational: the McNemar test is the right tool when change between two related binary measurements is the question. Its most important practical insight is that the discordant pairs carry the directional evidence. Choose the study design and test version carefully, then interpret the p-value together with the actual size and direction of change.
References
[1] NIST/SEMATECH Dataplot: McNemar Test Source.
[2] McNemar Q. Note on the sampling error of the difference between correlated proportions or percentages. Psychometrika. 1947;12:153-157. Source.
[3] Fagerland MW, Lydersen S, Laake P. The McNemar test for binary matched-pairs data: mid-p and asymptotic are better than exact conditional. BMC Med Res Methodol. 2013;13:91. Source.
[4] IBM SPSS Statistics 32: Choose Tests (Related-Samples Nonparametric Tests) Source.
[5] IBM SPSS Statistics 32: Paired-Samples Proportions - Tests Source.
[6] R stats 4.6.0: mcnemar.test documentation Source.
[7] statsmodels 0.15.0 development documentation: mcnemar Source.
[8] Dietterich TG. Approximate Statistical Tests for Comparing Supervised Classification Learning Algorithms. Neural Computation. 1998;10(7):1895-1923. Source.
[9] Fay MP, et al. Confidence intervals for difference in proportions for matched pairs compatible with exact McNemar tests. Statistical Methods in Medical Research / PMC. Source.
Try it in DataClue
Ready to run McNemar Test?
Test for changes in proportions for paired nominal data in a 2×2 table.
Run McNemar Test