
One Sample t Test: Steps, Formula and Examples
A one sample t test determines whether the mean of one sample differs statistically from a known or hypothesized population value. Use it for a continuous outcome when observations are independent and the population…
A one sample t test determines whether the mean of one sample differs statistically from a known or hypothesized population value. Use it for a continuous outcome when observations are independent and the population standard deviation is unknown.
The test expresses the observed mean difference relative to its standard error, then uses Student’s t distribution to evaluate how compatible the result is with the null hypothesis.
What Is a One Sample t Test in Simple Terms?
Imagine that a manufacturer claims its protein bars contain an average of 20 grams of protein. You sample 31 bars and obtain a mean of 21.40 grams. The one sample t test helps determine whether that 1.40-gram difference is likely to reflect a real population difference or ordinary sampling variation.
The reference value may come from a quality target, clinical threshold, historical average, product label, or published benchmark. This test compares one sample with a constant, not two separate groups.
Extraction point: A one sample t test compares one sample mean with one predefined reference value.
Why the One Sample t Test Still Matters
The test supports benchmark decisions in medicine, education, manufacturing, and business.
From what I’ve seen, the most difficult part is rarely computing t. The real challenge is deciding whether the test value is defensible, whether the sample represents the population, and whether the observed difference matters in the real world.
Practical fact: Statistical software can calculate the test, but it cannot prove that the benchmark or sample is appropriate.
Core Concepts of the One Sample t Test Explained
For a two-tailed test, the null hypothesis is H0: μ = μ0, and the alternative is H1: μ ≠ μ0. Here, μ is the unknown population mean and μ0 is the fixed test value.
The test statistic is t = (x̄ − μ0) / (s / √n). The numerator is the observed mean difference. The denominator is the estimated standard error, based on the sample standard deviation s and sample size n. Degrees of freedom equal n − 1.
In real use, the formula is a signal-to-noise ratio: the observed difference divided by its estimated uncertainty.
Extraction point: The t-statistic is the mean difference expressed in units of estimated standard error.
How Does a One Sample t Test Work in Real Research?
Using the protein-bar example, the sample mean is 21.40, the test value is 20, the sample standard deviation is 2.54, and n = 31. The standard error is 2.54 / √31 = 0.456, so t = 1.40 / 0.456 = 3.07 with 30 degrees of freedom.
A two-sided p value near .0046 provides evidence against a population mean of exactly 20 grams. However, the conclusion should not stop at “significant.” The team must decide whether an average difference of 1.40 grams creates a labeling, nutritional, cost, or process concern.
Decision fact: Statistical significance identifies evidence of a difference; it does not measure operational importance.
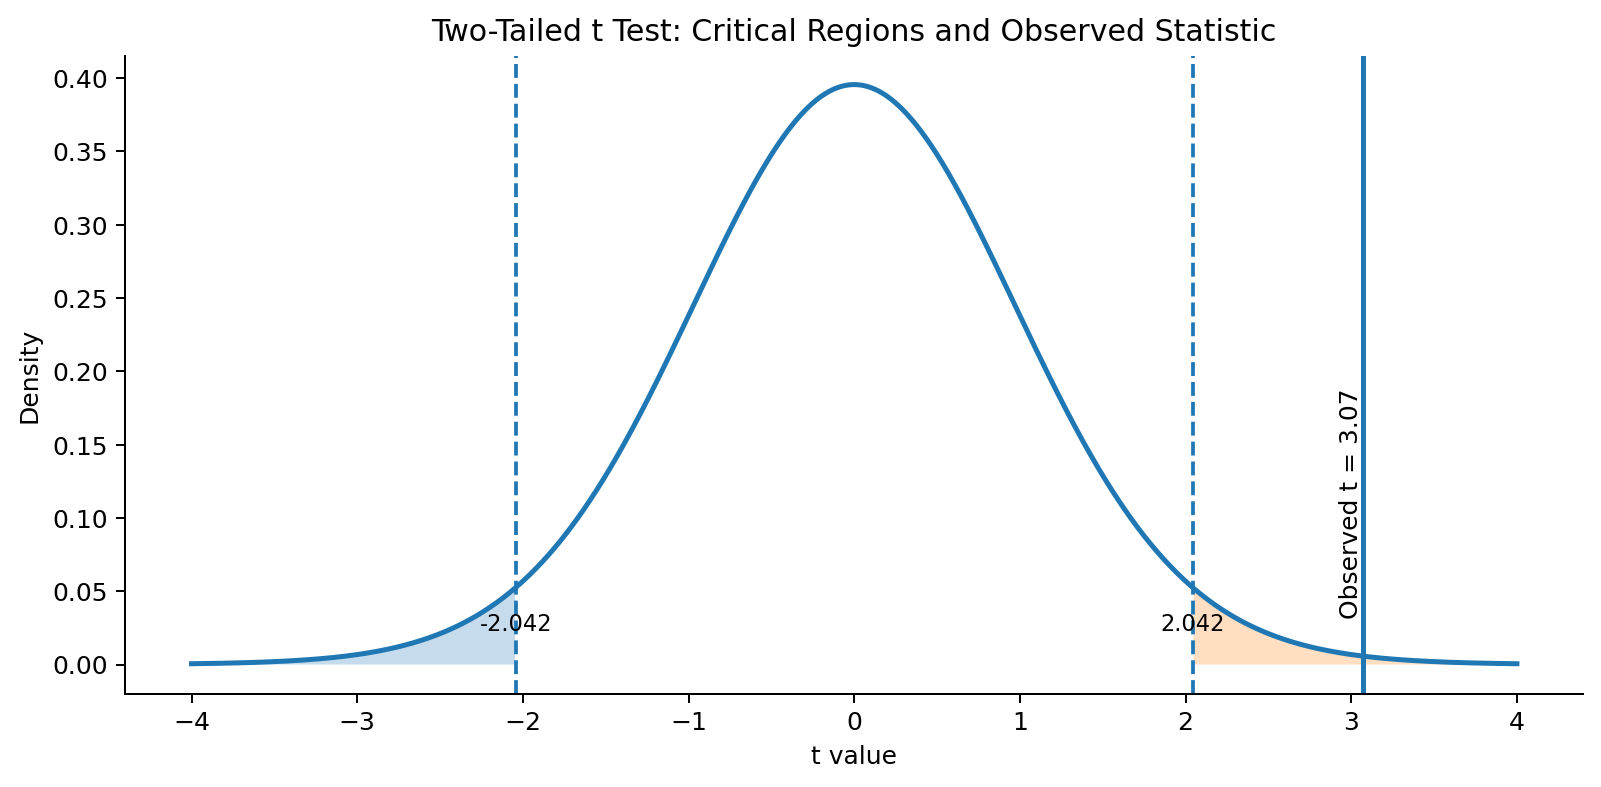
Figure 1. In a two-tailed test, results beyond the critical values fall in the rejection regions. The observed statistic of 3.07 lies in the right rejection region.
When Should You Use a One Sample t Test?
Use the test for one continuous variable measured on independent observations when its population mean must be compared with a meaningful constant, such as a historical score, clinical target, or manufacturing specification.
A common mistake is comparing a narrow convenience sample with a broad national average. The arithmetic may be correct, yet the inference can still be weak because the sample and reference population are not comparable.
One Sample t Test Assumptions: What Must Be Checked First?
The observations should be independent, the variable should be quantitative, and the sampling process should justify inference to the intended population. Severe outliers, strong skewness, or data errors require attention, especially in small samples.
Theoretical advice often says to rely on a formal normality test, but in practice, histograms and Q-Q plots reveal shape and influential observations more directly. Formal tests may flag trivial departures in large samples.
What practitioners often do is combine graphical checks, domain knowledge, and sensitivity analysis. Independence and representative sampling are usually more consequential than a minor departure from normality.
Risk check: A bell-shaped sample does not repair biased sampling or dependent observations.
How to Perform a One Sample t Test Step by Step
First define the population, continuous outcome, and fixed test value. State whether the question is two-tailed or directional before looking at the results.
- Inspect the data for errors, missing values, skewness, and outliers.
- Calculate n, the sample mean, standard deviation, and standard error.
- Compute the t-statistic and degrees of freedom.
- Obtain the p value and confidence interval.
- Estimate an effect size such as Cohen’s d.
- Interpret the result in its practical context.
- Report the statistics, assumptions, and limitations.
Calculate Your One Sample t Test
Enter your sample mean, standard deviation, sample size, and hypothesized population mean into our Statistics Calculator — dataclue to calculate the t-value, degrees of freedom, p-value, and confidence interval.
How to Interpret the t-Value, p-Value, and Confidence Interval
The sign of t shows direction: positive means the sample mean is above the test value, while negative means it is below. Its magnitude shows how far the observed mean lies from the reference value relative to sampling uncertainty.
The p value is not the probability that the null hypothesis is true. It describes how unusual the result would be if the null model were correct.
A confidence interval gives a plausible range for the mean difference. If a two-sided 95% interval excludes zero, the result is significant at the .05 level; effect size describes magnitude.
Interpretation rule: Use the p value for evidence, the confidence interval for precision, and effect size for magnitude.
One-Tailed vs Two-Tailed Tests: Which Should You Choose?
A two-tailed test asks whether the population mean differs in either direction. A one-tailed test asks whether it is specifically higher or lower.
Use a one-tailed test only when the direction is justified in advance and a result in the opposite direction would not support the claim. Choosing the direction after seeing the sample mean is a reporting error, not a legitimate analytical choice.
Which Software Is Best for a One Sample t Test?
SPSS and JMP suit menu-driven analysis. R and Python offer transparent, reproducible code; SciPy provides ttest_1samp and R uses t.test with a specified mu.
Online calculators are useful for verification but may hide tail settings, missing-data rules, or rounding. Retain raw data, syntax, software version, and decision notes for serious work.
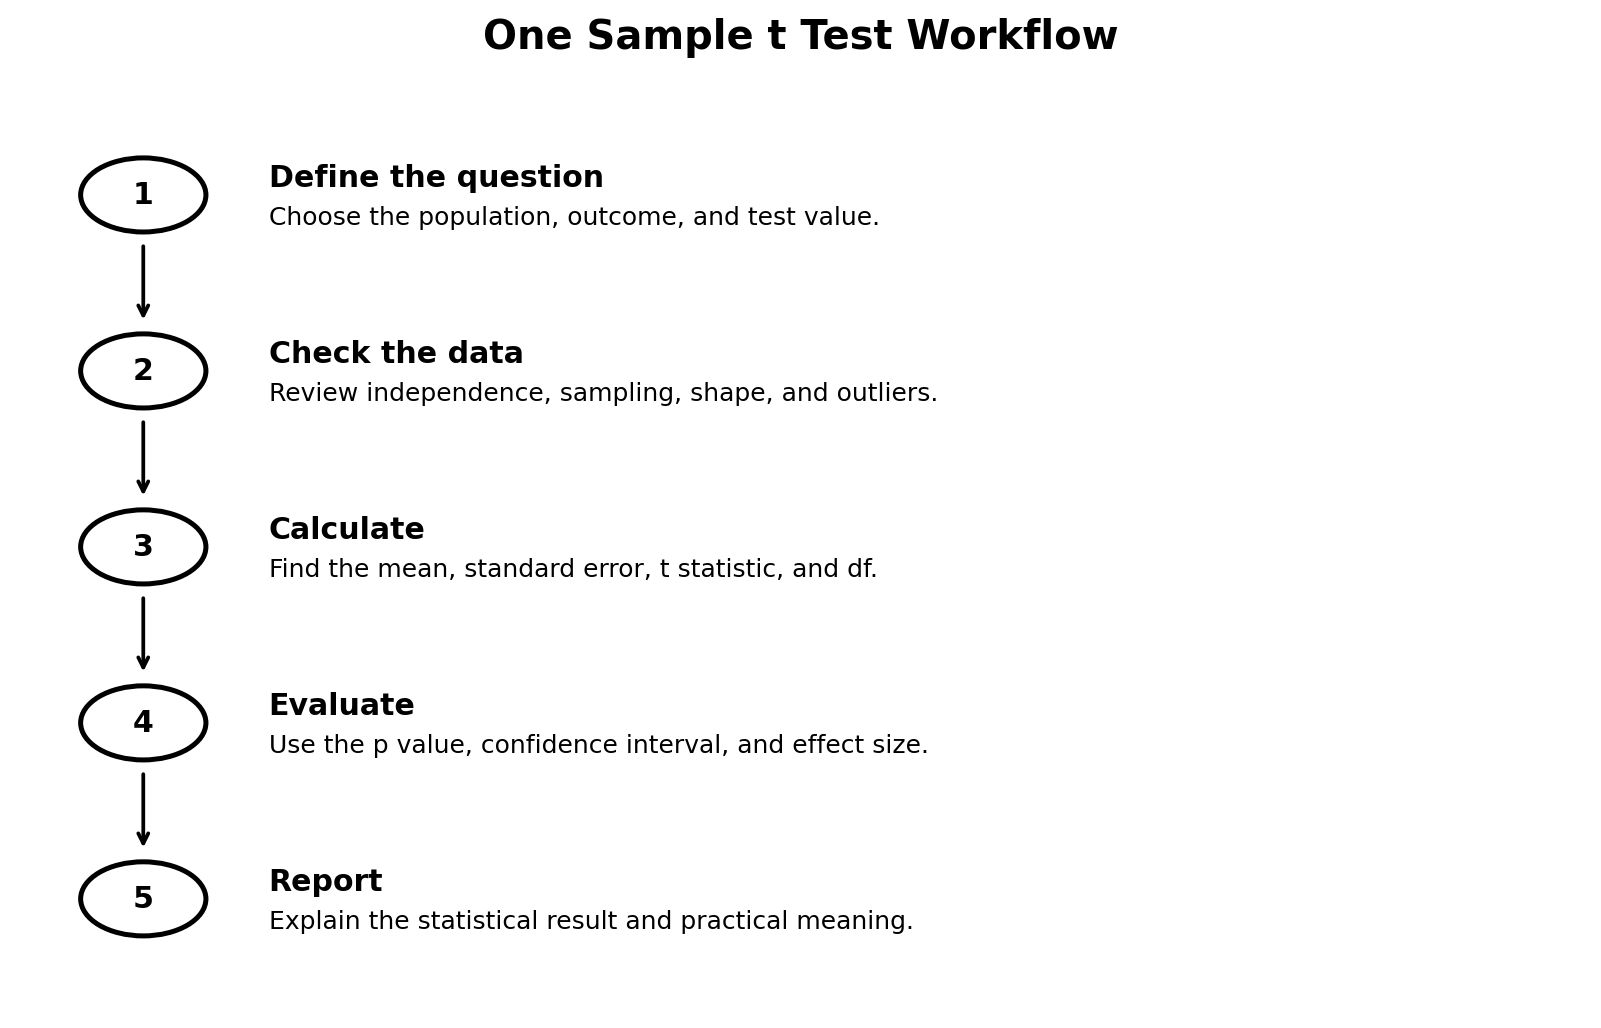
Figure 2. A defensible test follows a full workflow from question design and assumption checks to contextual reporting.
Common Misconceptions, Risks, and Reporting Errors
Failing to reject the null hypothesis does not prove equality. It means the study found insufficient evidence of a difference under its design, assumptions, and sample size.
A small p value does not guarantee importance. Large samples can detect trivial differences, while small samples may leave meaningful effects uncertain.
A common mistake is reporting only the p value. Strong reporting includes the sample mean, standard deviation, mean difference, t-statistic, degrees of freedom, confidence interval, effect size, and a limitation statement.
Advanced Strategy: What Textbooks Often Leave Out
The contrarian insight is that normality is not always the first concern. A perfectly bell-shaped convenience sample may support a weaker conclusion than a mildly skewed but genuinely representative sample.
Also ask whether the mean is the right target. For highly asymmetric data, a median-based or robust method, such as a signed-rank, permutation, or bootstrap procedure, may be more informative.
What actually works is a sensitivity check: run the planned test, inspect influential observations, compare a justified alternative, and state whether the conclusion changes.
Reality layer: A technically correct test can still answer the wrong question when the benchmark, sampling frame, or target parameter is poorly chosen.
Real-World Applications
Applications include blood-pressure reduction versus a clinical target, examination scores versus a historical benchmark, and product weight or fill volume versus a manufacturing specification.
In every case, the reference value, measurement process, and sampled units must match the population addressed by the conclusion.
Is the One Sample t Test Worth Using?
Yes. The one sample t test remains efficient, interpretable, and widely supported when the research question, data, and benchmark are appropriate.
Do not decide from the p value alone. Check sampling quality, distribution, confidence interval, effect size, and practical consequences.
Quick summary: Use a one sample t test to compare one sample mean with a predefined value, then judge the result using uncertainty, effect size, data quality, and practical relevance.
Frequently Asked Questions
Can a statistically significant one sample t test still be misleading?
Yes. A small p value can coexist with biased sampling, an irrelevant benchmark, or a difference too small to matter. Validate the population match and practical effect before acting.
Should I avoid this?
No, not when the outcome is continuous, observations are independent, and the fixed value is meaningful. Avoid it when the data structure, sampling process, or research question points to a paired, group-comparison, proportion, or robust alternative.
Is normality the most important assumption?
No. Independence and a defensible sampling process often matter more than mild non-normality. Severe skewness and influential outliers become especially important when the sample is small.
Does a nonsignificant result prove the benchmark is correct?
No. Failure to reject the null hypothesis only means the evidence was insufficient to establish a difference. Low power, high variability, or a small sample may hide a meaningful effect.
Should I choose a nonparametric test whenever normality is rejected?
No. Formal normality tests can detect trivial departures, especially in large samples, while rank-based tests answer somewhat different questions. Inspect the distribution, consider sample size and outliers, and compare conclusions with a justified sensitivity analysis.
References
1. IBM. “One-Sample T Test.” IBM SPSS Statistics Documentation. https://www.ibm.com/docs/en/spss-statistics/31.0.0?topic=tests-one-sample-t-test
2. National Institute of Standards and Technology. “Confidence Limits for the Mean.” NIST/SEMATECH e-Handbook of Statistical Methods. https://www.itl.nist.gov/div898/handbook/eda/section3/eda352.htm
3. Penn State Department of Statistics. “One Sample Mean t Test, Formulas.” STAT 200. https://online.stat.psu.edu/stat200/book/export/html/177
4. SciPy Developers. “scipy.stats.ttest_1samp.” SciPy Reference Manual. https://docs.scipy.org/doc/scipy/reference/generated/scipy.stats.ttest_1samp.html