
One-Way ANOVA: Guide, Examples, and Interpretation
One-way ANOVA is a statistical test used to determine whether the means of three or more independent groups differ significantly. It compares variation between groups with variation within groups, then uses an…
One-way ANOVA is a statistical test used to determine whether the means of three or more independent groups differ significantly. It compares variation between groups with variation within groups, then uses an F-statistic and p-value to judge whether the observed pattern is unlikely under equal population means.
Direct answer: The test tells you whether at least one group mean differs, but not which specific groups differ or whether the difference is practically important.
What Is One-Way ANOVA in Simple Terms?
One-way analysis of variance compares a continuous outcome across groups created by one categorical independent variable. The categorical variable is the factor, its categories are levels, and the measured result is the dependent variable.
For example, a manufacturer may compare torque resistance across five production lots. The lot is the factor, each numbered lot is a level, and torque resistance is the outcome. The word “one-way” means only one factor is under study.
One-way ANOVA is an omnibus test. Its null hypothesis states that all population means are equal; the alternative states that not all means are equal. A significant result supports a difference somewhere among the groups, not a conclusion about every pair. [1]
Why One-Way ANOVA Still Matters
The method remains central to quality control, clinical research, education, agriculture, marketing experiments, and laboratory testing because many decisions begin with comparing several group averages.
From what I’ve seen, strong workflows use software for calculation and visualization while keeping method selection, assumption review, and interpretation under human control.
Core Concepts and How the Test Works
ANOVA partitions total variation into between-group variation and within-group variation. Between-group variation reflects how far group means lie from the grand mean. Within-group variation reflects how much individual observations differ inside each group.
The test divides the between-group mean square by the within-group mean square. This produces the F-ratio. When equal means are plausible, both mean squares estimate similar random variation and F tends to be near 1. Larger values indicate stronger separation relative to background spread.
In real use, the F-statistic must be read with its numerator and denominator degrees of freedom and its p-value. NIST describes one-factor ANOVA as a generalization of the two-sample t-test for testing equal means across groups.
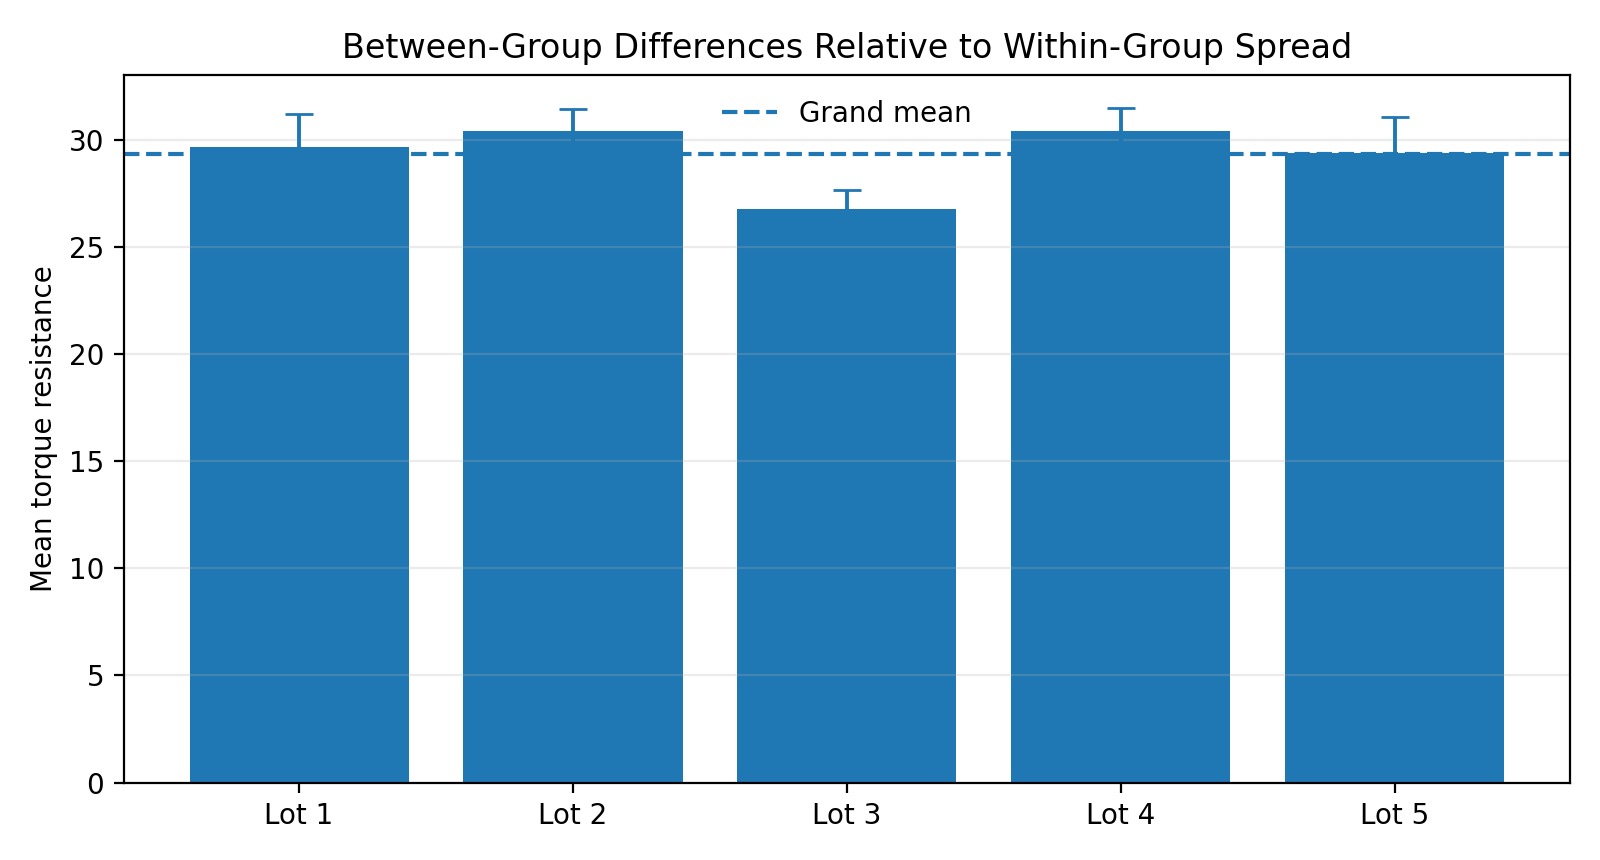
Figure 1. Group means, the grand mean, and within-group spread in the adhesive example.
When Should You Use One-Way ANOVA?
Use it when one categorical factor divides independent experimental units into two or more groups and the dependent variable is quantitative. It is most commonly chosen for three or more groups because a two-group result is equivalent to the independent-samples t-test, with F equal to t squared.
Do not use a standard independent-groups ANOVA for repeated measurements from the same participant, matched pairs, clustered observations, or multiple interacting factors. Those designs require repeated-measures, mixed, multilevel, or factorial approaches.
Assumptions: What Must Be Checked First?
The main requirements are independence of observations, a quantitative outcome, approximate normality within groups, reasonably similar variances, and no highly influential outliers. Independence comes from the study design and cannot be repaired by clicking an option in software.
Theoretical advice often says every group must be perfectly normal, but in practice, balanced ANOVA is often tolerant of moderate non-normality. Severe skew, very small samples, influential outliers, or unequal variances combined with unequal sample sizes deserve more caution.
How to Perform a One-Way ANOVA Step by Step
First, define the factor, outcome, groups, experimental unit, and hypotheses. Next, review missing values, sample sizes, descriptive statistics, and plots. This catches coding errors and reveals whether the intended groups actually represent the decision being made.
Then assess independence, outliers, residual shape, and homogeneity of variance, commonly with graphical checks and Levene’s test. Run standard ANOVA when the conditions are reasonable, or consider Welch’s ANOVA when variances are unequal.
Finally, interpret the F-statistic, p-value, effect size, confidence intervals, and planned or post hoc comparisons. Report the result in plain language and preserve enough detail for another analyst to reproduce the work.
Want to calculate the result using your own group data? Use the Statistics Calculator — dataclue to generate the sum of squares, degrees of freedom, mean squares, F-statistic, p-value, and ANOVA summary table.
Example: Five Adhesive Production Lots
The supplied example contains five torque-resistance measurements from each of five lots. Lot 3 has a mean of 26.77, while the other means are approximately 29.37 to 30.43. The overall test reports F(4, 20) = 6.90 and p = 0.0012.
That result supports a difference among the lot means. The plot also suggests Lot 3 is lower, but the omnibus result alone does not formally identify the responsible pairwise differences. A suitable follow-up comparison is still required.
What practitioners often do is combine the formal result with the process context. Holding Lot 3 for further evaluation may be sensible, but root-cause investigation should also examine raw materials, operators, equipment settings, and measurement consistency.
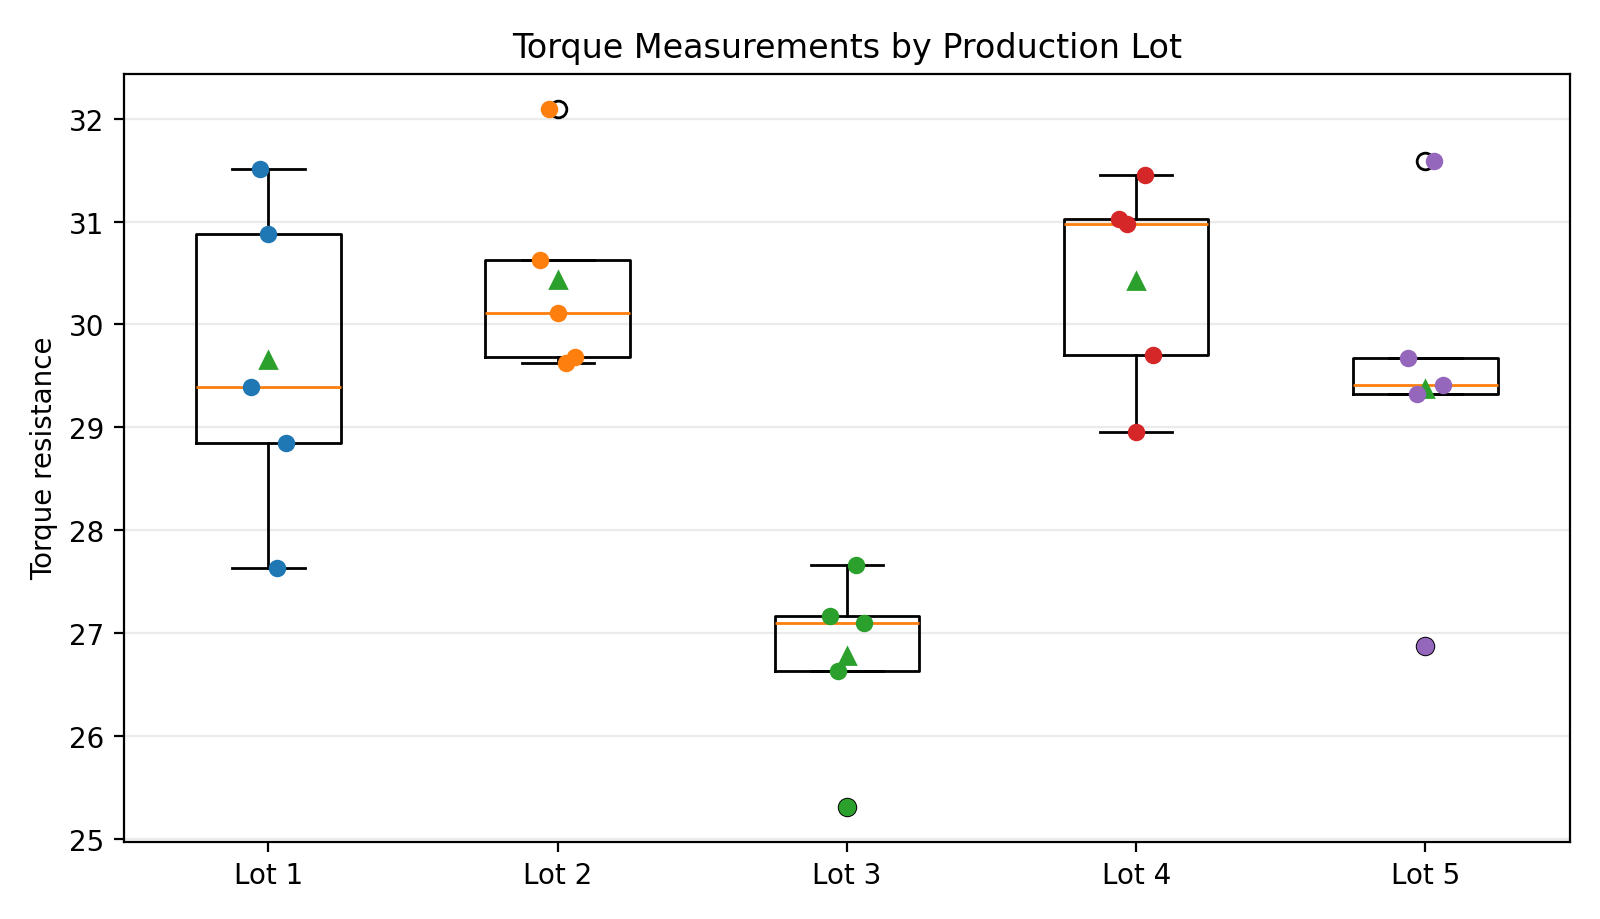
Figure 2. Torque-resistance observations by production lot. Lot 3 shows a visibly lower center.
How to Interpret the ANOVA Table
The F-statistic is the factor mean square divided by the error mean square. A small p-value indicates that an F value at least this large would be unusual if all population means were equal. It does not state the probability that the null hypothesis is true.
The reality layer is simple: a significant p-value is only one part of the decision. Effect size, uncertainty, measurement quality, costs, and operational consequences determine whether the finding matters.
SPSS, R, Python, and Excel Compared
IBM SPSS Statistics is convenient for menu-driven analysis, Levene tests, robust equality-of-means tests, contrasts, and multiple-comparison procedures. R offers the widest statistical flexibility and strong reproducibility. Python works well when analysis must connect with data pipelines and visualizations.
The best tool is the one that supports transparent data preparation, assumption checks, repeatable analysis, and defensible reporting. A polished output table is not evidence that the chosen model was appropriate.
Common Misconceptions and Statistical Risks
A common mistake is running many separate t-tests, which inflates the chance of false-positive findings. Another is assuming a significant ANOVA proves causation; causality depends on randomization, controls, measurement, and study design.
A contrarian but important insight is that statistical significance is often the least decision-relevant output. Large samples can make trivial effects significant, while smaller studies may contain practically meaningful patterns that remain uncertain.
What Should You Do After a Significant Result?
Choose follow-up comparisons based on the question and variance structure. Tukey HSD is widely used for all pairwise comparisons when equal variances are reasonable. Games-Howell is often preferred when variances or group sizes differ, while Dunnett’s test compares treatments with one control.
Theoretical advice often says to move automatically from significance to a standard post hoc test, but in practice, the follow-up should match the decision. Comparing every pair can add noise when only one control-versus-treatment question matters.
Is One-Way ANOVA Worth Using? Final Decision Guide
Yes. One-way ANOVA remains an efficient, interpretable method when one factor defines independent groups and the goal is to compare quantitative means. It becomes less suitable when observations are related, important covariates are ignored, distributions are highly problematic, or several factors interact.
Before deciding, confirm the design, inspect the data, document assumptions, report effect size and uncertainty, and use a justified follow-up method. That sequence produces a more defensible answer than focusing on whether p is below a fixed threshold.
Keyword and Entity Integration Check
| Placement | Validation |
|---|---|
| Title | The primary keyword appears at the start of the SEO title with a clear guide-and-interpretation outcome. |
| Headings | The keyword and close variants appear in definition, assumptions, workflow, interpretation, tools, risks, and decision-support headings without repetition. |
| First 100 words | The opening defines one-way ANOVA, states its purpose, and connects it to group means, the F-statistic, and the p-value. |
| Body | Core entities are distributed by context: factor and levels in fundamentals; sums of squares and mean squares in interpretation; Levene’s test and Welch’s ANOVA in assumptions; Tukey HSD, Games-Howell, and Dunnett in follow-up analysis. |
| Conclusion | The closing section repeats the decision criteria naturally and links one-way ANOVA to appropriate alternatives. |
| Meta description | The description includes the main keyword plus assumptions, F-statistics, p-values, post hoc tests, and common errors in a readable sentence. |
| Entity clustering | Related concepts are grouped within the sections where they are most useful, improving semantic depth, readability, and extraction readiness. |
Snippet-Ready FAQs
Should I avoid this?
No, not when your design has one categorical factor, independent groups, and a quantitative outcome. Avoid standard one-way ANOVA when observations are related, variances are seriously unequal with unbalanced groups, or the outcome requires a different model.
Can a significant one-way ANOVA still be practically useless?
Yes. A very small p-value can accompany a trivial effect, especially in a large sample, so effect size, confidence intervals, and decision costs must be reviewed before acting.
Is Welch’s ANOVA a better default than standard ANOVA?
Often, yes, when equal variances are uncertain because Welch’s method is more robust to heterogeneity. Standard ANOVA remains reasonable for balanced data with similar spreads, so the choice should follow diagnostics and design.
Does one-way ANOVA tell me which group caused the result?
No. It only indicates that not all population means are equal; post hoc tests or planned contrasts are needed to locate the differences while controlling multiple-comparison error.
Can software make an invalid one-way ANOVA look trustworthy?
Yes. Software can produce a correct table from a poorly designed analysis, so independence, data quality, assumptions, effect size, and the research question must be checked outside the output itself.
References
1. NIST/SEMATECH e-Handbook of Statistical Methods, “One-Way ANOVA” and “One-Factor ANOVA.”
2. Penn State STAT 200, “One-Way ANOVA” and hypothesis-testing guidance.
3. IBM Documentation, “One-Way ANOVA,” IBM SPSS Statistics.
4. SciPy Reference Guide, scipy.stats.f_oneway.