
P Value: Meaning, Formula, Examples, and Interpretation
A p value helps you judge how unusual your data would be if the null hypothesis were true. This guide explains the meaning, calculation, examples, common mistakes, and better ways to report results.
P Value: Meaning, Formula, Examples, and Interpretation
A p value is a probability calculated under a null hypothesis. It tells you how unusual your test result would be if that null model were correct. Small p values can show that the data are hard to explain under the null model. They do not tell you the probability that the null hypothesis is true.
That distinction matters in research, health, business, education, finance, and public policy. A p value can help with a decision, but it should not make the decision by itself. Effect size, confidence intervals, study design, data quality, and practical cost still matter.
This guide uses original US based examples and verified calculations. It starts with the meaning, then moves through formulas, common tests, interpretation, reporting, and the mistakes that cause the most confusion.
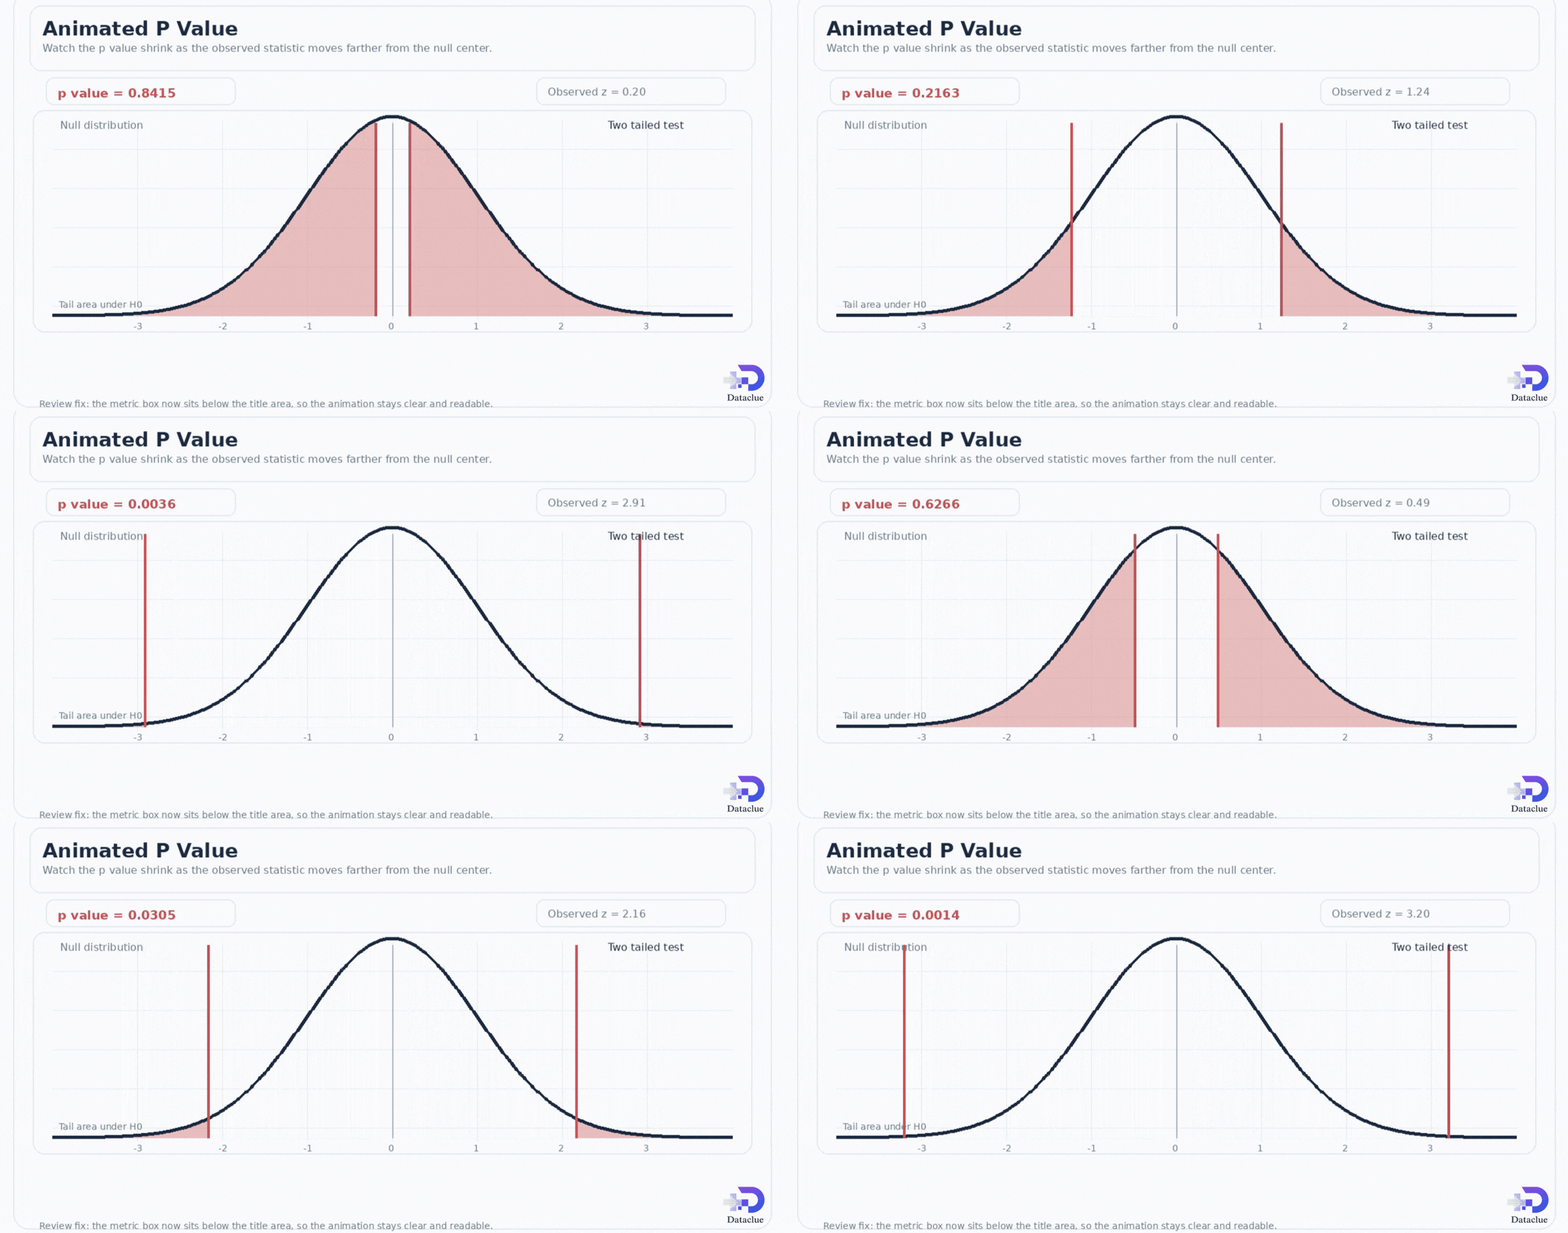
Animated P Value: Watch the Tail Area Shrink
The observed z statistic away from zero. The shaded two tailed area becomes smaller as the statistic becomes more extreme.
What Is a P Value?
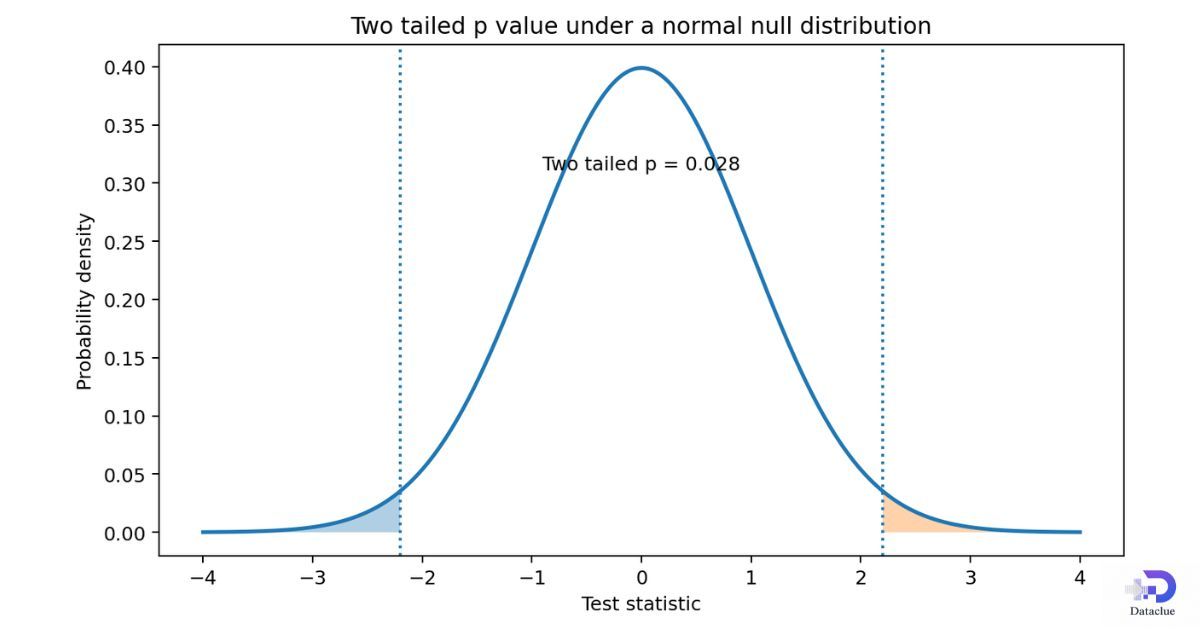
A p value is the probability, under a stated null hypothesis and statistical model, of getting a test statistic at least as extreme as the one observed. The word extreme means farther into the part of the null distribution that supports the alternative hypothesis.
Here is the key idea. The p value starts by treating the null hypothesis as the working model for the calculation. It then asks how often results this unusual would appear under that model.
If p = 0.03, the correct idea is that results at least this extreme would occur about 3 percent of the time under the null model, using the chosen test and its assumptions. It is not correct to say there is a 3 percent chance that the null hypothesis is true.
| P value | At alpha = 0.05 | Useful decision language | Important caution |
|---|---|---|---|
| 0.20 | Do not reject H₀ | The data are not very unusual under H₀ | This does not prove H₀ |
| 0.07 | Do not reject H₀ | Evidence is not strong enough at 0.05 | A different planned alpha could lead to a different rule |
| 0.03 | Reject H₀ | The result is statistically significant at 0.05 | Report the effect size too |
| 0.001 | Reject H₀ | The data are highly incompatible with H₀ | A tiny p value can still come with a tiny effect |
What Is a Null Hypothesis?
The null hypothesis, written H₀, is the specific claim used to build the reference distribution for a statistical test. It often says there is no difference, no association, or a parameter equals a stated value. The alternative hypothesis, written H₁, describes the competing direction or difference that matters to the study.
Suppose a US delivery company claims its average package processing time is 10 minutes. A two sided test could use H₀: μ = 10 and H₁: μ ≠ 10. The p value is calculated by asking how unusual the sample result would be if the true average were 10 minutes and the test assumptions held.
Assuming H₀ for the calculation is not the same as believing H₀ is true. It is a reference point that lets us measure how surprising the data are.
What Is a P Value Used For?
P values are used in hypothesis tests across many fields. A clinical trial might test whether an average treatment difference is zero. An ecommerce team might compare conversion rates. A factory might test whether a process mean has shifted. An economist might test a regression coefficient. A school district might compare average outcomes between programs.
The p value helps answer a narrow statistical question about compatibility with a null model. It does not prove that a treatment caused an outcome. Causal claims require a design that supports causation, such as a well run randomized experiment or a credible causal research design.
The Precise Meaning of a P Value
The cleanest notation is P(data this extreme or more extreme | H₀ and the model assumptions). The vertical bar means given. Everything to the right of the bar is treated as the condition for the probability calculation.
This is why the exact test matters. A z test, t test, chi square test, F test, and permutation test build their tail probabilities from different null distributions. The logic stays similar, but the mathematical reference changes.
What a P Value Does Not Mean
A p value does not tell you the probability that H₀ is true. It does not give the probability that the result happened by chance. It does not tell you the probability that the researcher is wrong. It does not measure effect size. It does not measure business value, medical value, or policy importance.
It also does not tell you the probability that another study will get the same result. Replication depends on the true effect, sample size, measurement quality, analysis choices, and other sources of variation.
How to Interpret a P Value
A useful interpretation has three parts. Name the null hypothesis in context. Describe the observed result or test statistic. Then state the probability of seeing a result at least as extreme under that null model.
For example: If the true average battery life were 20 hours, and the test assumptions were met, a p value of 0.04 means a sample result at least this far from 20 hours would occur about 4 percent of the time under that null model.
Then make the decision separately. At a preselected alpha of 0.05, p = 0.04 would be statistically significant. That does not tell you whether the battery life difference is large enough to matter to customers.
What a Small vs Large P Value Tells You
A small p value means the observed result is unusual under H₀. That gives a reason to question the null model. A large p value means the result is not unusual enough to reject H₀ using the planned rule.
A large p value is not evidence that the effect is exactly zero. The study may have too little data, too much noise, weak measurement, or an effect too small to detect with useful precision. The correct phrase is usually fail to reject H₀, not accept H₀.
Significance Level and P Value
The significance level, written α, is a decision threshold chosen before looking at the result. Common values include 0.05 and 0.01, but the choice should reflect the cost of false positives, the field, and the study purpose.
If the study uses the rule p < α, then p below alpha leads to rejection of H₀. Some courses and software descriptions use p ≤ α. The exact equality rule should be stated before analysis because a rounded value of 0.050 can hide more precise digits.
Alpha is connected to Type I error. In a valid test, if H₀ is true and the full procedure is repeated many times, alpha controls the long run false positive rate for that test.
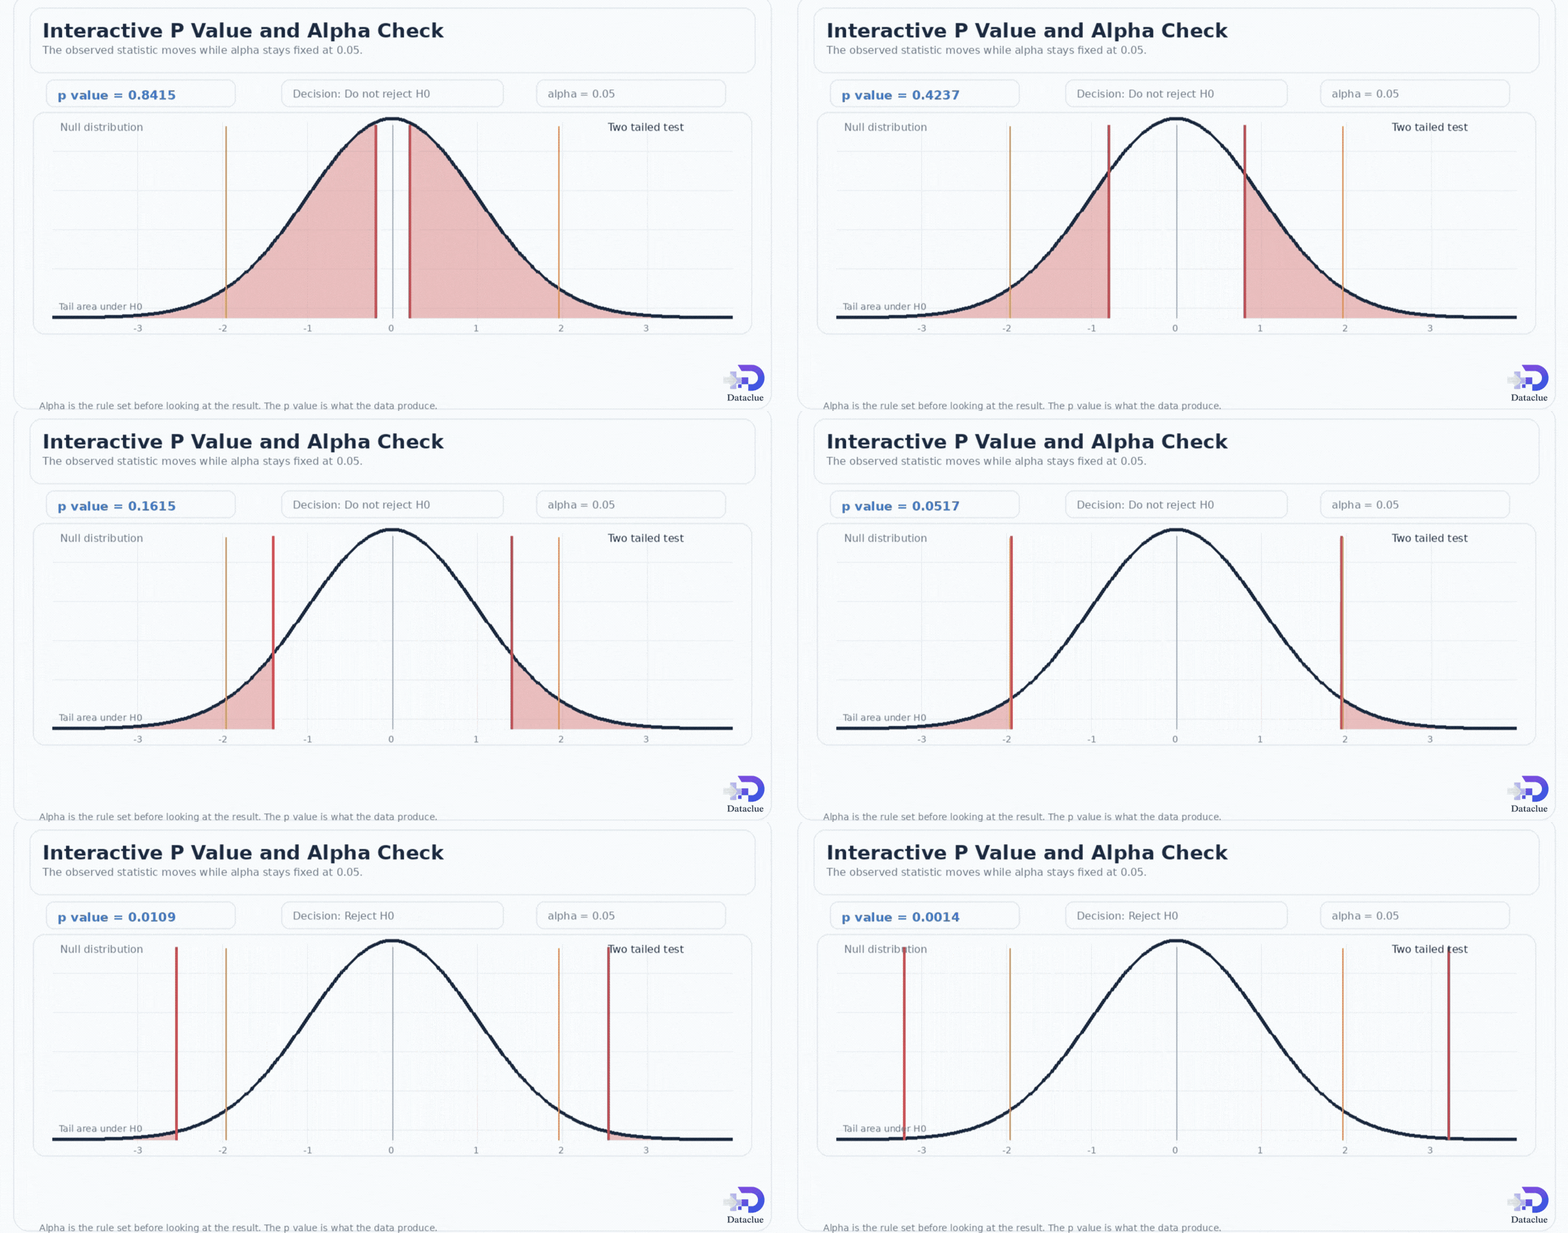
Interactive p value and alpha check
P Value vs Significance Level
P value and alpha play different roles. The p value comes from the data and model. Alpha is a decision rule set by the analyst or study plan.
| Feature | P value | Significance level, alpha |
|---|---|---|
| What it is | Tail probability calculated from the observed test statistic | Preselected decision threshold |
| When set | After data are analyzed | Before looking at the test result |
| Typical range | 0 to 1 | Often 0.05 or 0.01 |
| Main role | Shows compatibility of data with H₀ | Defines the planned rejection rule |
| Common mistake | Treating it as P(H₀ | data) | Changing alpha after seeing the result |
Is a 0.05 P Value Significant?
Under a rule defined as p ≤ 0.05, a p value of exactly 0.05 meets the threshold. Under a rule defined as p < 0.05, it does not. In real output, the displayed 0.050 may also be rounded from a more precise number.
The larger lesson is more important. A result with p = 0.049 and one with p = 0.051 should not be treated as opposite scientific truths. Report the actual p value, effect estimate, confidence interval, and context instead of turning a narrow threshold into a bright line between real and unreal.
What Does a P Value of 0.001 Mean?
If p = 0.001, a result at least as extreme as the observed one would occur about 0.1 percent of the time under the stated null model and test assumptions. That is strong incompatibility with H₀.
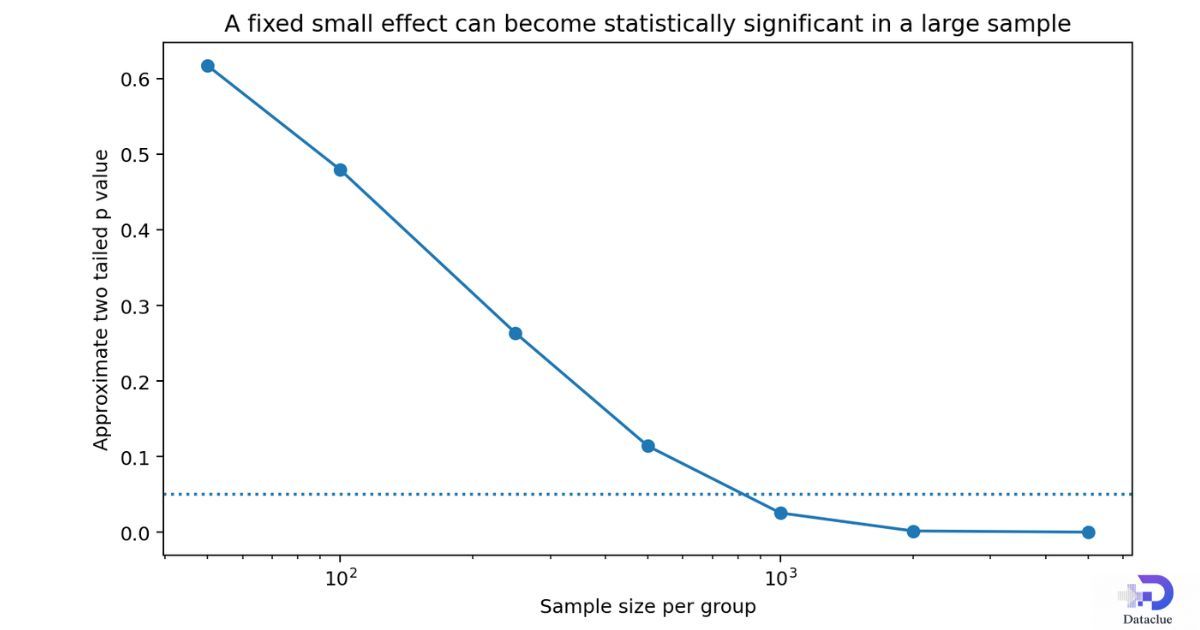
It still does not tell you the size of the effect. With a very large sample, a tiny difference can produce a very small p value. Always look at the estimated effect and its uncertainty.
One Tailed vs Two Tailed P Values
A right tailed test counts outcomes in the planned positive direction. A left tailed test counts outcomes in the planned negative direction. A two tailed test counts extreme outcomes in both directions.
The direction must come from the research question and be decided before seeing the data. Switching from a two tailed test to a one tailed test after seeing the result can make the p value smaller for the wrong reason.
| Alternative hypothesis | Tail area used | Typical question |
|---|---|---|
| H₁: parameter > null value | Right tail | Is the new mean higher? |
| H₁: parameter < null value | Left tail | Is the defect rate lower? |
| H₁: parameter ≠ null value | Both tails | Is there any difference? |
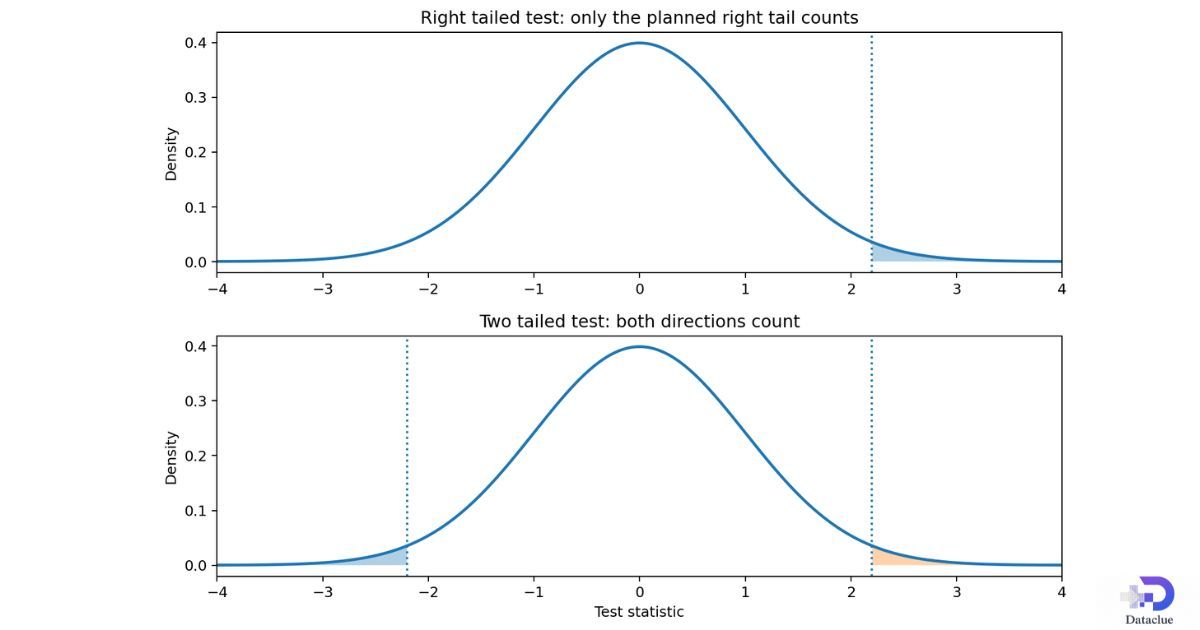
Interactive tail explorer
Choose the alternative hypothesis to see which part of the null distribution counts toward the p value.
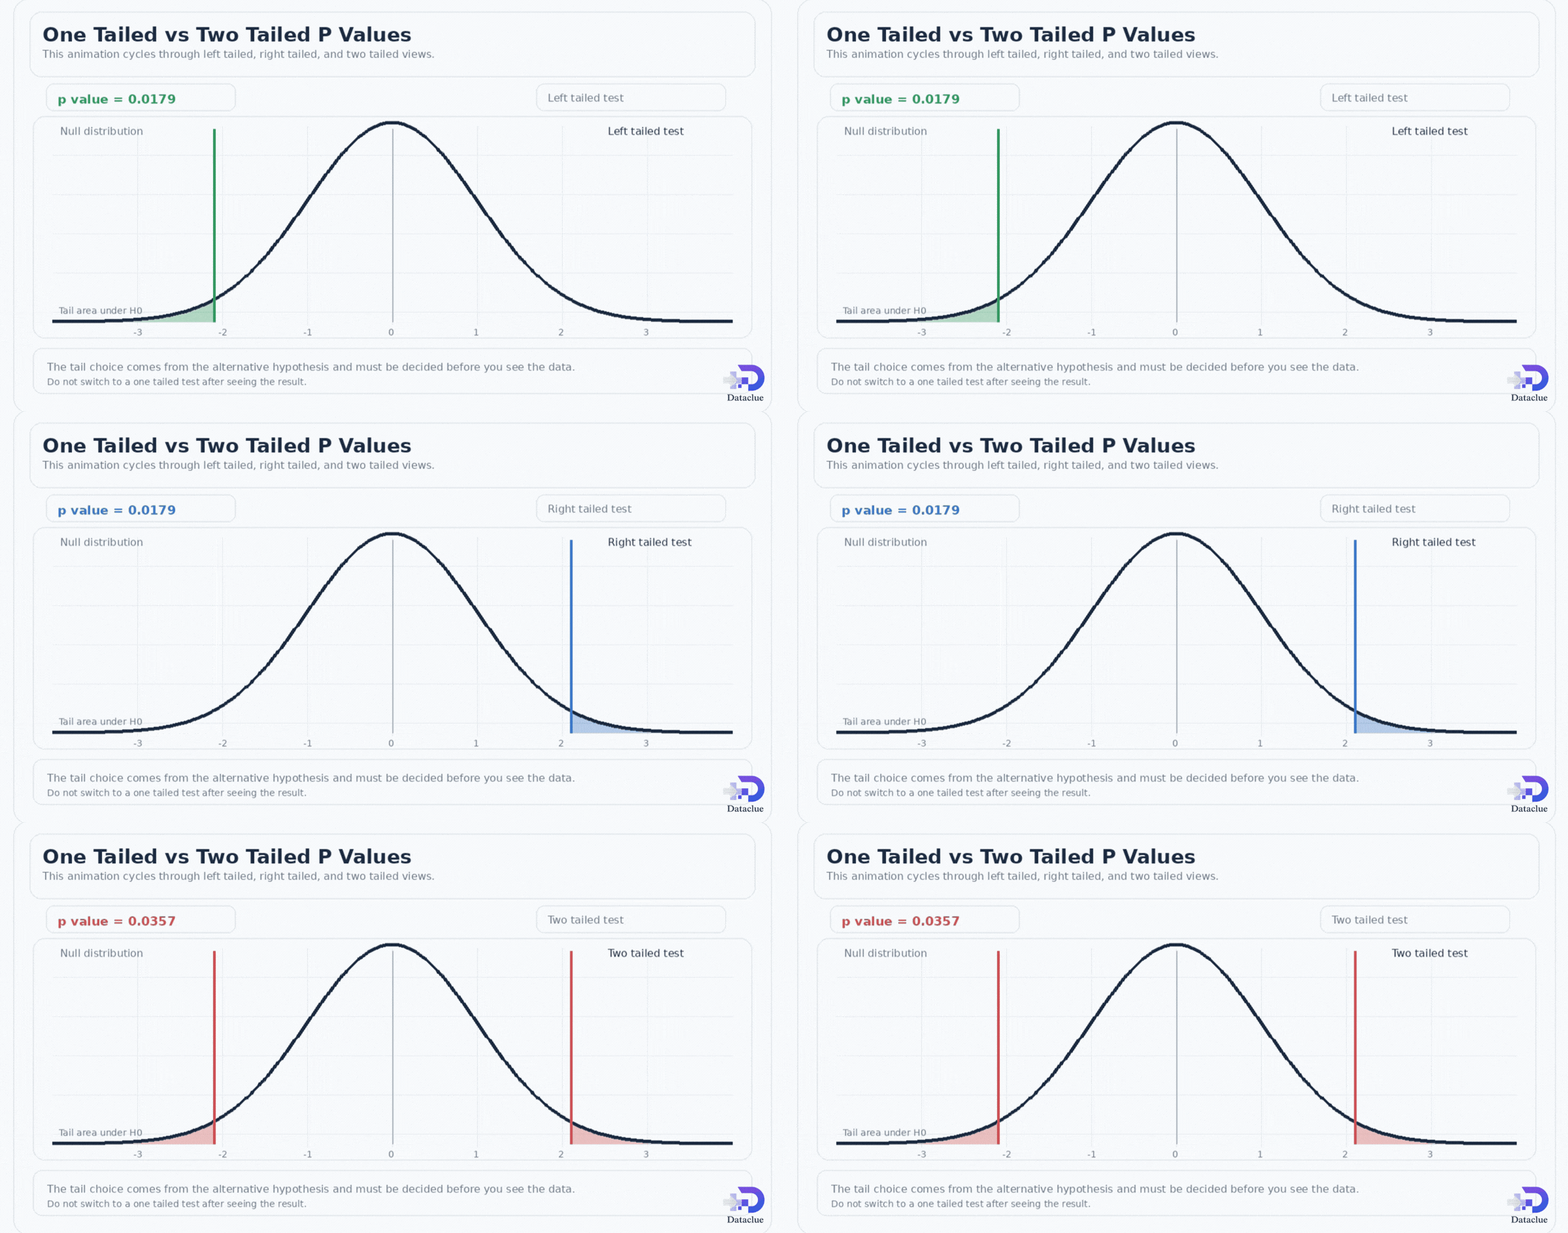
P Value Formula and Calculation
There is no single universal p value formula. A p value is a tail probability from the null distribution of the chosen test statistic. The formula changes with the test.
For a two sided z test, a common form is p = 2[1 − Φ(|z|)], where Φ is the standard normal cumulative distribution function. For a t test, the same tail idea uses the t distribution and its degrees of freedom. Chi square and F tests usually use an upper tail.
| Test | Common statistic | P value reference |
|---|---|---|
| One sample z | z = (x̄ − μ₀) / (σ / √n) | Normal tail area |
| One sample t | t = (x̄ − μ₀) / (s / √n) | t tail area with df |
| Chi square | χ² = Σ[(O − E)² / E] | Upper chi square tail |
| ANOVA | F = between group variance / within group variance | Upper F tail |
| Regression coefficient | t = (β estimate − β₀) / SE | t tail area with model df |
How Is a P Value Calculated?
The calculation follows a repeatable process. First write H₀ and H₁. Next choose a valid statistical test. Then compute the test statistic from the sample. Identify the correct null distribution and degrees of freedom. Find the tail area defined by H₁. Finally, interpret the result in context.
This process is more important than memorizing one formula because the correct p value depends on the study design and test assumptions.
- Write H₀ and H₁ before examining the result.
- Choose the test that matches the outcome, groups, design, and assumptions.
- Compute the test statistic.
- Use the correct null distribution and degrees of freedom.
- Find the planned tail area.
- Compare p with the preselected alpha if a decision rule is needed.
- Report the effect estimate and uncertainty with the p value.
P Value from a Z Test
A one sample z statistic for a mean can be written as z = (x̄ − μ₀) / (σ / √n). Here x̄ is the sample mean, μ₀ is the null mean, σ is the known population standard deviation, and n is the sample size.
For a two tailed test, p = 2[1 − Φ(|z|)]. If z = 2.50, the two tailed p value is about 0.0124. The sample result is therefore unusual under the null model.
z = (x̄ − μ₀) / (σ / √n) and two tailed p = 2[1 − Φ(|z|)]
P Value from a T Test
When the population standard deviation is unknown, a one sample t test often uses t = (x̄ − μ₀) / (s / √n). The sample standard deviation s replaces σ. The reference distribution is a t distribution with degrees of freedom, usually n − 1 for a one sample test.
The t distribution has heavier tails than the normal distribution, especially with small samples. That extra tail weight reflects uncertainty from estimating the standard deviation.
t = (x̄ − μ₀) / (s / √n), with df = n − 1 for a basic one sample t test
P Value from a Chi Square Test
A chi square test compares observed counts with counts expected under H₀. A common statistic is χ² = Σ[(O − E)² / E], where O is an observed count and E is the expected count.
Large chi square values show a larger mismatch between observed and expected counts. The p value is usually the upper tail probability from the chi square distribution with the proper degrees of freedom.
χ² = Σ[(O − E)² / E]
P Value from ANOVA and the F Distribution
ANOVA compares variation between group means with variation within groups. Its F statistic is a ratio of two variance estimates. When H₀ says all group means are equal, a large F statistic is evidence that the between group variation is too large to explain easily under H₀.
The ANOVA p value is the upper tail probability from an F distribution with numerator and denominator degrees of freedom. A significant ANOVA tells you that at least one group mean differs. It does not tell you which groups differ. Planned contrasts or follow up comparisons are needed.
F = variance estimate between groups / variance estimate within groups
P Value in Regression
For a regression coefficient, a common null hypothesis is H₀: β = 0. The test statistic is often t = estimate / standard error when the null value is zero. Software then converts that statistic to a p value using the model degrees of freedom.
A small p value for a coefficient means the estimate is hard to explain under a zero coefficient model, given the regression assumptions. It does not prove causation. It also does not tell you whether the predictor has useful predictive power or whether the coefficient is large enough to matter.
For H₀: β = 0, a common statistic is t = estimated coefficient / standard error
Calculating P Values in Software
Most analysts use software for tail probabilities. The important part is choosing the correct function, tail, and degrees of freedom. Always keep the test definition and output together.
| Software | Example route | What to check |
|---|---|---|
| Python, SciPy | 2 * scipy.stats.norm.sf(abs(z)) for a two sided z test | Tail choice and test assumptions |
| Python, SciPy | 2 * scipy.stats.t.sf(abs(t_stat), df) for a two sided t test | Correct df |
| R | 2 * pnorm(−abs(z)) or 2 * pt(−abs(t_stat), df) | Use lower tail logic correctly |
| Excel | 2*(1−NORM.S.DIST(ABS(z),TRUE)) or T.DIST.2T(ABS(t_stat),df) | Absolute value and correct df |
| SPSS | Read the Significance or Sig. field from the correct test output | Confirm whether the output is one sided or two sided |
Worked P Value Examples Step by Step
These five examples use original teaching data. Each value was checked with standard probability distributions. The examples are simple on purpose so the interpretation stays clear.
| Test | H₀ and H₁ | Statistic | P value | Decision at 0.05 | Plain English interpretation |
|---|---|---|---|---|---|
| One sample z test | H₀: μ = 12 oz, H₁: μ ≠ 12 oz | z = 2.50 | 0.0124 | Reject H₀ | A mean this far from 12 oz is unusual under the null model. |
| One sample t test | H₀: μ = 5 min, H₁: μ < 5 min | t = −2.00, df = 24 | 0.0285 | Reject H₀ | The sample supports a lower mean response time. |
| Welch two sample t test | H₀: μ₁ = μ₂, H₁: μ₁ ≠ μ₂ | t = 2.10, df ≈ 76.9 | 0.0389 | Reject H₀ | The score difference is statistically significant in this simulated comparison. |
| Chi square test | H₀: purchase and device group are independent | χ² = 4.51, df = 1 | 0.0337 | Reject H₀ | The simulated table shows evidence of an association. |
| Regression coefficient | H₀: β = 0, H₁: β ≠ 0 | t = 3.00, df = 48 | 0.0043 | Reject H₀ | The coefficient differs from zero under the model assumptions. |
Real World P Value Examples
Clinical research: A US clinic compares average blood pressure change between two randomized treatment groups. A p value can test a zero mean difference, but the report should also give the blood pressure difference in mmHg and its confidence interval.
A B testing: An online store compares checkout completion rates for two page designs. A p value can test equal conversion rates. The business team should also look at the absolute lift, revenue impact, experiment duration, and whether many variants were tested.
Manufacturing: A plant tests whether the mean fill weight has moved from a target. Statistical significance matters, but the engineering tolerance and cost of overfill or underfill matter too.
Finance: An analyst tests whether a strategy coefficient differs from zero in a historical model. A small p value does not remove market risk, data mining risk, or the need for out of sample validation.
Education and policy: A school district or agency may compare outcomes across programs. A p value cannot fix a weak design. Random assignment, comparable groups, missing data, and confounding still determine what can be claimed.
How Can You Compare Two P Values?
When two p values come from comparable tests of the same type and question, the smaller p value shows data that are more incompatible with the tested null model. That does not make the result more important in a linear way.
For example, p = 0.01 is not twice as important as p = 0.02. A p value is not a score of effect size or practical value. Comparing p values from unrelated models can be especially misleading because sample sizes, noise levels, hypotheses, and model assumptions can differ.
P Values and Confidence Intervals
For many standard tests, a two sided hypothesis test and a confidence interval tell closely related stories when they use the same model and confidence level. If a 95 percent confidence interval for a mean difference excludes zero, the matching two sided test will usually have p < 0.05.
Confidence intervals add information that a p value does not. They show a range of effect sizes that are reasonably compatible with the data and model. A narrow interval around a tiny effect can be statistically significant but practically unimportant.
Statistical Significance vs Practical Significance
Statistical significance asks whether the data are sufficiently unusual under a null model. Practical significance asks whether the size of the effect matters in the real decision.
Consider a standardized effect of only 0.10. In an approximate two group normal test, the p value is about 0.48 with 100 observations per group, but about 0.025 with 1,000 per group. The effect size did not change. The precision changed because the sample became much larger.
| Measure | What it tells you | What it does not tell you |
|---|---|---|
| P value | Compatibility of data with a null model | Size or importance of the effect |
| Effect size | Magnitude on a meaningful scale | Uncertainty by itself |
| Confidence interval | Range of plausible effect values under the model | Whether the design supports causation |
| Statistical power | Chance of detecting specified effects under a design | Whether a detected effect is important |
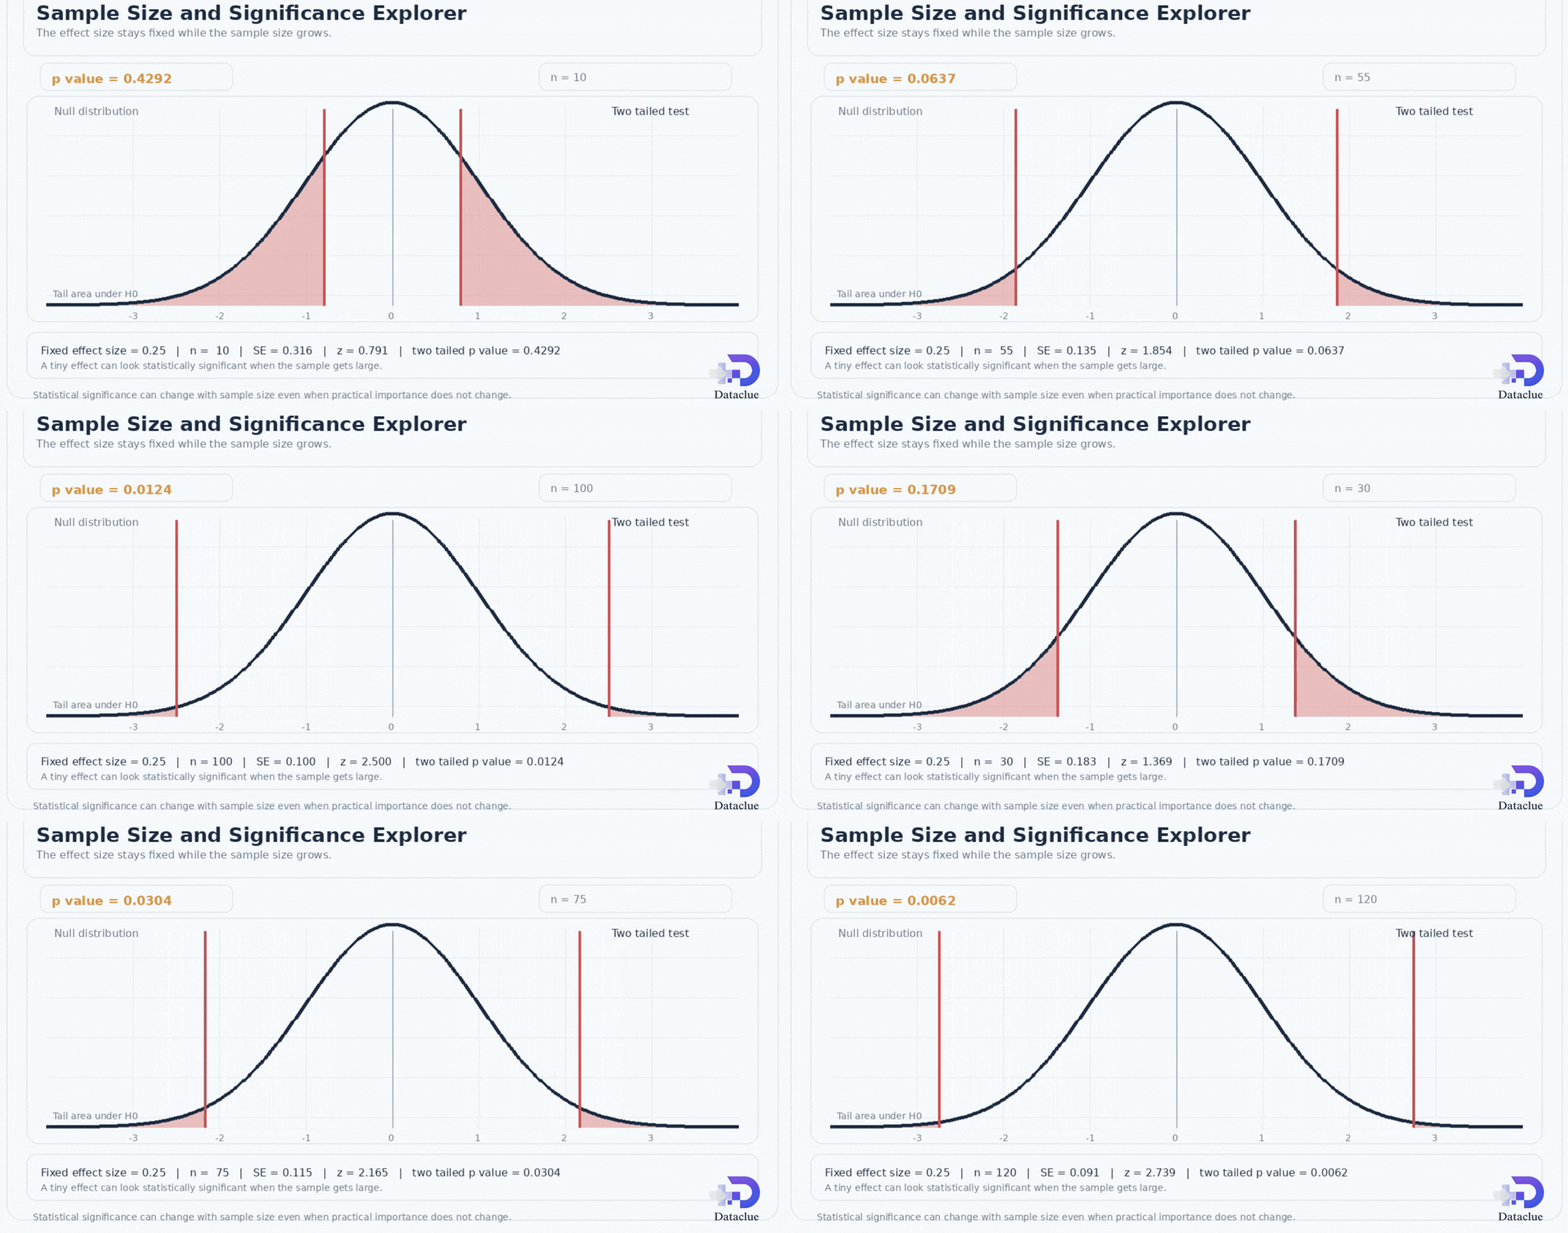
Sample size and significance explorer
The standardized effect is fixed at 0.10. Move the sample size to see how precision changes the p value.
P Value Decision Tables
A decision table can be a quick reminder, but evidence labels should not be treated as universal laws. Different fields and decisions can need different thresholds, corrections, or loss functions.
| P value range | At alpha = 0.05 | Possible wording | Caution |
|---|---|---|---|
| p > 0.10 | Do not reject H₀ | Little evidence against H₀ from this test | Could reflect low power |
| 0.05 < p ≤ 0.10 | Do not reject H₀ | Result is not significant at 0.05 | Do not call it almost significant without context |
| 0.01 < p ≤ 0.05 | Reject H₀ | Evidence against H₀ under the model | Check effect size and multiplicity |
| 0.001 < p ≤ 0.01 | Reject H₀ | Strong incompatibility with H₀ | Still check design and assumptions |
| p ≤ 0.001 | Reject H₀ | Very strong incompatibility with H₀ | Not proof of a large or causal effect |
Five Common P Value Misconceptions
The same errors appear in classrooms, dashboards, reports, and research papers. Correcting them makes the analysis much easier to trust.
| Wrong statement | Why it is wrong | Better statement |
|---|---|---|
| The p value is the probability H₀ is true. | The probability is calculated assuming H₀. | It is a tail probability of the data under H₀. |
| p < 0.05 proves H₁. | A test does not prove a hypothesis. | The result is statistically significant under the stated rule. |
| p > 0.05 proves no effect. | A nonsignificant test can be imprecise or underpowered. | The study did not provide enough evidence to reject H₀. |
| Statistically significant means important. | P values do not measure magnitude. | Report effect size and real world meaning. |
| A significant p value guarantees replication. | Replication depends on the true effect, design, and uncertainty. | Treat replication as a separate evidence question. |
Caution When Using P Values
P values can be distorted by the way a study is designed and analyzed. Testing many outcomes creates more chances to find a small p value. P hacking happens when analysts try many choices and report only the ones that cross a threshold. Selective reporting creates a similar problem by hiding null or inconvenient results.
Optional stopping can also change error rates when researchers repeatedly look at the data and stop as soon as significance appears without using a design that accounts for that behavior. Low power, weak measurements, model violations, missing data, and confounding can make a neat p value look more convincing than the study deserves.
Transparency helps. Predefine major hypotheses when possible. Report all planned analyses. Use multiplicity adjustments when needed. Show effect sizes and confidence intervals. Explain deviations from the analysis plan.
How to Report P Values
A good statistical sentence reports the estimate, uncertainty, test statistic, degrees of freedom when relevant, and exact p value when practical. It then explains what the result means for the research question.
Example: The simulated training group scored 4.0 points higher on average than the comparison group, Welch t = 2.10, df = 76.9, p = 0.039. The estimated difference is statistically significant at alpha = 0.05, but its practical importance should be judged from the score scale and confidence interval.
Avoid reporting only p < 0.05 when software gives a useful exact value. For extremely small values, a bound such as p < 0.001 may be clearer than printing many zeros. Never write p = 0 just because software rounds to zero.
Correct P Value Interpretation Templates
One sample test: If the population parameter equaled the null value, a sample result at least this far from the null value would occur with probability p under the test assumptions.
Two group test: If the two population parameters were equal, a difference at least this extreme would occur with probability p under the test assumptions.
Regression: If the true coefficient were zero, a coefficient test statistic at least this extreme would occur with probability p under the fitted model assumptions.
Chi square: If the categorical variables were independent, a chi square statistic at least this large would occur with probability p under the model.
Two tailed test: If H₀ were true, a result at least this far from the null value in either direction would occur with probability p.
The One Crucial Distinction
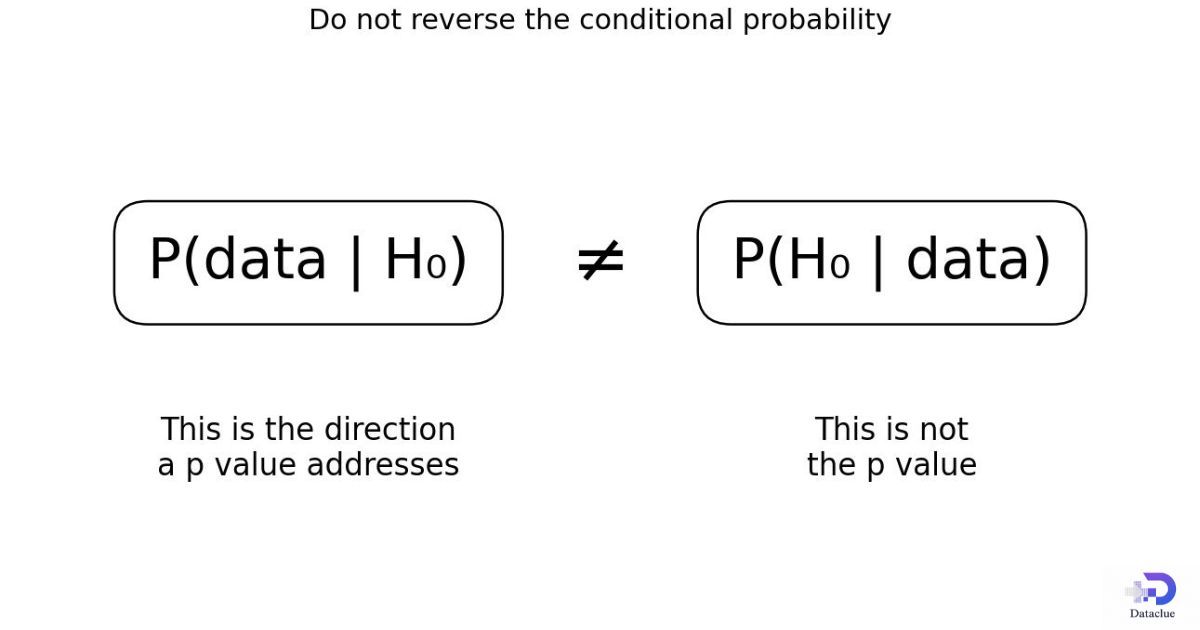
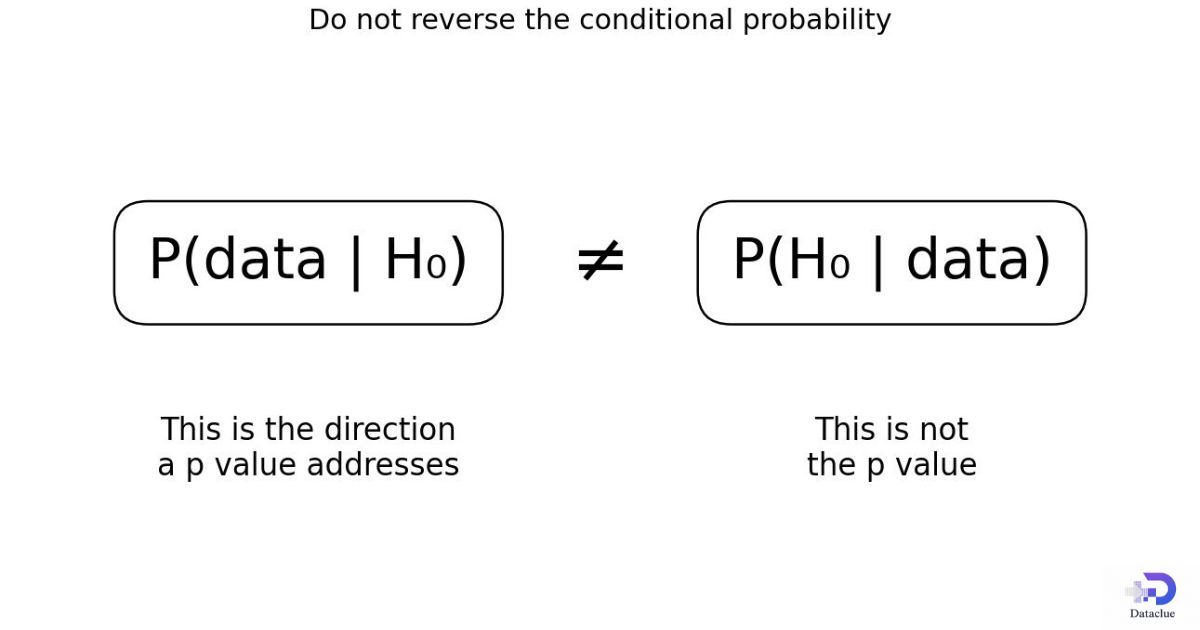
The p value addresses P(data | H₀). It does not give P(H₀ | data). Those expressions reverse what is conditioned on, and they answer different questions.
To estimate a probability for a hypothesis given data, you need a framework that models probabilities for hypotheses or parameters, such as a Bayesian analysis with stated prior information. A frequentist p value does not perform that reversal.
Related Statistical Concepts
Null hypothesis: the reference claim used for the test. Alternative hypothesis: the competing claim. Test statistic: a standardized summary that measures departure from H₀. Sampling distribution: the distribution the statistic would have under repeated sampling and stated assumptions.
Standard error measures the sampling variability of an estimate. Degrees of freedom help define t, chi square, and F reference distributions. Type I error is a false positive under H₀. Type II error is failure to reject H₀ when a specified alternative is true. Power is the chance of rejecting H₀ for a specified effect under the design.
Effect size describes magnitude. A confidence interval describes uncertainty around an estimate. Multiple comparison methods adjust inference when many hypotheses are tested.
P Value Calculator
A useful calculator should ask for the test family, the test statistic, degrees of freedom when needed, and the tail choice. It should return the p value and a plain English interpretation. The HTML version of this article includes a working z and t calculator.
For a z test, a two tailed result can be calculated with 2 × P(Z ≥ |z|). For a t test, replace the normal distribution with the t distribution and use the correct degrees of freedom. Do not use a calculator until the correct test and alternative hypothesis are clear.
P Value Reference Cheat Sheet
Use this table as a memory aid, not as a substitute for checking the assumptions of the chosen test.
| Symbol or term | Meaning |
|---|---|
| p | Tail probability under the null model |
| α | Preselected significance level |
| H₀ | Null hypothesis |
| H₁ | Alternative hypothesis |
| z | Standard normal test statistic |
| t | t distribution test statistic |
| χ² | Chi square test statistic |
| F | F test statistic |
| df | Degrees of freedom |
| SE | Standard error |
| β | Regression coefficient or parameter symbol, depending on context |
| Power | Probability of rejecting H₀ for a specified alternative |
| Confidence interval | Range of parameter values compatible with the data and model at a stated confidence level |
Test Taking Strategies
On an exam, start a p value interpretation with the null condition in context. Then say as extreme or more extreme. For a two tailed test, mention either direction or the same distance from the null value.
Check whether the alternative hypothesis is left tailed, right tailed, or two tailed before finding the probability. A positive test statistic does not automatically mean a right tailed test. The tail comes from H₁.
Finally, keep the probability direction correct. Do not write the probability that H₀ is true. Write the probability of the observed level of extremeness under H₀.
Frequently Asked Questions About P Values
What is a p value in simple terms?
It is a probability that describes how unusual the observed test statistic is under a stated null model.
What does p = 0.05 mean?
Under H₀ and the test assumptions, results at least this extreme have probability 0.05. It does not mean H₀ has a 5 percent chance of being true.
Is a smaller p value always better?
No. It shows greater incompatibility with H₀ in that test, but it does not measure effect size, study quality, or importance.
Can a p value be greater than 1?
No. A p value is a probability and stays between 0 and 1.
Can a p value equal zero?
Mathematical tail probabilities can be extraordinarily small, but software may print zero because of numerical precision. Report an appropriate bound rather than claiming literal proof.
What is the difference between p value and alpha?
Alpha is chosen before the result as a decision threshold. The p value is calculated from the data and model.
How do you calculate a p value by hand?
Compute the test statistic, identify its null distribution, then find the planned tail area using a table or distribution calculation.
How does sample size affect a p value?
Larger samples usually reduce standard errors, so the same effect size can produce a smaller p value.
What is the relationship between p values and confidence intervals?
Matching two sided tests and confidence intervals often give the same threshold decision when they use the same model and level.
How should p values be interpreted in regression?
They test a coefficient against a null value under the model assumptions. They do not prove causation.
Does p > 0.05 mean there is no effect?
No. It means the study did not provide enough evidence to reject H₀ under the planned rule.
Should p values be reported with effect sizes?
Yes. Effect sizes and confidence intervals help readers judge magnitude and uncertainty.
What is p value and its formula?
A p value is the probability of getting a result as extreme as, or more extreme than, the one observed, assuming the null hypothesis is true. There is no single formula for every p value because the calculation depends on the statistical test. For a two tailed z test, a common formula is:
p = 2 × [1 − Φ(|z|)]
Here, z is the z statistic and Φ is the standard normal cumulative distribution function.
What is the p value problem?
The main p value problem is misuse and misinterpretation. A p value does not tell you the probability that the null hypothesis is true. It also does not measure effect size or practical importance. Problems can also arise from p hacking, repeated testing, selective reporting, and treating 0.05 as a strict line between true and false findings.
What is a good p value?
There is no universal good p value. A lower p value usually shows stronger incompatibility with the null hypothesis, but it does not mean the result is more important. Many studies use 0.05 as a significance level, but the right threshold depends on the field, research design, risks, and decision being made.
What does a P value of 0.05 mean?
A p value of 0.05 means that, if the null hypothesis and model assumptions were correct, there would be about a 5 percent chance of observing a result this extreme or more extreme. It does not mean there is a 5 percent chance that the null hypothesis is true.
Conclusion
A p value is a tail probability calculated under a null hypothesis and a statistical model. It measures how unusual the observed test statistic is under that model. It does not give the probability that the null hypothesis is true and does not measure the size or importance of an effect.
The calculation starts with a valid test statistic, then uses the correct null distribution and tail. The interpretation should name H₀, describe the observed level of extremeness, and keep the conditional probability in the right direction.
Use p values as one part of a complete analysis. Report effect estimates, confidence intervals, study design, assumptions, sample size, and practical meaning. That gives readers a much stronger basis for a scientific, business, health, or policy decision.
Sources and Further Reading
- American Statistical Association. Statement on Statistical Significance and P Values.
- NIST Engineering Statistics Handbook. Critical Values and P Values.
- Google Search Central. Creating Helpful, Reliable, People First Content.
- Google Search Central. SEO Starter Guide.
- numiqo. P Value: A Beginner’s Guide.
- Statistics Fundamentals. P Values and Hypothesis Testing resources.
- Investopedia. P Value: What It Is, How to Calculate It, and Examples.
- Albert. AP Statistics Review: Interpreting P Values.
- Scribbr. Understanding P Values: Definition and Examples.