
P Value: Meaning, Formula, Examples, and Interpretation
A p value helps you judge how unusual your data would be if the null hypothesis were true. This guide explains the meaning, calculation, examples, common mistakes, and better ways to report results.
P Value: Meaning, Calculation, Examples & Interpretation |
|
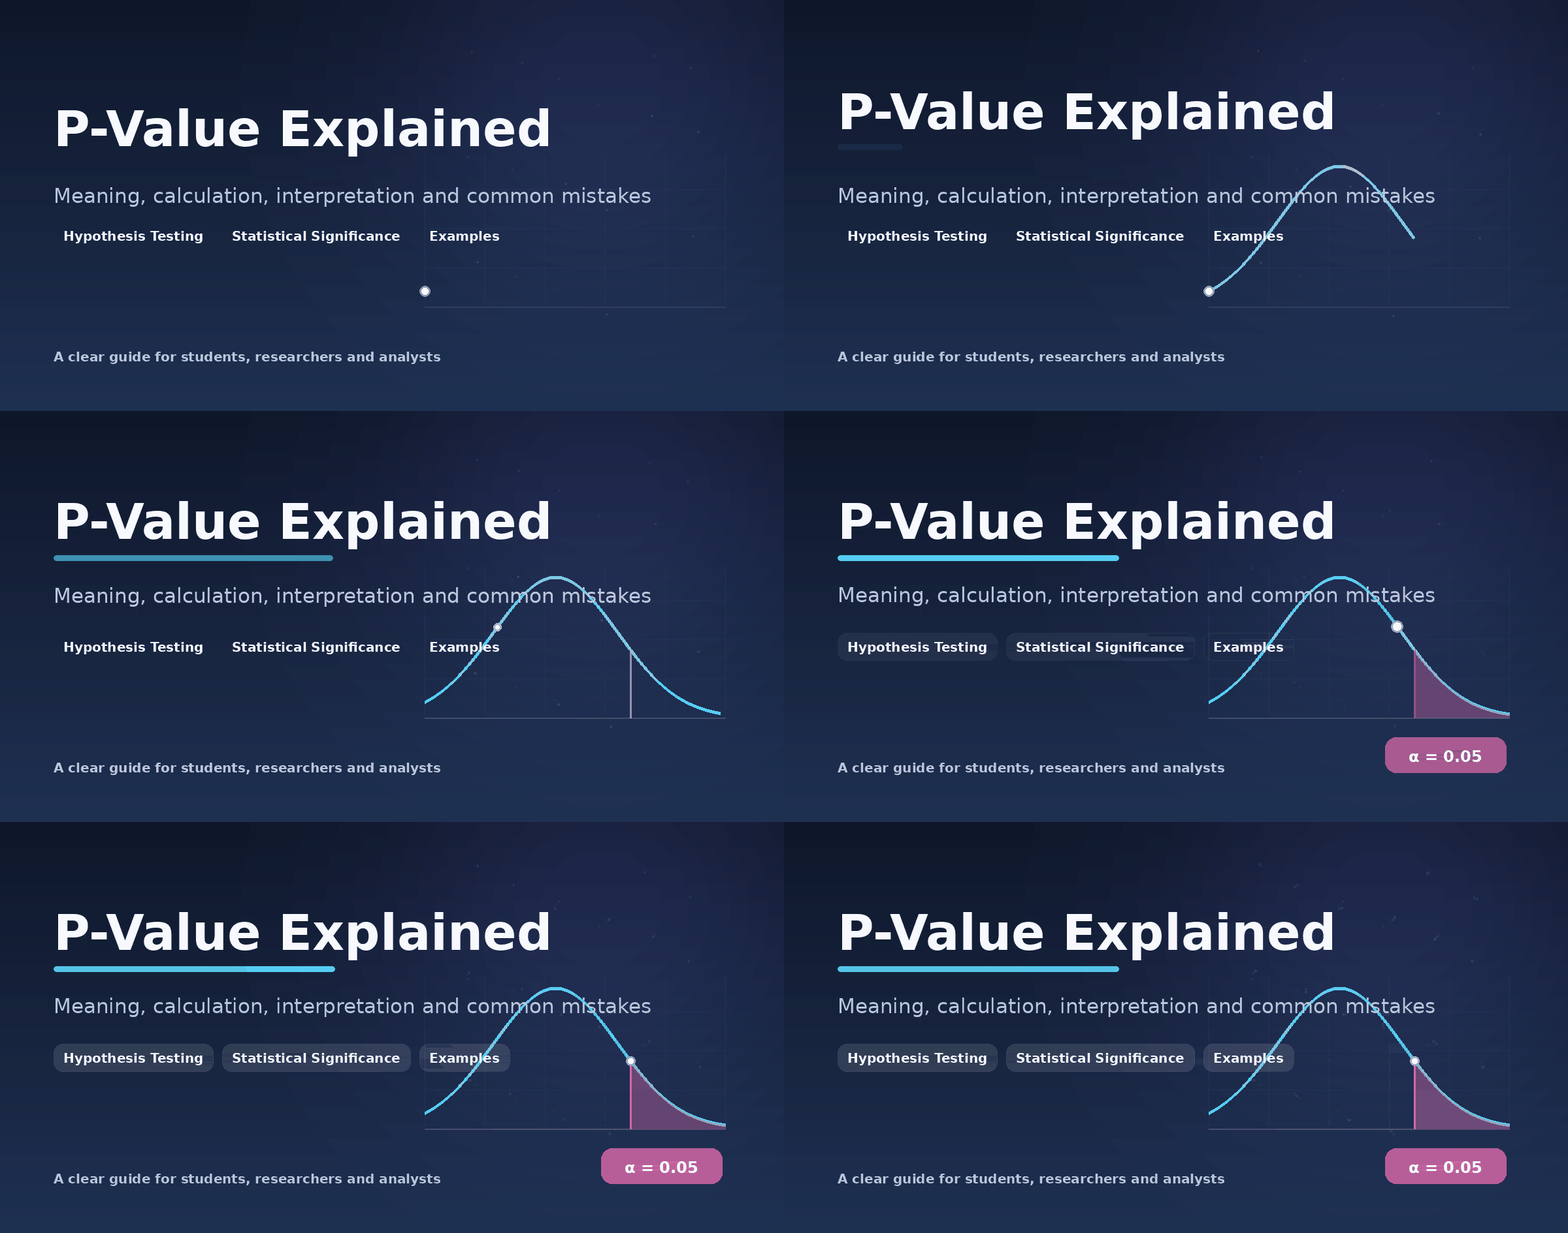
| A p value helps you judge how unusual your data would be if the null hypothesis were true. This guide explains the meaning, calculation, examples, common mistakes, and better ways to report results |
On this page
- What Is a P Value?
- P Values and Hypothesis Testing
- How to Interpret a P Value
- What Does P Less Than 0.05 Mean?
- How to Calculate a P Value
- Worked P Value Example
- One Tailed Versus Two Tailed P Values
- Common P Value Misinterpretations
- P Value, Effect Size, and Confidence Interval
- Factors That Affect a P Value
- Limits of P Values and Responsible Use
- How to Report a P Value
- P Value FAQ
- Conclusion
A p value is one of the most used numbers in research. It is also one of the most misunderstood. Students often hear that p less than 0.05 proves a result is real. That statement is not correct.
A p value tells you how unusual your test result would be if the null hypothesis and the statistical model were correct. A small p value gives more conflict with that null model. It does not tell you the chance that the null hypothesis is true.
This guide explains p value meaning, calculation, interpretation, common errors, and clear reporting. It also shows why effect size, confidence intervals, sample size, and study design belong in the same story.
What Is a P Value?
A p value is the probability, under the null hypothesis and the chosen statistical model, of getting a test result at least as extreme as the one observed. It shows how well the data fit the null model. It does not show the chance that the null hypothesis is true.
Suppose a school tries a new teaching method. Test scores rise by two points. Did the method help, or could normal sample variation explain the change? A p value helps answer that narrow question.
The formal definition sounds harder than the idea. First, act as if the null hypothesis is true. Next, ask how often the test would produce a result as far from the null value as the one you found. That tail probability is the p value.
The words at least as extreme matter. A hypothesis test counts the observed result and results that would disagree with the null model even more. In a two sided test, this often includes both tails of the reference distribution.
The p value depends on a model. It can only be trusted when the data, design, test, and assumptions fit the research question. The American Statistical Association says p values can show how incompatible the data are with a stated statistical model. It also warns that they do not give the probability that a hypothesis is true. [1]
P Values and Hypothesis Testing
Hypothesis testing starts with a claim about a population. Since we rarely measure every person or item, we use a sample. The sample gives an estimate, but random variation makes that estimate move.
The null hypothesis, written as H0, gives a clear starting claim. It may state that a treatment has no effect, two group means are equal, or a population value equals a fixed number. The alternative hypothesis, written as H1 or Ha, states what kind of difference the study is looking for.
A statistical test turns the sample result into a test statistic. The test statistic measures how far the result is from the null value, while also allowing for noise and sample size. The p value is then found from the reference distribution for that statistic.
Researchers also choose a significance level, called alpha. A common choice is 0.05, but it is only a convention. It should be chosen before the result is known. Penn State describes the common decision rule clearly: reject H0 when p is less than or equal to alpha, and fail to reject H0 when p is greater than alpha. [3]
This rule supports a decision. It does not prove that either hypothesis is true. A study can reject a null model that is only slightly wrong, or fail to reject one because the sample is too small.
The basic decision rule
- When p is less than or equal to alpha, reject the null hypothesis.
- When p is greater than alpha, fail to reject the null hypothesis.
- Always report the result with the estimate, uncertainty, and study context.
How to Interpret a P Value
A p value should be read as a continuous number. A value of 0.049 and a value of 0.051 are very close. The evidence does not change sharply at 0.05. The threshold only changes the usual decision label.
A smaller p value means the observed result is less compatible with the null model, under the test assumptions. It does not tell you how large the effect is. It also does not show the chance that your conclusion is wrong.
| P value | Decision when alpha is 0.05 | Responsible interpretation |
|---|---|---|
| 0.20 | Fail to reject H0 | The result is quite compatible with the null model. This does not prove no effect. |
| 0.08 | Fail to reject H0 | The result does not cross the 0.05 line. The estimate and interval still matter. |
| 0.03 | Reject H0 | The result is fairly unusual under the null model. Check effect size and assumptions. |
| 0.001 | Reject H0 | The result is very unusual under the null model. Bias or a poor model can still mislead. |
Do not turn these values into fixed grades such as weak, strong, or perfect proof. The same p value can have a different meaning in a small pilot study, a large clinical trial, or a quality control check.
What Does P Less Than 0.05 Mean?
When p is less than 0.05, the observed test result would occur less than 5 percent of the time under the stated null model, when we count results at least as extreme. If alpha was set at 0.05, the usual decision is to reject the null hypothesis.
It does not mean there is a 95 percent chance that the research claim is true. It does not mean there is only a 5 percent chance that the result came from chance. Those statements reverse the condition inside the calculation.
The 0.05 level became common because it offers a simple decision rule. It is not a law of nature. The American Statistical Association warns against making scientific, business, or policy decisions only because a p value crosses a set line. [1]
Treat p equals 0.049 and p equals 0.051 as close results. Report the exact values, the effect estimate, the confidence interval, and any limits in the design. That gives readers more useful information than the words significant or not significant alone.
How to Calculate a P Value
There is no single p value formula for every study. The calculation depends on the test statistic and its reference distribution. A t test uses a t distribution. A chi square test uses a chi square distribution. Analysis of variance uses an F distribution.
Software often performs the final probability step. You still need to choose the correct test and check its assumptions. A precise output from the wrong test is still the wrong answer.
Common tests include z-tests, one-sample t-tests, independent t-tests, paired t-tests, chi-square tests, analysis of variance, correlation tests, and regression coefficient tests. NIST explains the same core idea: the p value is the probability of a statistic at least as extreme as the observed one, given that the null hypothesis is true. [2]
State the null and alternative hypotheses.
Define the population claim and the direction of the test.
Choose the right statistical test.
Match the test to the design, variable type, sample structure, and assumptions.
Calculate the test statistic.
Combine the effect estimate, its standard error, and any needed model terms.
Find the reference distribution.
Use the distribution expected for the statistic when H₀ is true.
Calculate the tail probability.
Measure the probability of obtaining the observed result or one that is even more extreme.
Compare the p value with α.
Compare the p value with the significance level that was chosen before analysing the data.
Report the complete result.
Include the statistical test, test statistic, degrees of freedom, p value, confidence interval, and effect size.
General tail probability
For a right-sided test: p = P(T is at least as large as the observed statistic, given H0). For a left-sided test: p = P(T is at least as small as the observed statistic, given H0). For a two sided test, include results at least as extreme in both relevant directions.
Worked P Value Example
The following teaching example uses invented data. A school wants to know whether a new study plan changes the average exam score from the usual value of 75 points.
The p value says that a t statistic this far from zero, or farther, would occur about 4.1 percent of the time under the null model. Since 0.041 is below 0.05, the result crosses the chosen decision line.
The result does not prove that the plan caused the higher score. The study design still matters. Perhaps the students were not randomly selected, another teacher gave the test, or the exam was easier. The 1.8 point estimate and its confidence interval also help the school judge whether the change is useful.
This example shows why a p value should not stand alone. The effect is modest, and the lower end of the interval is close to zero. A larger or better controlled study could give a clearer answer.
| Research question | Does the study plan change the average score? |
|---|---|
| Null hypothesis | H0: the population mean is 75. |
| Alternative hypothesis | Ha: the population mean is not 75. |
| Sample | 40 students have a mean score of 76.8 and a standard deviation of 5.4. |
| Test | Two sided one sample t test. |
| Test statistic | t = 2.11 with 39 degrees of freedom. |
| P value | p = 0.041. |
| Alpha level | 0.05, chosen before the analysis. |
| Decision | Reject H0 at the 0.05 level. |
| Estimated change | 1.8 points above the null value. |
| 95 percent confidence interval | About 0.07 to 3.53 points above the null value. |
| Standardized effect | Cohen d is about 0.33, which is a modest effect in many settings. |
One Tailed Versus Two Tailed P Values
A one tailed test looks for a result in one stated direction. For example, a factory may test whether a new process lowers the defect rate. A two tailed test looks for a change in either direction.
Choose the direction before you inspect the data. Changing to a one tailed test after seeing the result can make the p value look smaller and raise the risk of a false positive. It also ignores a result in the other direction, even when that result could matter.
Do not assume that every one tailed p value equals half of a two tailed value. That shortcut works only for some symmetric tests, with a result in the planned direction. The exact relation depends on the test and its distribution.
A useful plot shades the tail area beyond the observed test statistic. In a two sided test, the matching tail on the other side is also included. The animated figure near the top of the HTML version shows this idea.
Common P Value Misinterpretations
P values are easy to calculate but easy to explain badly. The myths below can change the meaning of a study, so correct them before publication.
|
Myth: The p value is the chance that H0 is true. Fact: It is calculated while H0 is treated as true. It does not give a probability for H0 |
Myth: p equals 0.03 means a 3 percent chance that chance caused the result. Fact: It means results this extreme would occur about 3 percent of the time under the stated null model. |
|
Myth: A large p value proves there is no effect. Fact: It shows that the data do not give enough conflict with the null model. Low power may be the reason. |
Myth: A smaller p value means a larger effect. Fact: Sample size and noise also shape the p value. Use the effect estimate to judge size. |
|
Myth: p less than 0.05 proves the research idea. Fact: It supports rejection of one null model under a set of assumptions. It does not prove cause or truth. |
Myth: p greater than 0.05 means the study failed. Fact: A clear estimate, a useful interval, or an important design lesson can still add value |
|
Myth: Results on opposite sides of 0.05 must conflict. Fact: p value equals 0.04 and p value equals 0.06 can come from very similar estimates and uncertainty. |
Myth: The p value shows practical importance. Fact: Effect size, cost, benefit, risk, and subject knowledge show whether a result matters. |
P Value, Effect Size, and Confidence Interval
A p value answers one narrow question. An effect size answers a different one. It describes how large the observed difference or link is. A confidence interval shows a range of effect values that are reasonably compatible with the data and model.
These three numbers work best together. The p value shows compatibility with a null value. The effect size shows magnitude. The confidence interval shows precision. Research guidance often recommends reporting effect sizes and confidence intervals with p values. [4][5]
| Measure | Main question | What it adds |
|---|---|---|
| P value | How unusual is the test result under H0? | A measure of compatibility with the null model. |
| Effect size | How large is the observed effect? | The size of the difference or relationship. |
| Confidence interval | How precise is the estimate? | A range of values compatible with the data and model. |
A 95 percent confidence interval does not mean there is a 95 percent chance that the fixed population value lies inside this one interval. In repeated studies using the same method, about 95 percent of the calculated intervals would cover the true value, when the assumptions hold.
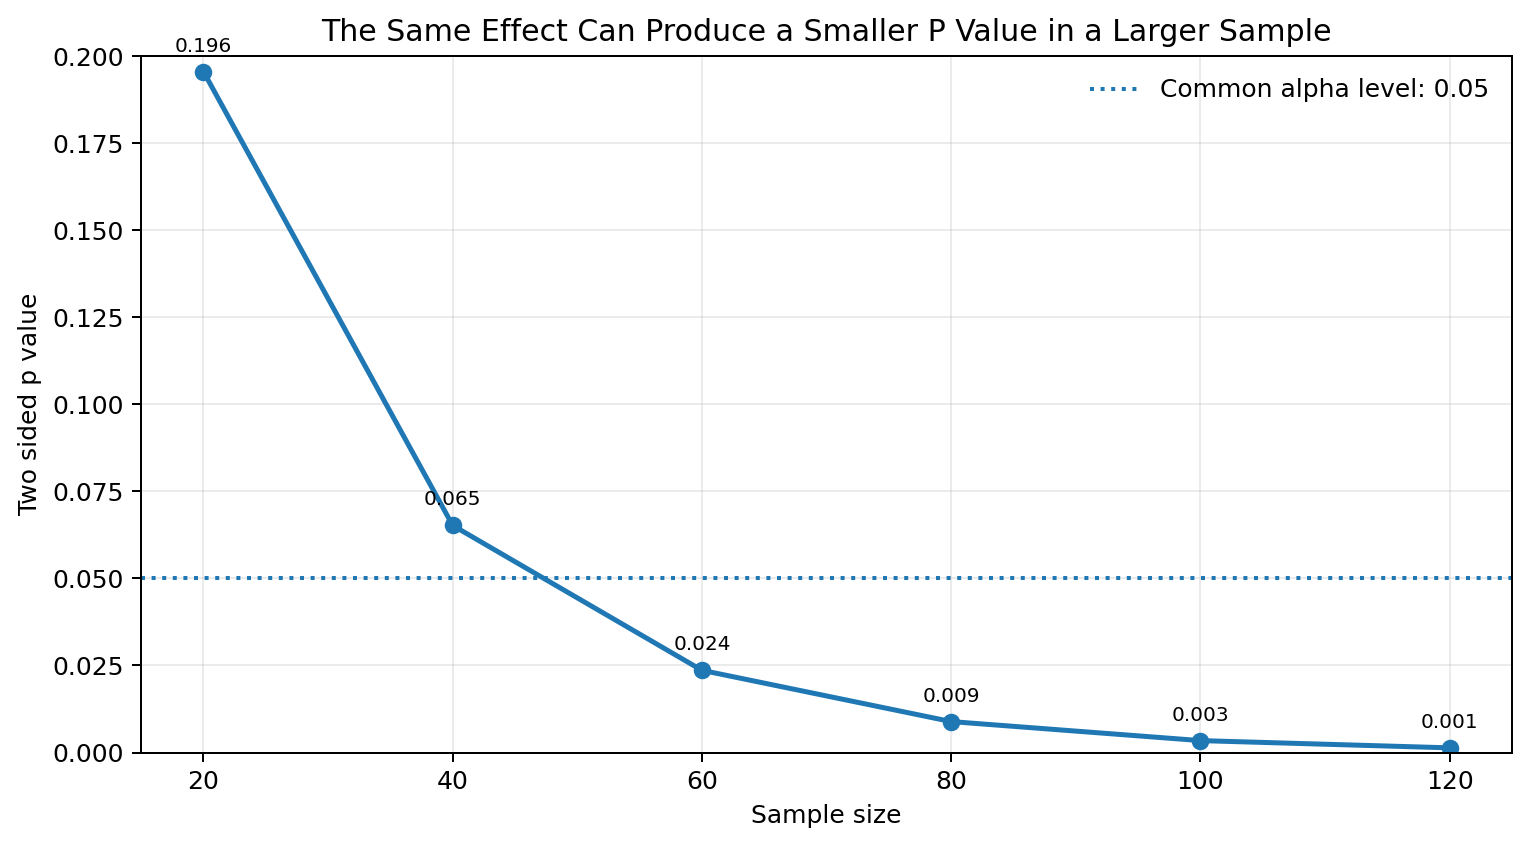
A very large sample can make a tiny effect produce a small p value. A small sample can leave a useful effect with a large p value. The plot below keeps the standardized effect fixed and changes only the sample size. The p value falls as the estimate becomes more precise.
Factors That Affect a P Value
The p value changes when the effect, sample, noise, or model changes. This is why two studies can report different values even when they ask a similar question.
A smaller p value does not prove that a study has better design. Good research starts with a clear question, a sound plan, accurate measures, suitable analysis, and full reporting.
- Effect size: A result farther from the null value usually gives a smaller p value.
- Sample size: More data often reduce the standard error and make small effects easier to detect.
- Data variation: Noisy data produce less precise estimates and often larger p values.
- Measurement quality: Weak or inconsistent measures can hide real effects or create bias.
- Test choice: Different tests use different assumptions and reference distributions.
- One sided or two sided plan: The direction changes which tail areas are counted.
- Outliers and missing data: They can change estimates, errors, and the test result.
- Multiple comparisons: Testing many claims raises the chance that at least one small p value appears.
- Researcher choices: Trying many models and reporting only the smallest value can make evidence look stronger than it is.
Limits of P Values and Responsible Use
P values remain useful when researchers use them for the question they actually answer. Problems begin when a single number becomes a pass mark for truth, importance, or publication.
P hacking means trying many analyses, outcomes, groups, or stopping rules until a small p value appears. Selective reporting hides the tests that did not cross the line. Publication bias can then fill the research record with positive results while quieter findings remain unseen.
Multiple testing creates another risk. If you test enough true null hypotheses at alpha 0.05, some results will cross the line by chance. Researchers can plan a main outcome, limit tests, use a suitable adjustment, or control a false discovery rate.
Low power also causes trouble. A small study may miss a real effect and give a wide interval. When only small p values are published, the effects that survive can also look larger than they truly are.
The ASA does not say that p values have no use. Later ASA guidance describes them as valid measures that can help communicate uncertainty when used well. The practical lesson is balance. Use the p value with estimates, intervals, design details, checks, and subject knowledge. [1][5]
A responsible reading checklist
- Was the research question set before the analysis?
- Was alpha chosen before the result was known?
- Does the statistical test fit the design and data?
- Are the effect size and confidence interval reported?
- Were missing data, outliers, and multiple tests handled openly?
- Does the result matter in the real setting?
How to Report a P Value
Good reporting lets the reader see what was tested and what the result means. Do not write only significant or not significant. Give the estimate and its uncertainty.
This format gives the direction, size, precision, test, and p value in one sentence. It also avoids claiming more than the design can support. Reporting guides now stress effect sizes and intervals because a p value alone is not enough. [5][6]
- Name the test: State the statistical test and whether it was one tailed or two tailed.
- Give the statistic: Report the test statistic and degrees of freedom when they apply.
- Report the exact value: Use p equals 0.032 instead of p less than 0.05 when practical.
- Do not report p equals 0.000: Use p less than 0.001 or a more precise value.
- Add the effect estimate: Tell the reader how large the difference or link was.
- Add a confidence interval: Show the precision and the range of compatible effects.
- Explain corrections: State any adjustment used for multiple comparisons.
- Use careful verbs: Say the result supports, suggests, or is consistent with. Do not say it proves the hypothesis.
Clear reporting exampleExample: Students scored an estimated 1.8 points higher than the null value, 95 percent confidence interval 0.07 to 3.53, t(39) = 2.11, p = 0.041, two sided.
P Value FAQ
What is a p value in simple terms?A p value tells you how unusual your result would be if the null hypothesis and the statistical model were correct. A small value means the observed data are hard to explain under that null model. It does not tell you the chance that the null hypothesis is true.
What does p less than 0.05 mean?It means the result would be this extreme, or more extreme, less than 5 percent of the time under the stated null model. With an alpha level of 0.05, the usual decision is to reject the null hypothesis. The result still needs context.
What does p greater than 0.05 mean?It means the data do not cross the chosen 0.05 decision line. You usually fail to reject the null hypothesis. This does not prove there is no effect. The study may have a small sample, wide uncertainty, weak measures, or a true effect that is hard to detect.
Is a lower p value always better?No. A lower p value can show greater conflict with the null model, but it does not prove that the study is better. Large samples, model choices, bias, repeated testing, and data quality can all affect the value.
Can a p value be zero?A reported p value should not be written as zero. Statistical software may round a very small value to 0.000. Report it with a useful limit, such as p less than 0.001, or give the exact value when the software provides enough precision.
Is 0.05 always the correct significance level?No. The right alpha level depends on the field, the decision, and the cost of a false positive. Researchers should choose it before looking at the results. Some work needs a stricter level, while other work may focus more on estimation and uncertainty.
What is the difference between a p value and alpha?The p value comes from the data and the chosen test. Alpha is a decision level set before the analysis. Researchers often use 0.05. When p is less than or equal to alpha, they usually reject the null hypothesis.
What is the difference between statistical and practical significance?Statistical significance asks whether the data conflict enough with a null model to cross a chosen line. Practical significance asks whether the effect is large enough to matter in real life. A result can be statistically clear but too small to matter.
Can a nonsignificant result still be important?Yes. It may show an effect with wide uncertainty, reveal limits in the study, or rule out some large effects. The estimate and confidence interval often tell a fuller story than the p value alone.
Should p values be reported with confidence intervals?Yes, in most research reports. The p value helps describe compatibility with a null model. The confidence interval shows the range and precision of the estimated effect. Together with the effect size, they give readers a clearer view.
How does sample size affect the p value?Larger samples usually give more precise estimates. For the same observed effect, a larger sample can produce a smaller p value. This is why a tiny effect may look statistically significant in a very large study.
What is the difference between one tailed and two tailed tests?A one tailed test looks for an effect in one stated direction. A two tailed test allows either direction. The direction should be chosen before the data are inspected. A one tailed value is not always found by simply dividing a two tailed value by two.
Conclusion
A p value is a conditional probability. It asks how often a test result this extreme would appear under a stated null model. A small value can support rejection of that model, but it does not prove a research claim.
Use the exact p value as one part of the evidence. Read it with the effect size, confidence interval, sample size, assumptions, study design, and real world importance. That approach gives a clearer and more honest answer than any single cutoff can provide.
This article provides general educational information about statistical interpretation. The right analysis and interpretation depend on the study design, assumptions, data quality, and research context.
References
- American Statistical Association. ASA Statement on Statistical Significance and P Values. 2016.
- NIST SEMATECH e Handbook of Statistical Methods. Critical Values and P Values. accessed 2026.
- Penn State STAT ONLINE. Hypothesis Testing: P Value Approach. accessed 2026.
- Journal of Graduate Medical Education. Using Effect Size, or Why the P Value Is Not Enough. 2012.
- Journal of Graduate Medical Education. How to Use and Report on P Values. 2024.
- European Journal of Epidemiology. Statistical Tests, P Values, Confidence Intervals, and Power: A Guide to Misinterpretations. 2016.