R Squared and Pearson Correlation: Regression Accuracy
A regression line gives us a prediction rule. This lesson asks the next question: how close are the predictions, how much variation does the line explain, and how strong is the linear relationship between X and Y?
dataclue Team··8 min read
R Squared and Pearson Correlation: How Good Is a Regression Relationship?
A regression line gives us a prediction rule. This lesson asks the next question: how close are the predictions, how much variation does the line explain, and how strong is the linear relationship between X and Y?
Explain total, explained, and unexplained variation.
Calculate and interpret r squared.
Calculate and interpret Pearson r.
Explain why correlation does not prove causation.
Use r = ±√(byxbxy).
Part A: Regression Accuracy
Actual Values, Predicted Values, and Errors
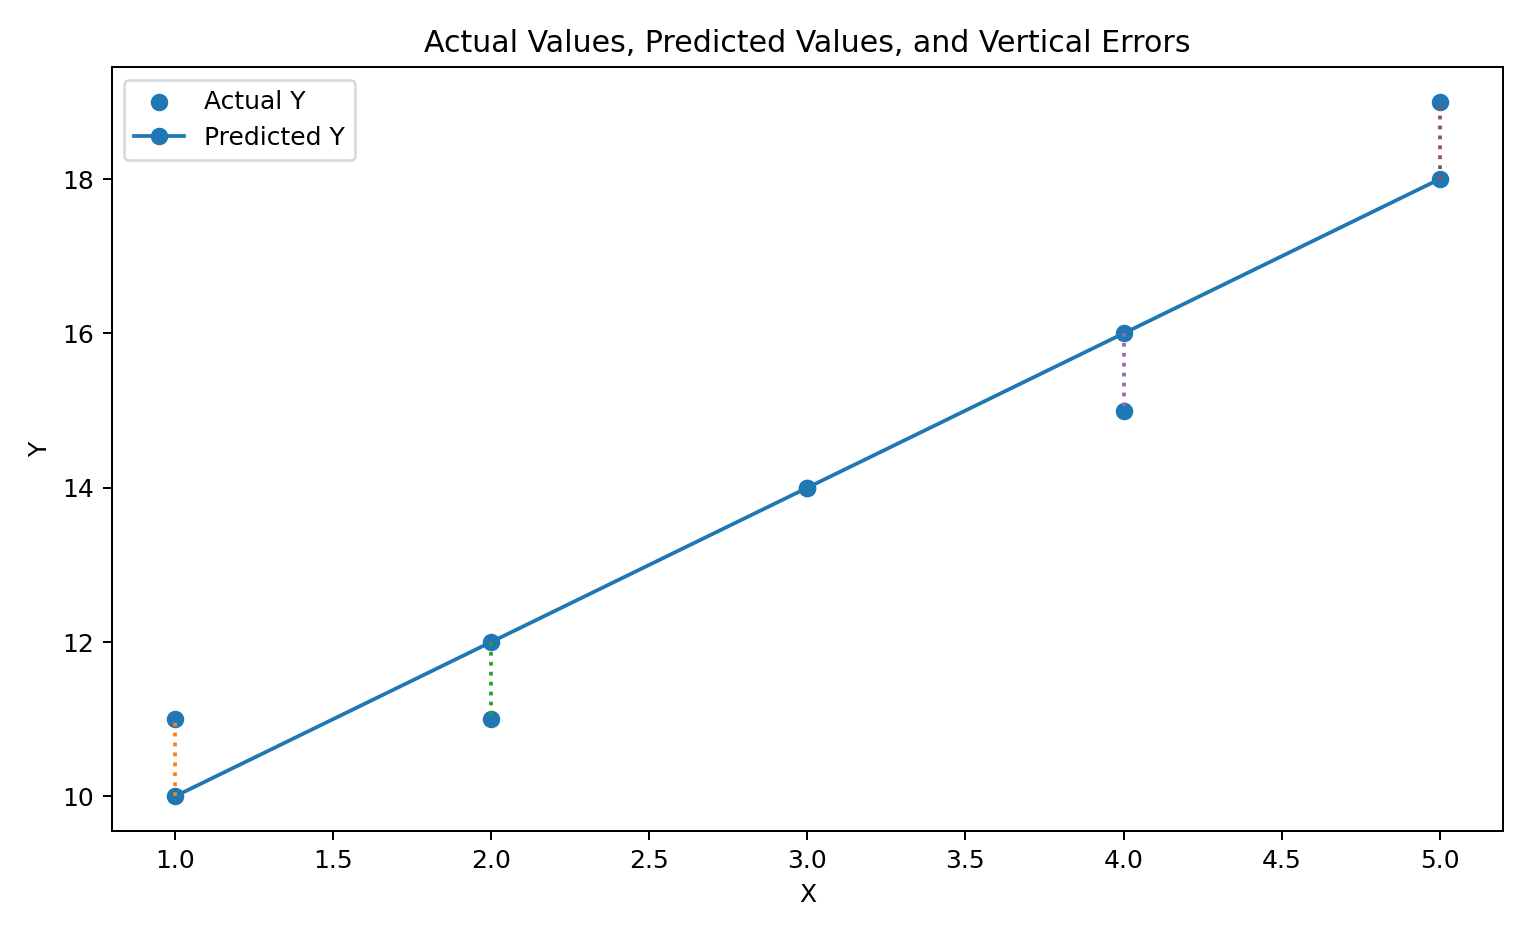
The data give us an observed value of Y. The fitted regression line gives us a predicted value, written as Y hat. Their difference is the prediction error.
ei = Yi − Ŷi
A positive error means the observed point is above the fitted line. A negative error means it is below the line.
X
Actual Y
Predicted Ŷ
Y − Ŷ
(Y − Ŷ)²
1
11
10.0
1.0
1.0
2
11
12.0
-1.0
1.0
3
14
14.0
0.0
0.0
4
15
16.0
-1.0
1.0
5
19
18.0
1.0
1.0
Observed values, predicted values, and vertical prediction errors.
Animated residual explorer
Press play to reveal each observed point, its predicted point, and the vertical error.
Play residualsReset
Standard Error of Estimate
The standard error of estimate summarizes the typical vertical spread of observed Y values around the fitted regression line.
sy.x = √[ Σ(Yi − Ŷi)² / (n − 2) ]
For our example, the sum of squared errors is 4. With five observations:
sy.x = √(4/3) = 1.155
The standard error is about 1.15 Y units.
Total, Explained, and Unexplained Variation
Type
Formula
Meaning
Total variation
Σ(Y − Ȳ)²
Total movement of observed Y values around their mean.
Explained variation
Σ(Ŷ − Ȳ)²
The part represented by the fitted regression line.
Unexplained variation
Σ(Y − Ŷ)²
The part left in prediction errors.
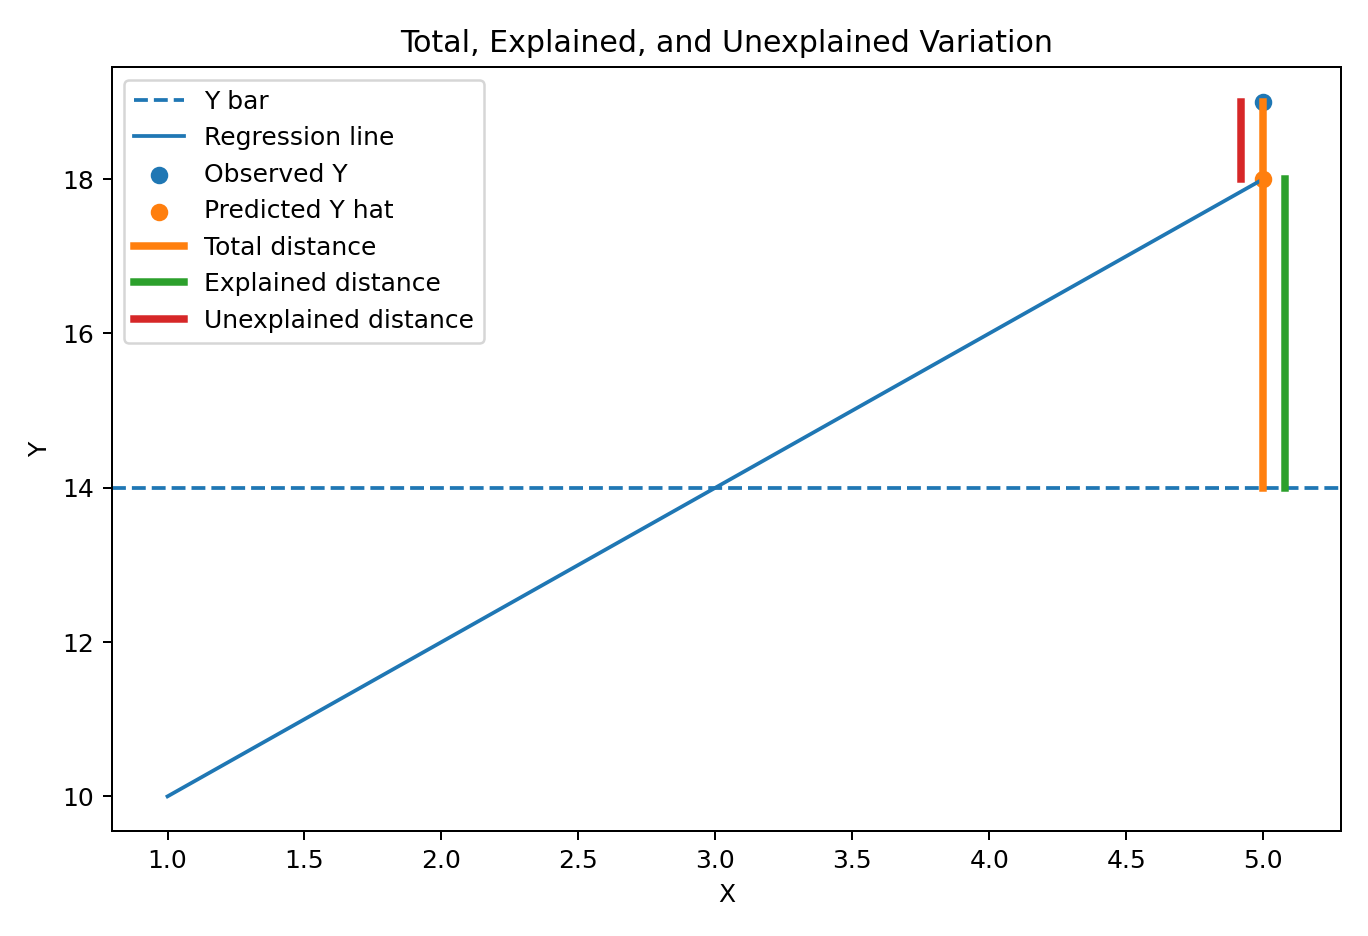
Total Variation = Explained Variation + Unexplained Variation
The chapter's variation idea recreated as an original web diagram.
Animated variation decomposition
Reveal the mean, predicted value, observed value, and the three distances.
Play explanationReset
Worked Variation Calculation
The mean of Y is Ȳ = 14.
Total variation = Σ(Y − Ȳ)² = 44
Unexplained variation = Σ(Y − Ŷ)² = 4
Explained variation = Σ(Ŷ − Ȳ)² = 40
44 = 40 + 4
Coefficient of Determination, R Squared
R squared is the proportion of total variation in Y explained by its linear relationship with X in the fitted simple regression model.
r² = Explained Variation / Total Variation
r² = 1 − Unexplained Variation / Total Variation
r² = 40/44 = 0.9091
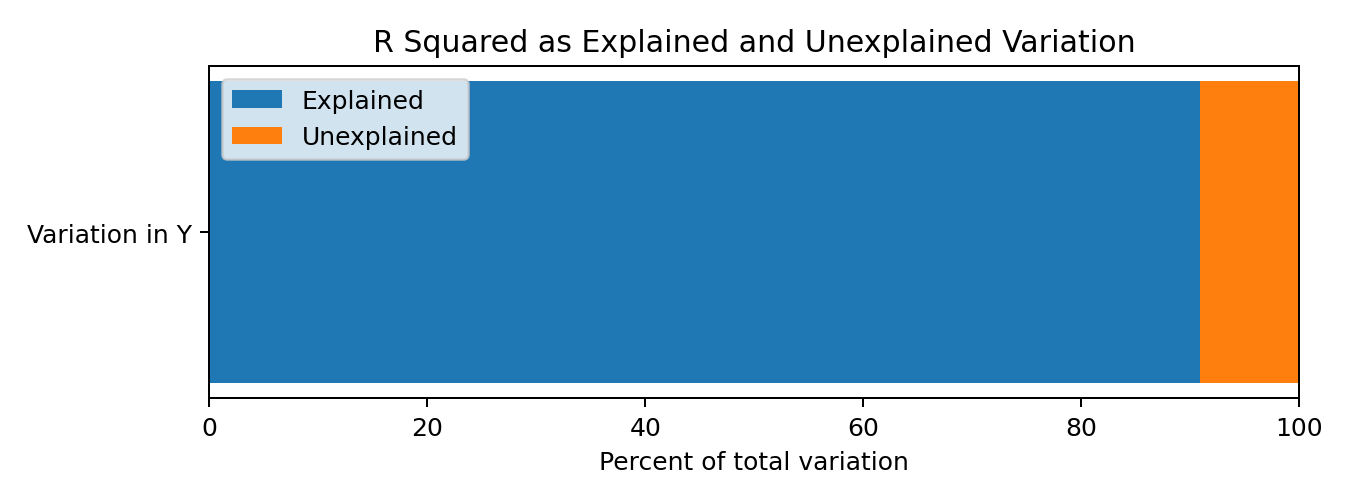
About 90.9 percent of the variation in Y is explained by the fitted linear relationship. About 9.1 percent remains unexplained by this model.
Important: R squared does not tell us what percentage of Y is caused by X.
R squared divides total variation into explained and unexplained shares.
R squared interpretation slider
r²:0.64
64 percent explained, 36 percent unexplained.
r²
Explained
Unexplained
Plain English reading
0.00
0%
100%
The fitted linear relationship explains none of the observed variation.
0.25
25%
75%
One quarter of the variation is explained.
0.50
50%
50%
Half of the variation is explained.
0.80
80%
20%
Most of the variation is explained.
1.00
100%
0%
All observed Y values lie on the fitted line.
Part B: Pearson Correlation
What Correlation Measures
Regression and correlation answer different questions. Regression explains or predicts Y from X. Correlation measures the strength and direction of linear association between two variables.
Correlation Versus Covariance
Covariance shows whether two variables tend to move in the same or opposite direction. Its size depends on the units. Correlation standardizes this movement.
ρ = Cov(X,Y) / √[Var(X) Var(Y)]
Feature
Covariance
Correlation
Main idea
Joint direction of movement
Standardized strength and direction of linear association
Units
Depends on X and Y units
No measurement unit
Fixed range
No fixed range
From minus 1 to plus 1
Comparison
Harder across scales
Easier across scales
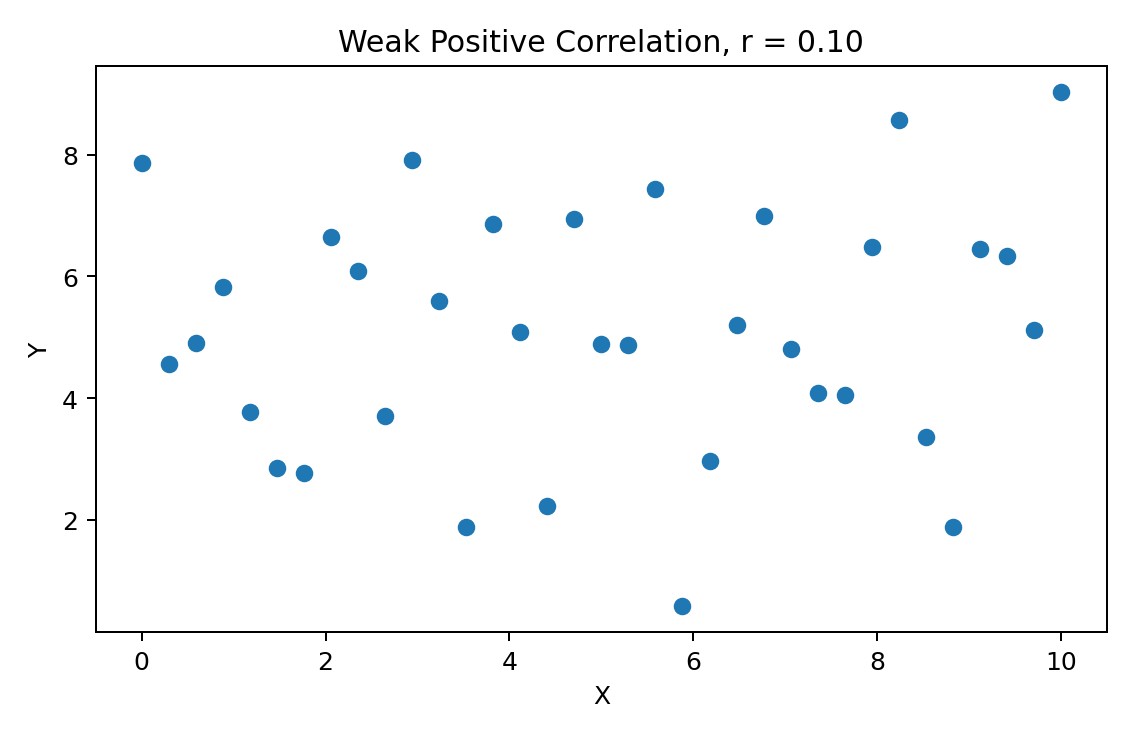
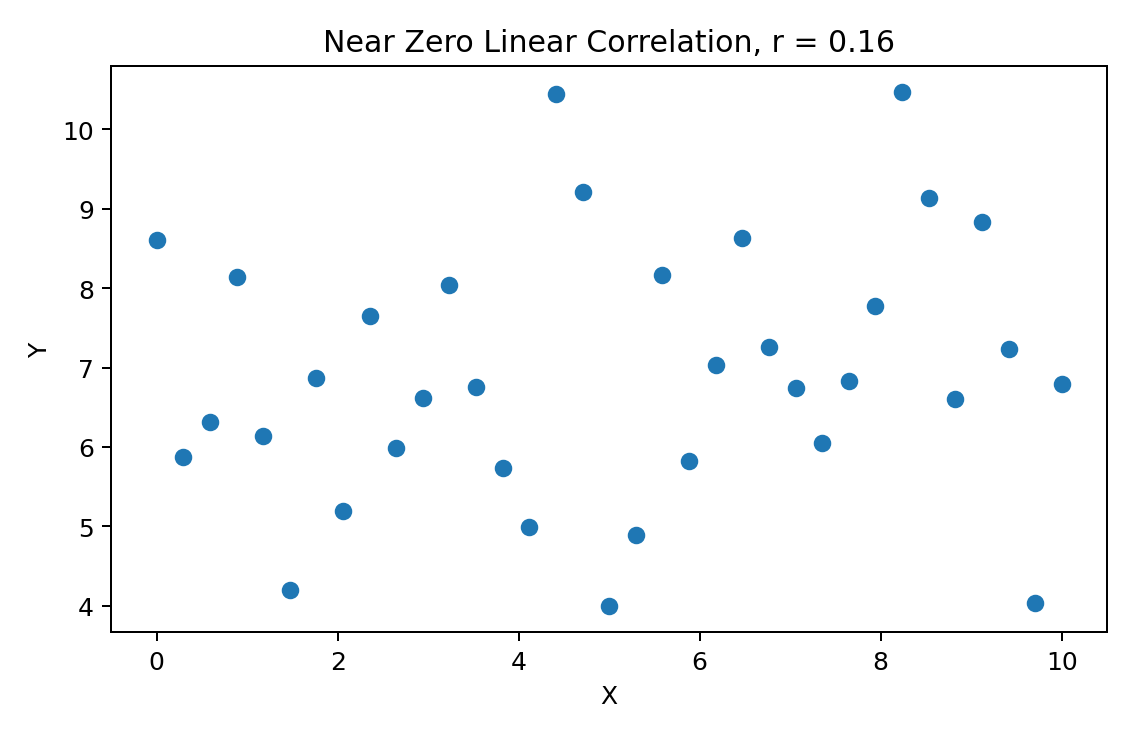
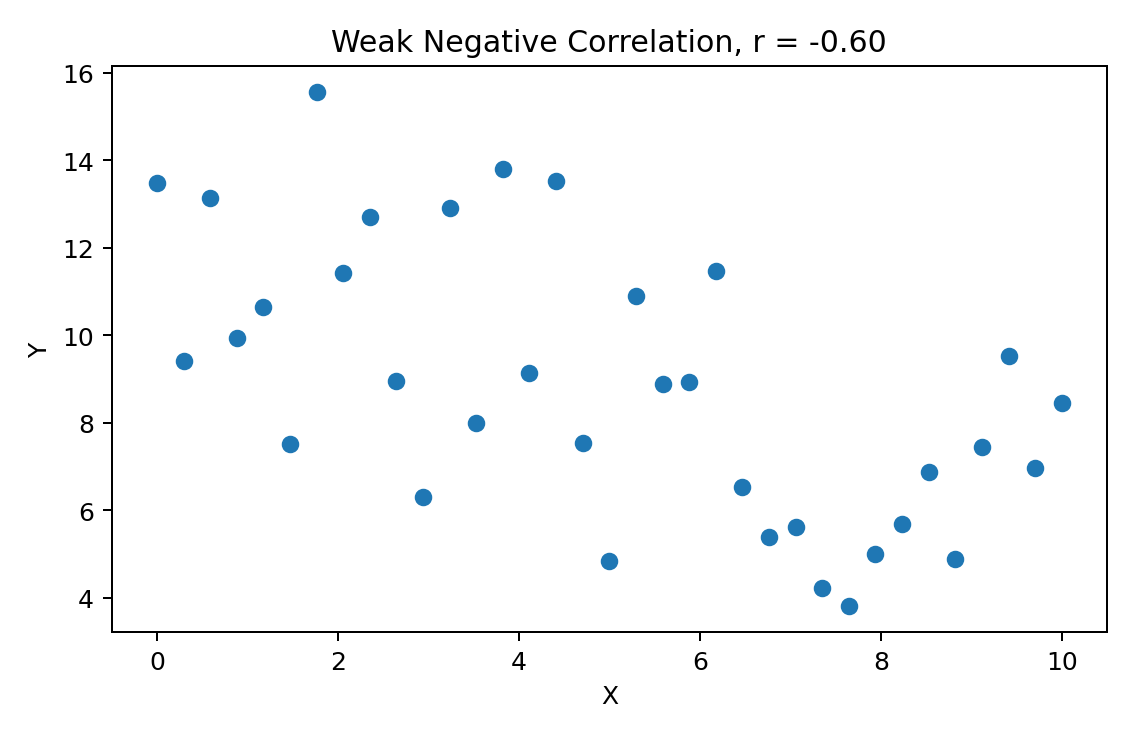
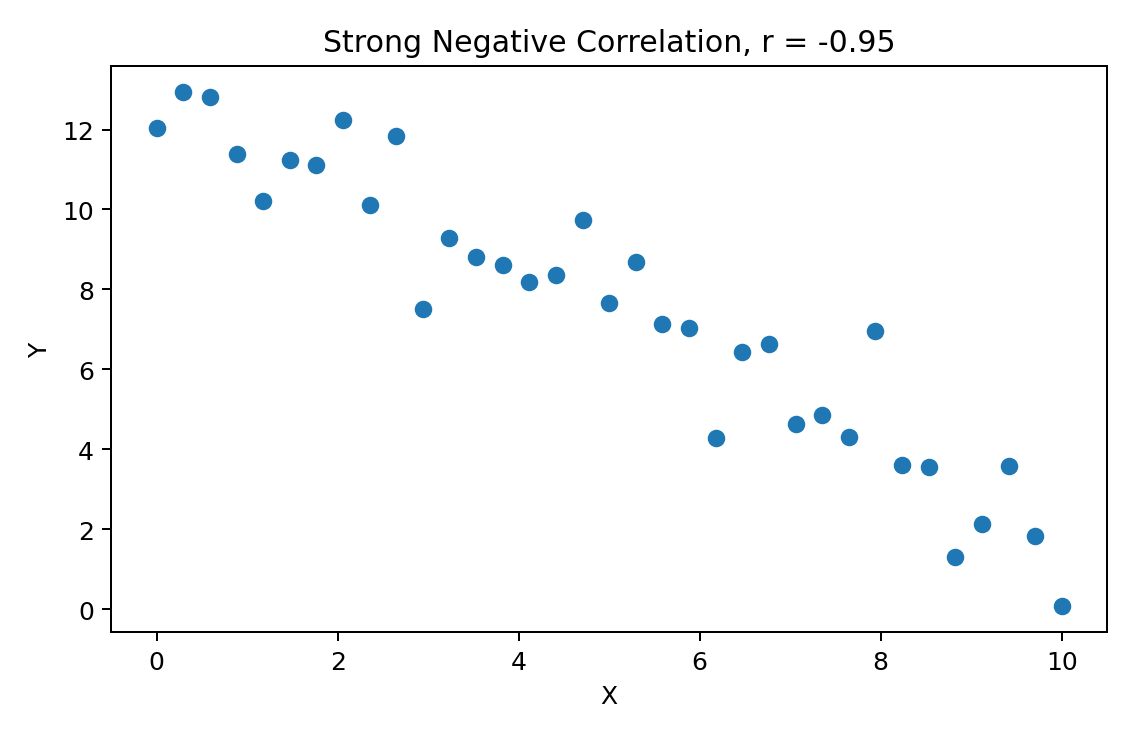
Positive, Negative, and Near Zero Linear Correlation
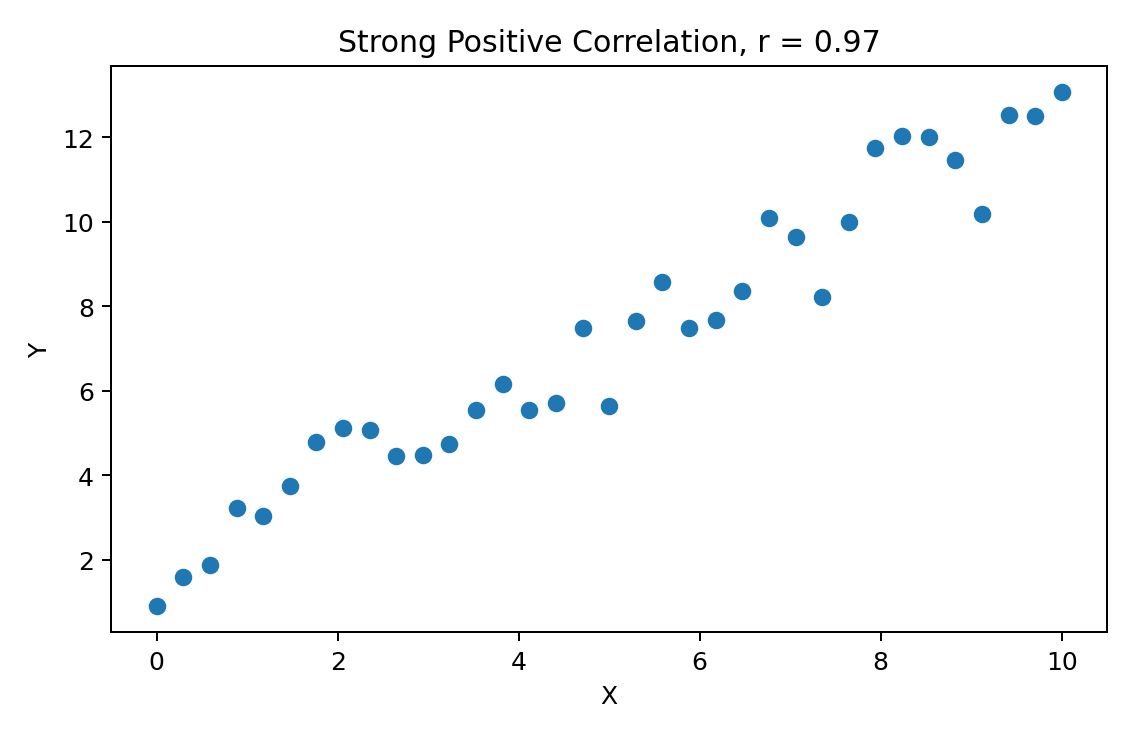
Strong Positive Correlation. Pearson r is about 0.97.
Weak Positive Correlation. Pearson r is about 0.10.Near Zero Linear Correlation. Pearson r is about 0.16.Weak Negative Correlation. Pearson r is about -0.60.Strong Negative Correlation. Pearson r is about -0.95.
Pearson Product Moment Correlation Coefficient
r = Σ(X − X̄)(Y − Ȳ) / √[Σ(X − X̄)² Σ(Y − Ȳ)²]
For the worked data, X̄ = 3 and Ȳ = 14.
X
Y
X−X̄
Y−Ȳ
(X−X̄)²
(Y−Ȳ)²
Cross product
1
11
-2
-3
4
9
6
2
11
-1
-3
1
9
3
3
14
0
0
0
0
0
4
15
1
1
1
1
1
5
19
2
5
4
25
10
r = 20 / √(10 × 44) = 0.9535
The value is positive and close to plus 1, so these data have a strong positive linear association.
Both formulas give the same answer apart from rounding.
Range and Interpretation
−1 ≤ r ≤ 1
Value or sign
Meaning
r = +1
Perfect positive linear correlation.
0 < r < 1
Positive linear correlation.
r near 0
Little or no linear correlation.
−1 < r < 0
Negative linear correlation.
r = −1
Perfect negative linear correlation.
The Link Between r and r Squared
In simple linear regression, the square of Pearson r is the coefficient of determination.
r² = coefficient of determination
For our example, r = 0.9535 and r² = 0.9091. This matches the explained variation calculation.
Correlation Does Not Imply Causation
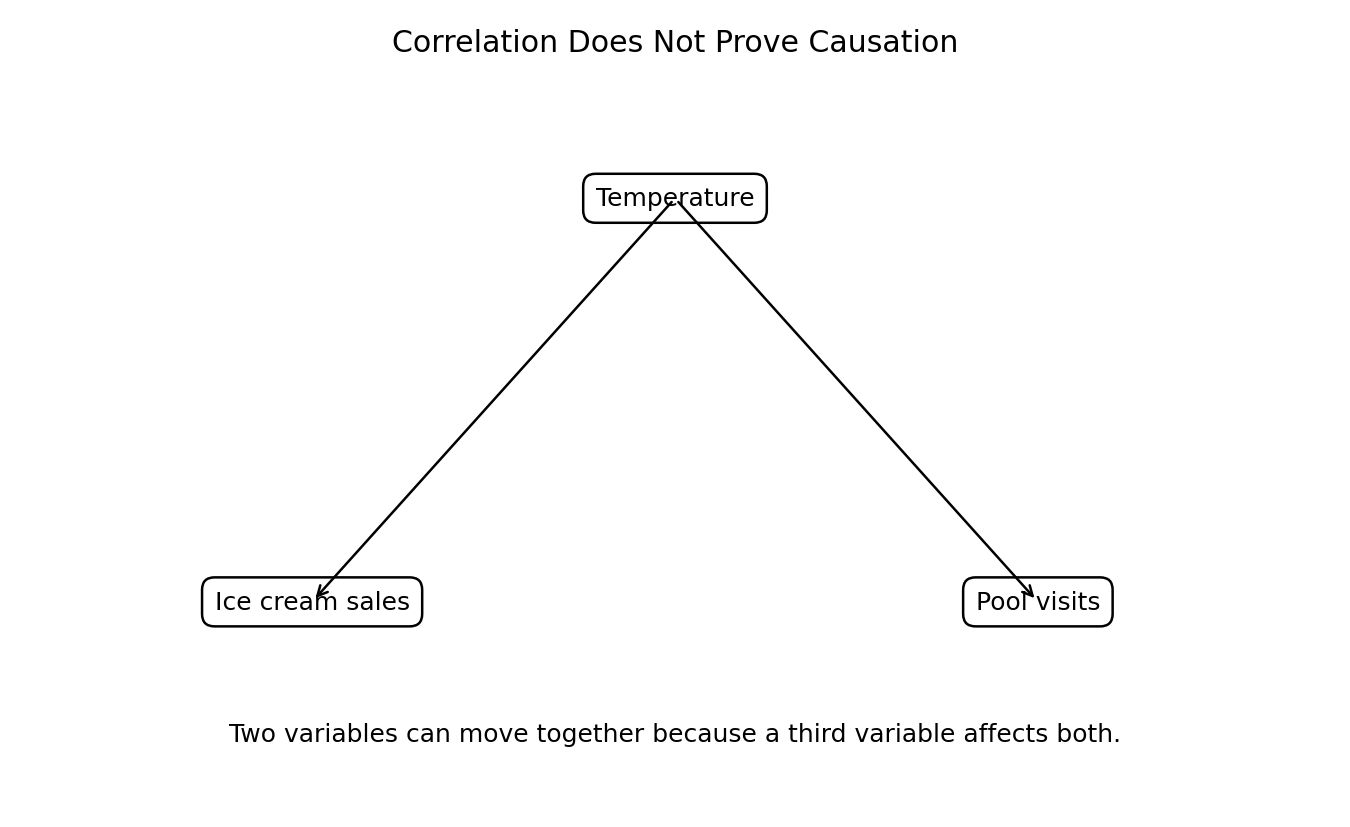
A high correlation does not prove that changes in X cause changes in Y. A third variable can affect both. The direction of cause can also be unclear.
A third variable can create a strong association between two other variables.
Exam focus: Correlation shows association. It does not identify cause and effect by itself.
Model answer: Correlation means two variables move together, but a hidden variable, reverse direction, or another explanation may produce that movement. Extra evidence is needed before making a causal claim.
Properties of Pearson Correlation
Property
Plain English meaning
rXY = rYX
Switching X and Y does not change the correlation.
−1 ≤ r ≤ 1
Correlation always stays inside this fixed range.
Independent of origin and scale
Changing units or shifting the zero point does not change r when direction is preserved.
Regression Coefficients and Correlation
r = ±√(byxbxy)
The sign of r follows the common sign of the two regression coefficients.
bYX
bXY
Product
r
0.50
0.72
0.36
+0.60
−0.40
−0.90
0.36
−0.60
Regression Versus Correlation
Feature
Regression
Correlation
Main purpose
Explain or predict Y from X
Measure strength and direction of linear association
Variable roles
Y and X have different roles
X and Y are symmetric
Main result
Regression equation and predicted values
A coefficient r
Units
Slope depends on units
r has no units
Direction
Slope sign
Sign of r
Causation
Does not prove causation by itself
Does not prove causation
Common Mistakes
Calling r squared the percentage of Y caused by X.
Saying r near zero proves that no relationship exists.
Forgetting that r squared cannot be negative.
Confusing actual Y with predicted Y hat.
Using covariance and correlation as though they have the same scale.
Treating strong correlation as proof of cause and effect.
Formula Revision Table
Concept
Formula
Meaning
Prediction error
eᵢ = Yᵢ − Ŷᵢ
Observed minus predicted
Standard error
√[Σ(Y−Ŷ)²/(n−2)]
Typical vertical prediction spread
Total variation
Σ(Y−Ȳ)²
Total movement around the mean
Explained variation
Σ(Ŷ−Ȳ)²
Part represented by the line
Unexplained variation
Σ(Y−Ŷ)²
Part left in errors
R squared
Explained / Total
Explained proportion
Pearson r
Centered cross product divided by deviation lengths
Linear direction and strength
Range of r
−1 ≤ r ≤ 1
Fixed scale
Regression coefficients
r = ±√(bYX bXY)
Correlation from two regression coefficients
Frequently Ask Questions
What does R squared mean in regression? R squared, also called the coefficient of determination, shows the proportion of variation in the dependent variable Y that is explained by its linear relationship with X. For example, if r2=0.80, then 80 percent of the variation in Y is explained by the fitted linear regression relationship, while 20 percent remains unexplained.
What is the difference between R squared and Pearson correlation? Pearson correlation, r, measures the strength and direction of a linear relationship between two variables. R squared measures the proportion of variation explained by the linear regression relationship. In simple linear regression, the coefficient of determination is r2.
What does the Pearson correlation coefficient tell us? The Pearson correlation coefficient measures the direction and strength of a linear relationship. Its value ranges from −1 to +1. A positive value shows a positive relationship, a negative value shows a negative relationship, and a value near zero shows little or no linear relationship.
Does a high correlation mean that one variable causes the other? No. Correlation shows association, not proof of cause and effect. Two variables may move together because another variable affects both, or because the direction of influence is unclear. The chapter specifically warns students not to interpret correlation as causation.
What is the relationship between correlation and regression coefficients? The correlation coefficient can be found from the two regression coefficients using:
r=±√byxbxy
The sign of r follows the common sign of the regression coefficients. If both regression coefficients are positive, r is positive. If both are negative, r is negative.