
Regional Price Parities by State: 2024 Cost Comparison
Regional Price Parities show how price levels differ across U.S. states in the same year. This guide compares all 50 states with 2024 BEA data, explains the national benchmark of 100, and shows how housing rents shape the cost of living picture.
Regional Price Parities: Compare Cost of Living by State
A 2024 BEA state comparison of price levels, housing rents, buying power, and the national benchmark of 100.
URL slug: /regional-price-parity-by-state/
Meta description: Compare regional price parity by state using 2024 BEA data. See state rankings, housing rent differences, maps, tables, and buying power context.
Excerpt: Regional Price Parities show how price levels differ across U.S. states in the same year. This guide compares all 50 states with 2024 BEA data, explains the national benchmark of 100, and shows how housing rents shape the cost of living picture.
Introduction
A regional price parity by state comparison gives a clearer view of how prices differ across the United States. The latest Bureau of Economic Analysis data show a wide gap between states. California had an all items RPP of 110.7 in 2024, while Arkansas was at 86.9. That means the average price level measured by BEA was much higher in California than in Arkansas during the same year.
Regional Price Parities, often called RPPs, are useful because a dollar does not buy the same amount everywhere. Housing, services, and other consumer prices can vary sharply by location. A national income figure may look strong, but its buying power can feel very different after local prices are considered.
This guide uses the 2024 state RPP release from BEA. It ranks all 50 states, compares housing rents with the all items index, maps the results, and explains what the numbers can and cannot tell you. The District of Columbia is discussed separately because it is not a state.
Quick Answer
Regional Price Parities compare price levels across places for the same year. The U.S. level equals 100. A state with an RPP of 110 has prices about 10 percent above the national level, while a state at 90 is about 10 percent below it. In 2024, California ranked highest among states at 110.7 and Arkansas ranked lowest at 86.9.
What Are Regional Price Parities?
Regional Price Parities are spatial price indexes produced by the U.S. Bureau of Economic Analysis. They measure differences in price levels across states and local areas for a given year. The national price level is set to 100, which gives every state a common benchmark.
The all items RPP covers consumption goods and services, including housing rents. BEA also publishes more detailed price indexes, including a separate measure for housing rents. These details help explain why two states with similar overall scores can still have very different housing costs.
RPP is not a personal budget calculator. It summarizes broad price differences across a place. A household that spends more on child care, medical care, rent, travel, or another category can face a cost pattern that differs from the state average.
How to Read an RPP of 100
Think of 100 as the national price level. A state at 105 is about 5 percent above the national level. A state at 95 is about 5 percent below it. This makes the index easy to compare without converting every category into dollars.
The 2024 median across the 50 states was about 96.7. Sixteen states had an all items RPP above 100, while 34 were below 100. No state landed exactly at 100 in the data used here.
A score below 100 does not mean every product or service is cheaper. It means the combined price level measured by BEA is lower than the national benchmark. The mix can vary by category.
U.S. State Price Level Snapshot
| Rank | State | All items RPP | Difference from 100 | Housing rents RPP | Position |
|---|---|---|---|---|---|
| 1 | California | 110.7 | +10.7 | 154.3 | Above U.S. level |
| 2 | Hawaii | 110.0 | +10.0 | 125.3 | Above U.S. level |
| 3 | New Jersey | 108.8 | +8.8 | 134.3 | Above U.S. level |
| 4 | New York | 107.9 | +7.9 | 122.2 | Above U.S. level |
| 5 | Washington | 107.0 | +7.0 | 126.0 | Above U.S. level |
| 6 | Massachusetts | 105.8 | +5.8 | 128.1 | Above U.S. level |
| 7 | Maryland | 105.0 | +5.0 | 121.1 | Above U.S. level |
| 8 | New Hampshire | 104.2 | +4.2 | 114.9 | Above U.S. level |
| 9 | Connecticut | 103.6 | +3.6 | 117.0 | Above U.S. level |
| 10 | Florida | 103.4 | +3.4 | 122.1 | Above U.S. level |
Regional Price Parity by State: Latest Rankings
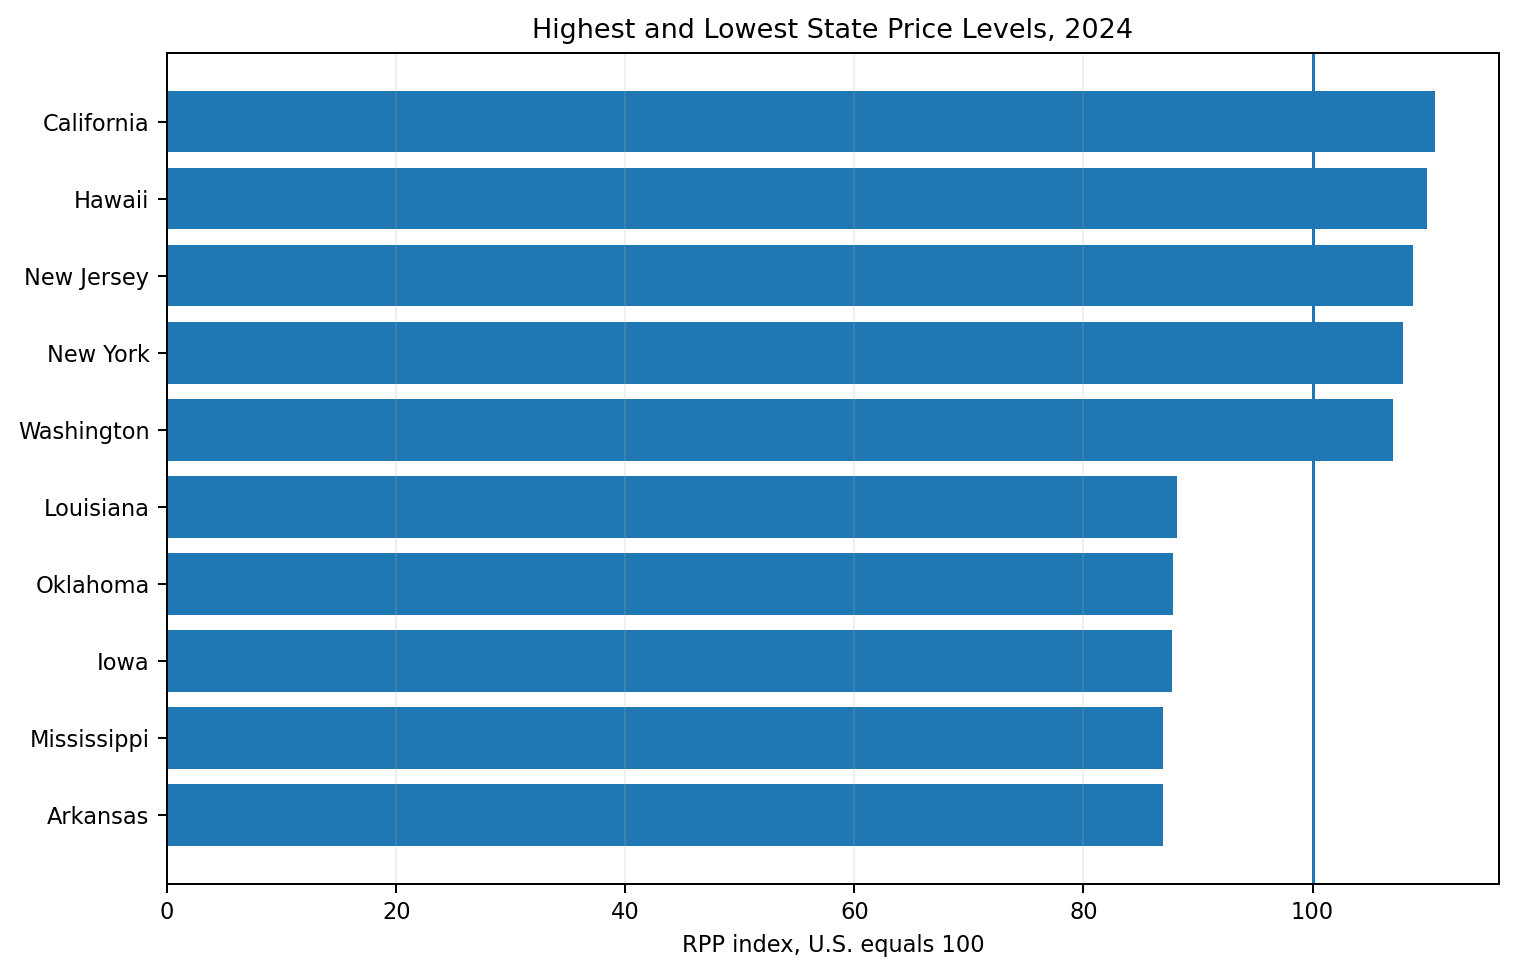
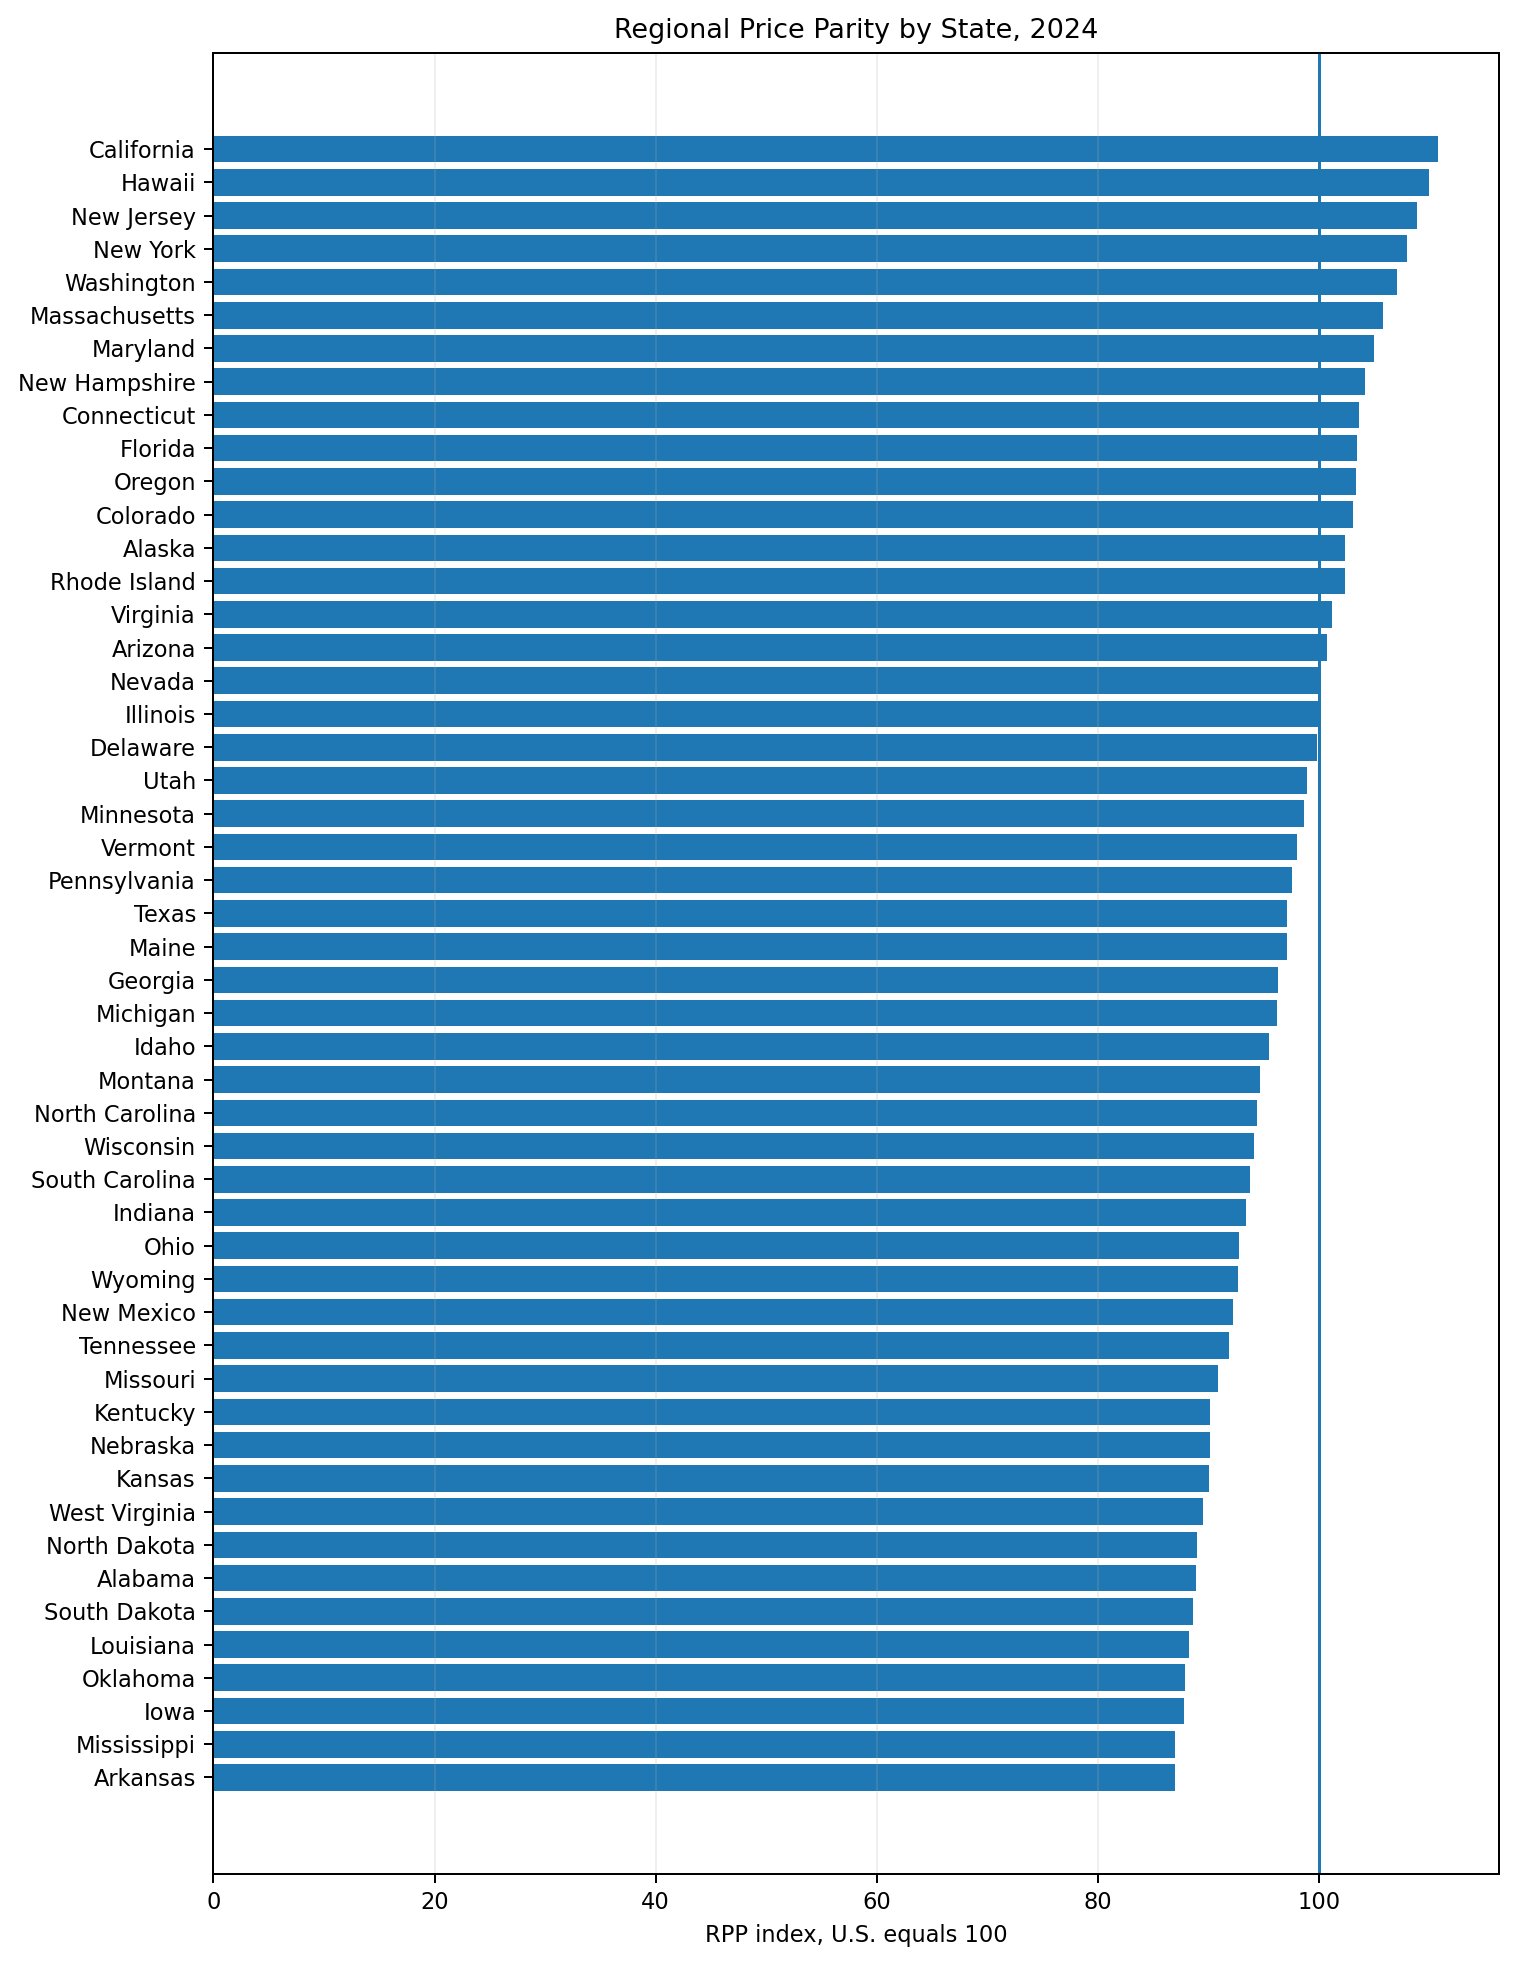
The 2024 rankings show a clear spread across states. California ranked first at 110.7, followed by Hawaii at 110.0 and New Jersey at 108.8. New York and Washington completed the top five.
At the other end, Arkansas ranked lowest at 86.9. Mississippi was nearly the same at 87.0. Iowa, Oklahoma, and Louisiana were also among the five lowest state price levels.
The gap between the highest and lowest state RPP was about 23.8 index points. That is a large spatial difference, but it should not be read as an exact household savings estimate. Taxes, income, home ownership, family size, and spending choices are outside the simple all items ranking.
States With the Highest Price Levels
California led the state ranking with an RPP of 110.7. Its housing rents RPP was 154.3, the highest among states. That housing figure helps explain why the state sits well above the national price level.
Hawaii ranked second at 110.0. New Jersey ranked third at 108.8, followed by New York at 107.9 and Washington at 107.0. These states do not have identical cost structures, but each had an overall price level clearly above the U.S. benchmark in 2024.
A high RPP does not mean a state is unaffordable for every resident. Income levels and household needs matter. The index answers a narrower question: how high are prices in that state compared with the country as a whole?
Lowest price level states
| Rank | State | All items RPP | Difference from 100 | Housing rents RPP | Position |
|---|---|---|---|---|---|
| 50 | Arkansas | 86.9 | -13.1 | 58.2 | Below U.S. level |
| 49 | Mississippi | 87.0 | -13.0 | 56.5 | Below U.S. level |
| 48 | Iowa | 87.8 | -12.2 | 65.3 | Below U.S. level |
| 47 | Oklahoma | 87.8 | -12.2 | 62.8 | Below U.S. level |
| 46 | Louisiana | 88.2 | -11.8 | 63.1 | Below U.S. level |
| 45 | South Dakota | 88.6 | -11.4 | 67.6 | Below U.S. level |
| 44 | Alabama | 88.8 | -11.2 | 61.8 | Below U.S. level |
| 43 | North Dakota | 89.0 | -11.0 | 71.4 | Below U.S. level |
| 42 | West Virginia | 89.5 | -10.5 | 54.2 | Below U.S. level |
| 41 | Kansas | 90.1 | -9.9 | 71.2 | Below U.S. level |
States With the Lowest Price Levels
Arkansas had the lowest all items RPP among states at 86.9. Mississippi was also 87.0 after rounding. Iowa and Oklahoma were each close to 87.8, while Louisiana was 88.2.
Lower state price levels can improve the buying power of a given dollar income, but that does not automatically mean residents are better off. Local wages and incomes may also be lower. A useful cost of living by state comparison should look at both prices and income rather than treating either one alone as the full story.
How Housing Changes the Cost of Living Picture
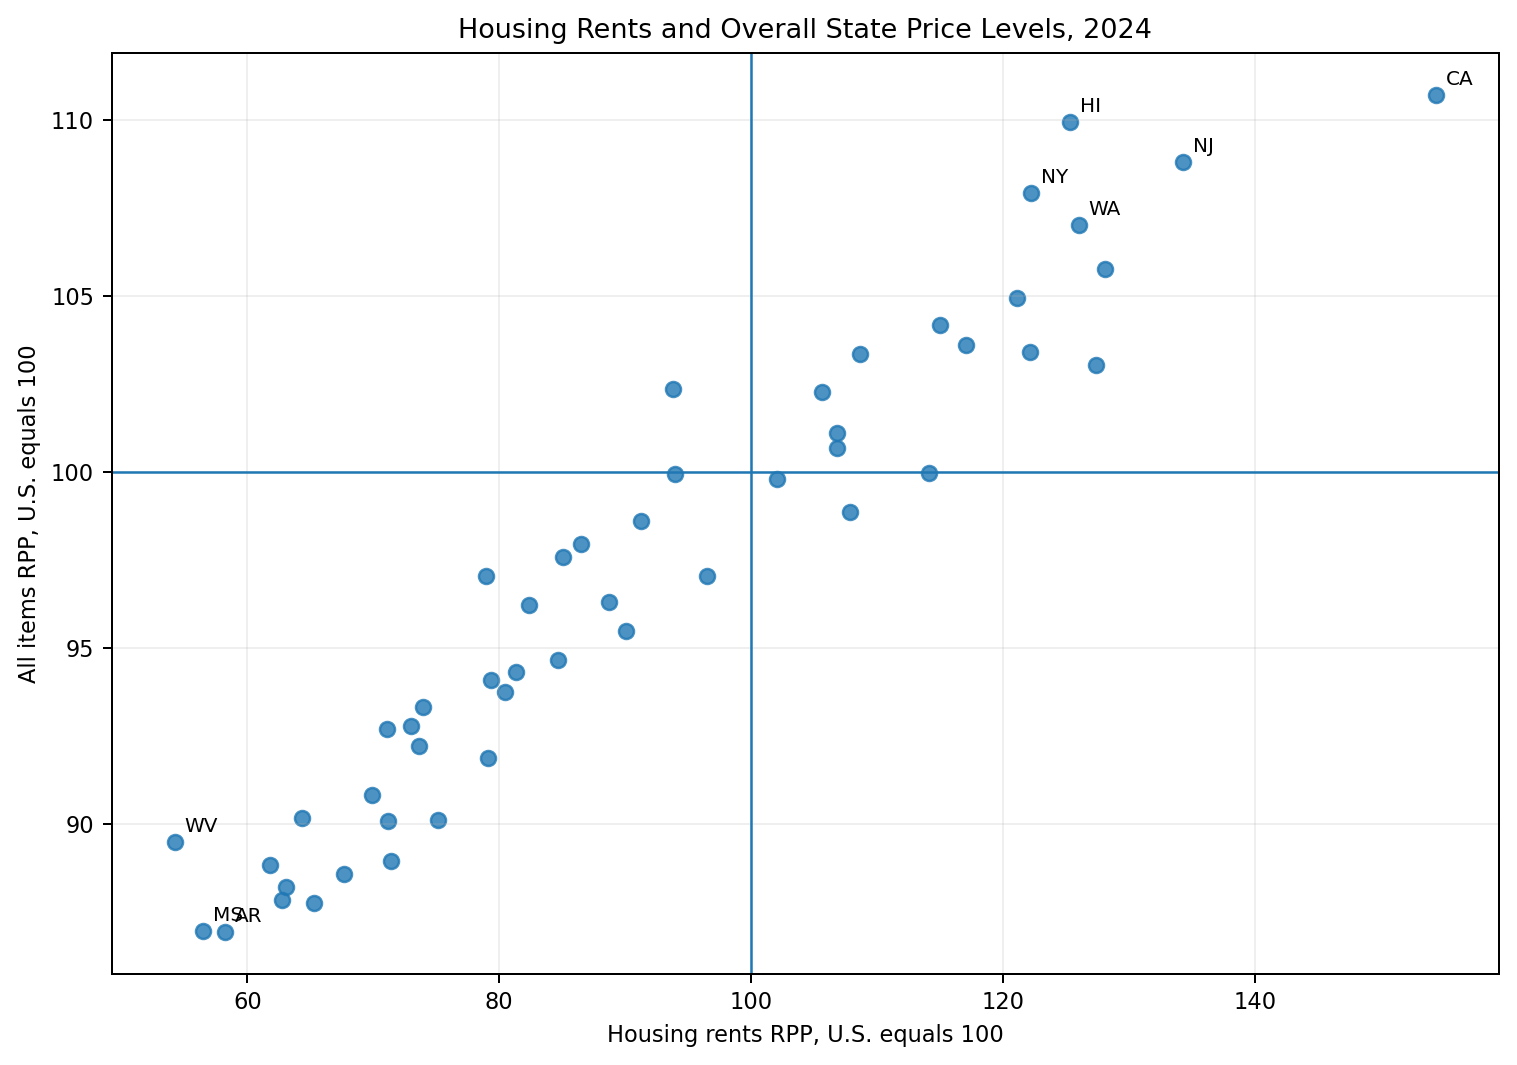
Housing is one of the strongest patterns in the 2024 data. California had a housing rents RPP of 154.3. West Virginia had the lowest housing rents RPP among states at 54.2. That range is far wider than the spread in the all items index.
Across the 50 states in this analysis, the correlation between the housing rents RPP and the all items RPP is about 0.96. That is a very strong positive relationship. It supports BEA's point that housing rents are often a major driver of regional price differences.
Correlation is not proof that housing alone causes the full difference in state price levels. The all items RPP also includes other goods and services. Still, the scatter plot makes the housing link hard to miss.
Map of Regional Price Parities by State
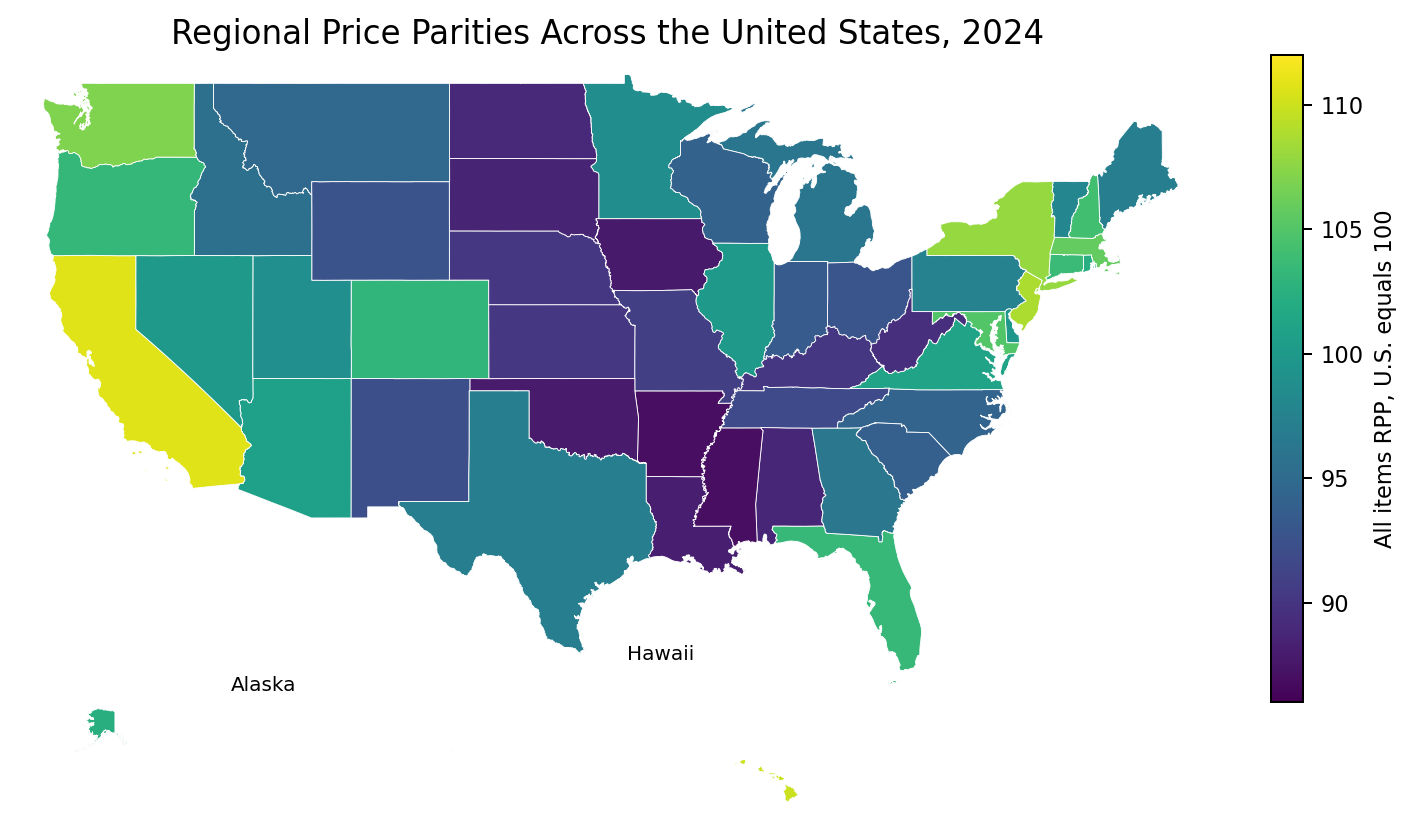
A map makes the state pattern easier to scan. Many states on the West Coast and in the Northeast sit above the national price level, while many states in the South and central parts of the country sit below it. There are important exceptions, so the map should support the table rather than replace it.
The map uses the same national benchmark of 100. Hover details in the HTML version show the all items RPP and housing rents RPP for each state.
Interactive animation
The embedded animation shows the latest revised 2023 and 2024 state comparison. Use the Play control or year slider. The Python example below requests the full comparable BEA history when run with a registered UserID.
How State Price Levels Changed Over Time
RPPs can also be compared across years, but the interpretation needs care. A change in a state's RPP shows how its price level moved relative to the national price level. It is not the same thing as the state's inflation rate.
The embedded animation in the HTML article shows the latest revised comparison for 2023 and 2024. The companion BEA API code requests the full comparable history when the reader supplies a registered BEA UserID. BEA states that the current state series includes revised historical estimates going back to 2008.
For example, Montana's all items RPP rose from about 91.0 in 2023 to 94.6 in 2024, while Massachusetts moved from about 107.7 to 105.8. Those changes describe relative price position, not a direct measure of each state's annual inflation.
Regional Price Parities vs. Inflation
RPP and inflation answer different questions. RPP asks how prices differ across places in the same year. Inflation asks how prices change over time for a place or population.
A state can have a high RPP and modest inflation. It can also have a low RPP and fast price growth. The first tells you the current relative price level. The second tells you the rate of change. Mixing the two can lead to weak conclusions about cost of living trends.
RPP vs. a Traditional Cost of Living Index
Many private cost of living indexes combine selected prices, weights, and local assumptions. BEA Regional Price Parities are official statistical measures designed for comparison across regions and are tied to national economic accounts.
That does not make RPP a perfect answer for every relocation decision. A person comparing two cities may need rent for a specific neighborhood, taxes, insurance, transportation, schools, and a personal spending plan. RPP is best used as a broad benchmark that can guide deeper research.
How RPPs Affect Buying Power
Price levels change what an income can buy. A salary of the same dollar amount generally has more purchasing power in a lower price state than in a higher price state, all else equal.
BEA uses RPPs when producing real personal income measures. That adjustment helps analysts compare income after accounting for regional price differences. It is a stronger approach than ranking states by nominal income alone.
For a household, the practical lesson is simple. Look at earnings and prices together. A lower price level can help, but it does not guarantee a higher standard of living if local income opportunities are also weaker.
How to Download BEA RPP Data
BEA provides Regional Price Parities through its Interactive Data Application, downloadable regional files, and the BEA API. The state table used for the all items comparison is SARPP. BEA also provides the Services: Rents line in the same table family.
For a repeatable workflow, download the table or use the API, keep the state name and year, convert the RPP values to numbers, and verify the latest release year before publishing. BEA currently lists February 19, 2026 as the release date for the 2024 estimates, with the 2025 release scheduled for December 10, 2026.
Python example: download SARPP data
import os
import requests
import pandas as pd

BEA_USER_ID = os.environ["BEA_USER_ID"]

params = {
    "UserID": BEA_USER_ID,
    "method": "GetData",
    "datasetname": "Regional",
    "TableName": "SARPP",
    "LineCode": "1",
    "GeoFIPS": "STATE",
    "Year": "ALL",
    "ResultFormat": "JSON",
}

response = requests.get(
    "https://apps.bea.gov/api/data",
    params=params,
    timeout=30,
)
response.raise_for_status()
payload = response.json()

records = payload["BEAAPI"]["Results"]["Data"]
rpp = pd.DataFrame(records)
rpp["DataValue"] = pd.to_numeric(
    rpp["DataValue"].str.replace(",", "", regex=False),
    errors="coerce",
)
rpp["TimePeriod"] = pd.to_numeric(rpp["TimePeriod"], errors="coerce")
print(rpp.head())
The request returns the regional table in JSON format. Before publishing, confirm that the line code still represents the all items RPP in the current BEA metadata.
latest_year = int(rpp["TimePeriod"].max())
latest = rpp[rpp["TimePeriod"].eq(latest_year)].copy()
latest["difference_from_us"] = latest["DataValue"] - 100
latest["rank"] = latest["DataValue"].rank(
    ascending=False,
    method="min",
).astype(int)
latest = latest.sort_values("rank")
print(latest[["GeoName", "DataValue", "difference_from_us", "rank"]])
Optional Python Analysis With BEA Data
Python is useful when you want to refresh a regional price parity by state table every year. The code can request all states, calculate each state's difference from 100, rank the states, and build the same charts shown in this article.
The BEA API requires a registered UserID. Keep that key outside public code. After downloading the data, always inspect the returned table names, line codes, units, and years before making a ranking.
Limits of a State Cost of Living Comparison
State averages can hide large differences within a state. Housing in a major coastal city can differ sharply from housing in a smaller inland community. A statewide RPP should not be treated as a neighborhood price quote.
RPP also does not measure household preferences. Owners and renters face different housing costs. Families with children may spend differently from retirees. Medical needs, commuting patterns, and taxes can change the real budget.
Finally, rankings can move when BEA revises source data or methods. Record the release year and access date. That makes the analysis easier to reproduce when the next annual estimates arrive.
Conclusion
The 2024 regional price parity by state data show a wide range in U.S. price levels. California ranked highest among states at 110.7, while Arkansas ranked lowest at 86.9. Housing rents explain a large part of the pattern, especially in high price states.
Use RPP as a broad comparison tool, not as a personal budget answer. The best reading combines state price levels with income, housing, taxes, and local conditions. When the next BEA release arrives, the same table and code workflow can be refreshed with the newest year.
Full 50 State RPP Table
Open the complete 2024 state table| Rank | State | All items RPP | Difference from 100 | Housing rents RPP | Position |
|---|---|---|---|---|---|
| 1 | California | 110.7 | +10.7 | 154.3 | Above U.S. level |
| 2 | Hawaii | 110.0 | +10.0 | 125.3 | Above U.S. level |
| 3 | New Jersey | 108.8 | +8.8 | 134.3 | Above U.S. level |
| 4 | New York | 107.9 | +7.9 | 122.2 | Above U.S. level |
| 5 | Washington | 107.0 | +7.0 | 126.0 | Above U.S. level |
| 6 | Massachusetts | 105.8 | +5.8 | 128.1 | Above U.S. level |
| 7 | Maryland | 105.0 | +5.0 | 121.1 | Above U.S. level |
| 8 | New Hampshire | 104.2 | +4.2 | 114.9 | Above U.S. level |
| 9 | Connecticut | 103.6 | +3.6 | 117.0 | Above U.S. level |
| 10 | Florida | 103.4 | +3.4 | 122.1 | Above U.S. level |
| 11 | Oregon | 103.4 | +3.4 | 108.6 | Above U.S. level |
| 12 | Colorado | 103.1 | +3.1 | 127.4 | Above U.S. level |
| 13 | Alaska | 102.4 | +2.4 | 93.8 | Above U.S. level |
| 14 | Rhode Island | 102.3 | +2.3 | 105.6 | Above U.S. level |
| 15 | Virginia | 101.1 | +1.1 | 106.8 | Above U.S. level |
| 16 | Arizona | 100.7 | +0.7 | 106.8 | Above U.S. level |
| 17 | Nevada | 100.0 | -0.0 | 114.1 | Below U.S. level |
| 18 | Illinois | 100.0 | -0.0 | 93.9 | Below U.S. level |
| 19 | Delaware | 99.8 | -0.2 | 102.0 | Below U.S. level |
| 20 | Utah | 98.9 | -1.1 | 107.8 | Below U.S. level |
| 21 | Minnesota | 98.6 | -1.4 | 91.3 | Below U.S. level |
| 22 | Vermont | 98.0 | -2.0 | 86.5 | Below U.S. level |
| 23 | Pennsylvania | 97.6 | -2.4 | 85.1 | Below U.S. level |
| 24 | Texas | 97.1 | -2.9 | 96.5 | Below U.S. level |
| 25 | Maine | 97.0 | -3.0 | 78.9 | Below U.S. level |
| 26 | Georgia | 96.3 | -3.7 | 88.7 | Below U.S. level |
| 27 | Michigan | 96.2 | -3.8 | 82.3 | Below U.S. level |
| 28 | Idaho | 95.5 | -4.5 | 90.0 | Below U.S. level |
| 29 | Montana | 94.6 | -5.4 | 84.6 | Below U.S. level |
| 30 | North Carolina | 94.3 | -5.7 | 81.4 | Below U.S. level |
| 31 | Wisconsin | 94.1 | -5.9 | 79.3 | Below U.S. level |
| 32 | South Carolina | 93.7 | -6.3 | 80.5 | Below U.S. level |
| 33 | Indiana | 93.3 | -6.7 | 73.9 | Below U.S. level |
| 34 | Ohio | 92.8 | -7.2 | 73.0 | Below U.S. level |
| 35 | Wyoming | 92.7 | -7.3 | 71.1 | Below U.S. level |
| 36 | New Mexico | 92.2 | -7.8 | 73.6 | Below U.S. level |
| 37 | Tennessee | 91.9 | -8.1 | 79.1 | Below U.S. level |
| 38 | Missouri | 90.8 | -9.2 | 69.9 | Below U.S. level |
| 39 | Kentucky | 90.2 | -9.8 | 64.3 | Below U.S. level |
| 40 | Nebraska | 90.1 | -9.9 | 75.2 | Below U.S. level |
| 41 | Kansas | 90.1 | -9.9 | 71.2 | Below U.S. level |
| 42 | West Virginia | 89.5 | -10.5 | 54.2 | Below U.S. level |
| 43 | North Dakota | 89.0 | -11.0 | 71.4 | Below U.S. level |
| 44 | Alabama | 88.8 | -11.2 | 61.8 | Below U.S. level |
| 45 | South Dakota | 88.6 | -11.4 | 67.6 | Below U.S. level |
| 46 | Louisiana | 88.2 | -11.8 | 63.1 | Below U.S. level |
| 47 | Oklahoma | 87.8 | -12.2 | 62.8 | Below U.S. level |
| 48 | Iowa | 87.8 | -12.2 | 65.3 | Below U.S. level |
| 49 | Mississippi | 87.0 | -13.0 | 56.5 | Below U.S. level |
| 50 | Arkansas | 86.9 | -13.1 | 58.2 | Below U.S. level |
Frequently Asked Questions
What is regional price parity by state?
It is a BEA measure of how a state's price level compares with the national price level in the same year. The U.S. level equals 100.
What does an RPP of 110 mean?
An RPP of 110 means the measured price level is about 10 percent above the national level for that year.
Which state had the highest RPP in 2024?
California had the highest state RPP in 2024 at 110.7. Hawaii was second at 110.0, and New Jersey was third at 108.8.
Which state had the lowest RPP in 2024?
Arkansas had the lowest state RPP in 2024 at 86.9. Mississippi was very close at 87.0.
Is regional price parity the same as inflation?
No. RPP compares price levels across places in the same year. Inflation measures how prices change over time.
Does a low RPP mean a state is affordable for everyone?
No. Household income, taxes, housing choice, family size, and personal spending needs can change affordability.
Why are housing rents important for RPP?
Housing prices differ sharply across states. BEA notes that housing rents are often a main driver of differences in Regional Price Parities.
How often does BEA publish RPP data?
BEA publishes state Regional Price Parities annually. Check the current BEA release calendar before using a latest year claim.
Can I download Regional Price Parities with Python?
Yes. BEA provides a data API for regional statistics. You can request SARPP data, clean the response with pandas, and build rankings and charts.
Can RPP be used to compare buying power?
Yes, as a broad regional measure. BEA uses RPPs in real personal income estimates to account for regional price differences.
Internal Link Suggestions
-
FRED API Python Tutorial: Code, Charts, Animation, and Notebook
-
CPI Analysis Python Tutorial: Monthly Reproducible Inflation Analysis
Official Sources
Downloads
Files attached to this article for your reference.