
Repeated Measures ANOVA Calculator & Complete Guide
Calculate the test, check whether it fits your design, understand sphericity and effect size, and know what to report next.
Repeated Measures ANOVA Calculator & Guide
Calculate the test, check whether it fits your design, understand sphericity and effect size, and know what to report next.
A repeated measures ANOVA calculator tests whether mean outcomes differ when the same subjects or experimental units are measured across multiple conditions or time points. It returns an F-statistic, degrees of freedom, and p-value while preserving the pairing between repeated observations.
The calculation is only one part of the decision. A defensible result also depends on whether repeated measures ANOVA matches the study design, whether sphericity matters, how missing observations are handled, and whether effect sizes and follow-up comparisons support the conclusion. This guide is designed to take you from data entry to that final reporting decision.
Repeated Measures ANOVA Calculator
Place the interactive calculator at the top of the page so readers who already know the method can analyze their data immediately. For a typical one-way within-subject design in wide format, each row represents one subject and each column represents one repeated condition or time point. jamovi uses this same wide-format structure for its standard repeated measures ANOVA workflow. [8]
| Subject | Baseline | Week 1 | Week 2 |
|---|---|---|---|
| 1 | 52 | 55 | 59 |
| 2 | 55 | 57 | 61 |
| 3 | 49 | 52 | 54 |
| 4 | 60 | 63 | 66 |
Keep each subject aligned across conditions. If row 2 is Subject 2 under Baseline, row 2 must also be Subject 2 under Week 1 and Week 2. Mixing subject order destroys the within-subject pairing that gives the analysis its meaning.
What the calculator should returnAt minimum, show condition means, the ANOVA table, F-statistic, numerator and denominator degrees of freedom, p-value, and a clearly named effect size. With three or more repeated levels, also show sphericity information and any corrected degrees of freedom or p-values. If pairwise comparisons are available, identify the multiplicity correction used.
What Is a Repeated Measures ANOVA?
Repeated measures ANOVA, also called a within-subjects ANOVA, compares means when the same subjects or matched experimental units contribute observations under several levels of one categorical factor. UCLA describes the method as the extension of the paired-samples framework to a factor with multiple repeated levels. [2]
The defining feature is dependence within a subject. A participant measured at baseline, Week 1, and Week 2 is not three independent participants. Repeated measures ANOVA accounts for that structure by separating stable subject-to-subject differences from the residual variation used to test the condition effect.
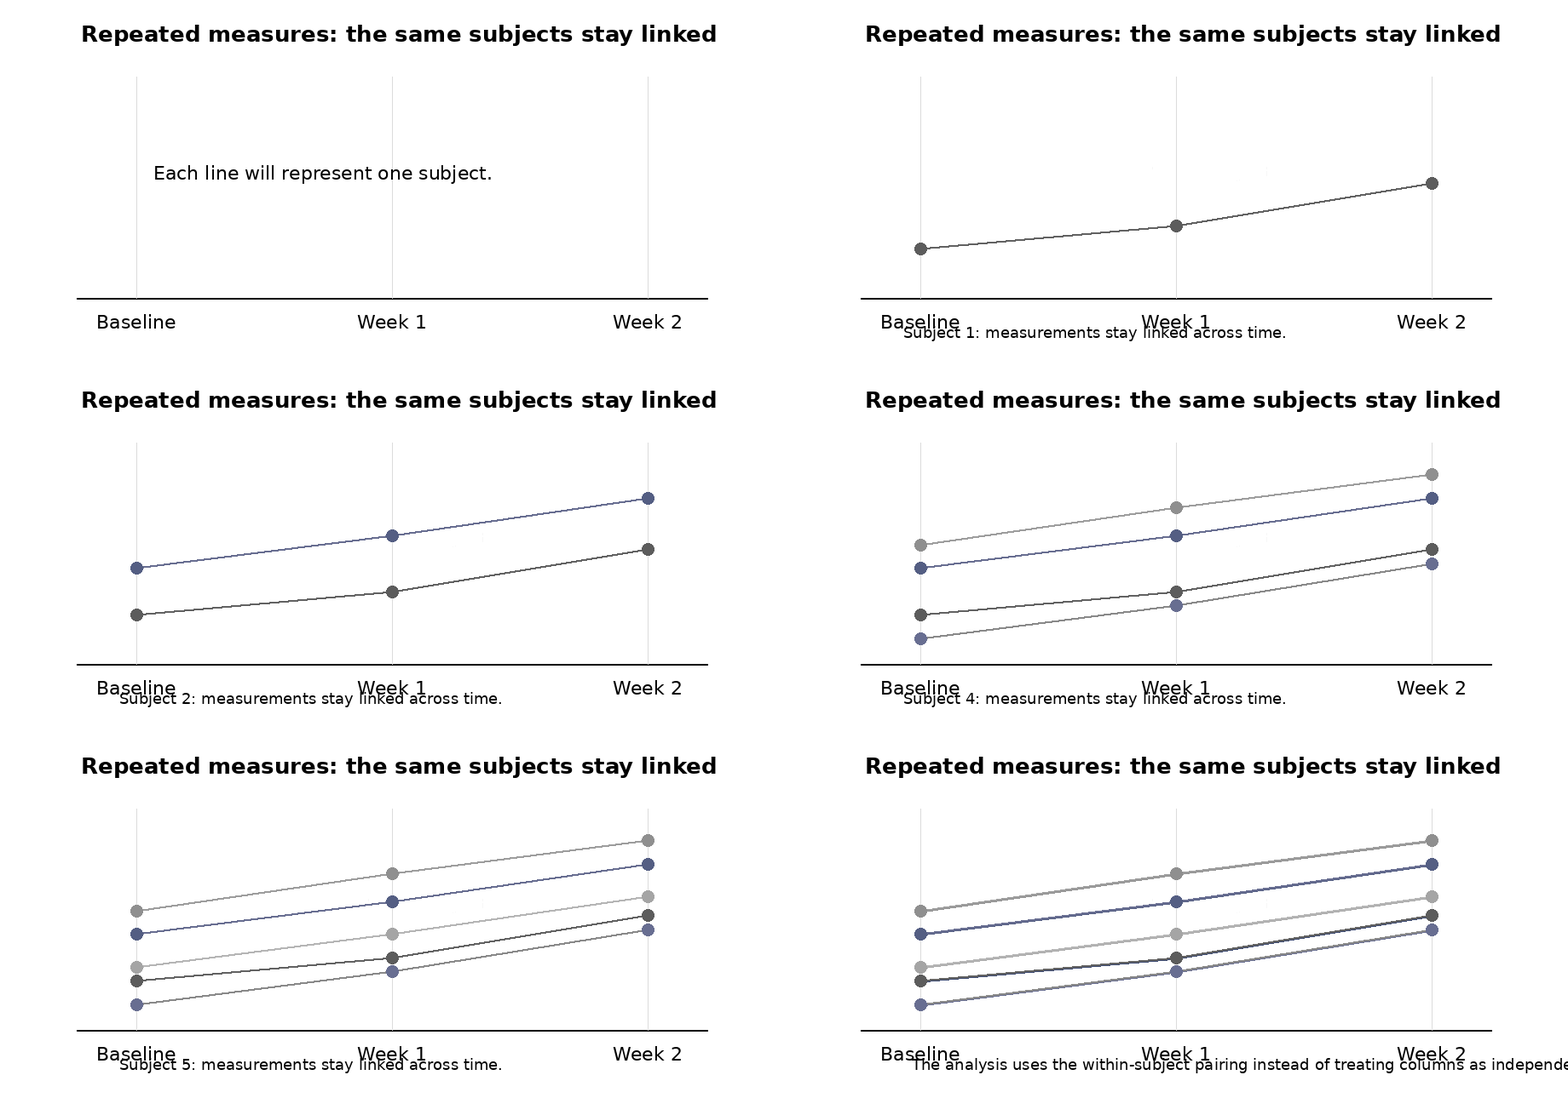
A significant omnibus result therefore means that at least one mean differs. It does not mean every condition differs from every other condition.
When Should You Use Repeated Measures ANOVA?
A one-way repeated measures ANOVA is a reasonable candidate when there is one categorical within-subject factor, a quantitative outcome, the same subjects or units are observed at every level, and different subjects are independent of one another. Common examples include pre/post/follow-up scores, reaction times under several conditions, biomarkers measured across visits, and performance measured under several treatments.
Two repeated measurements are a special case
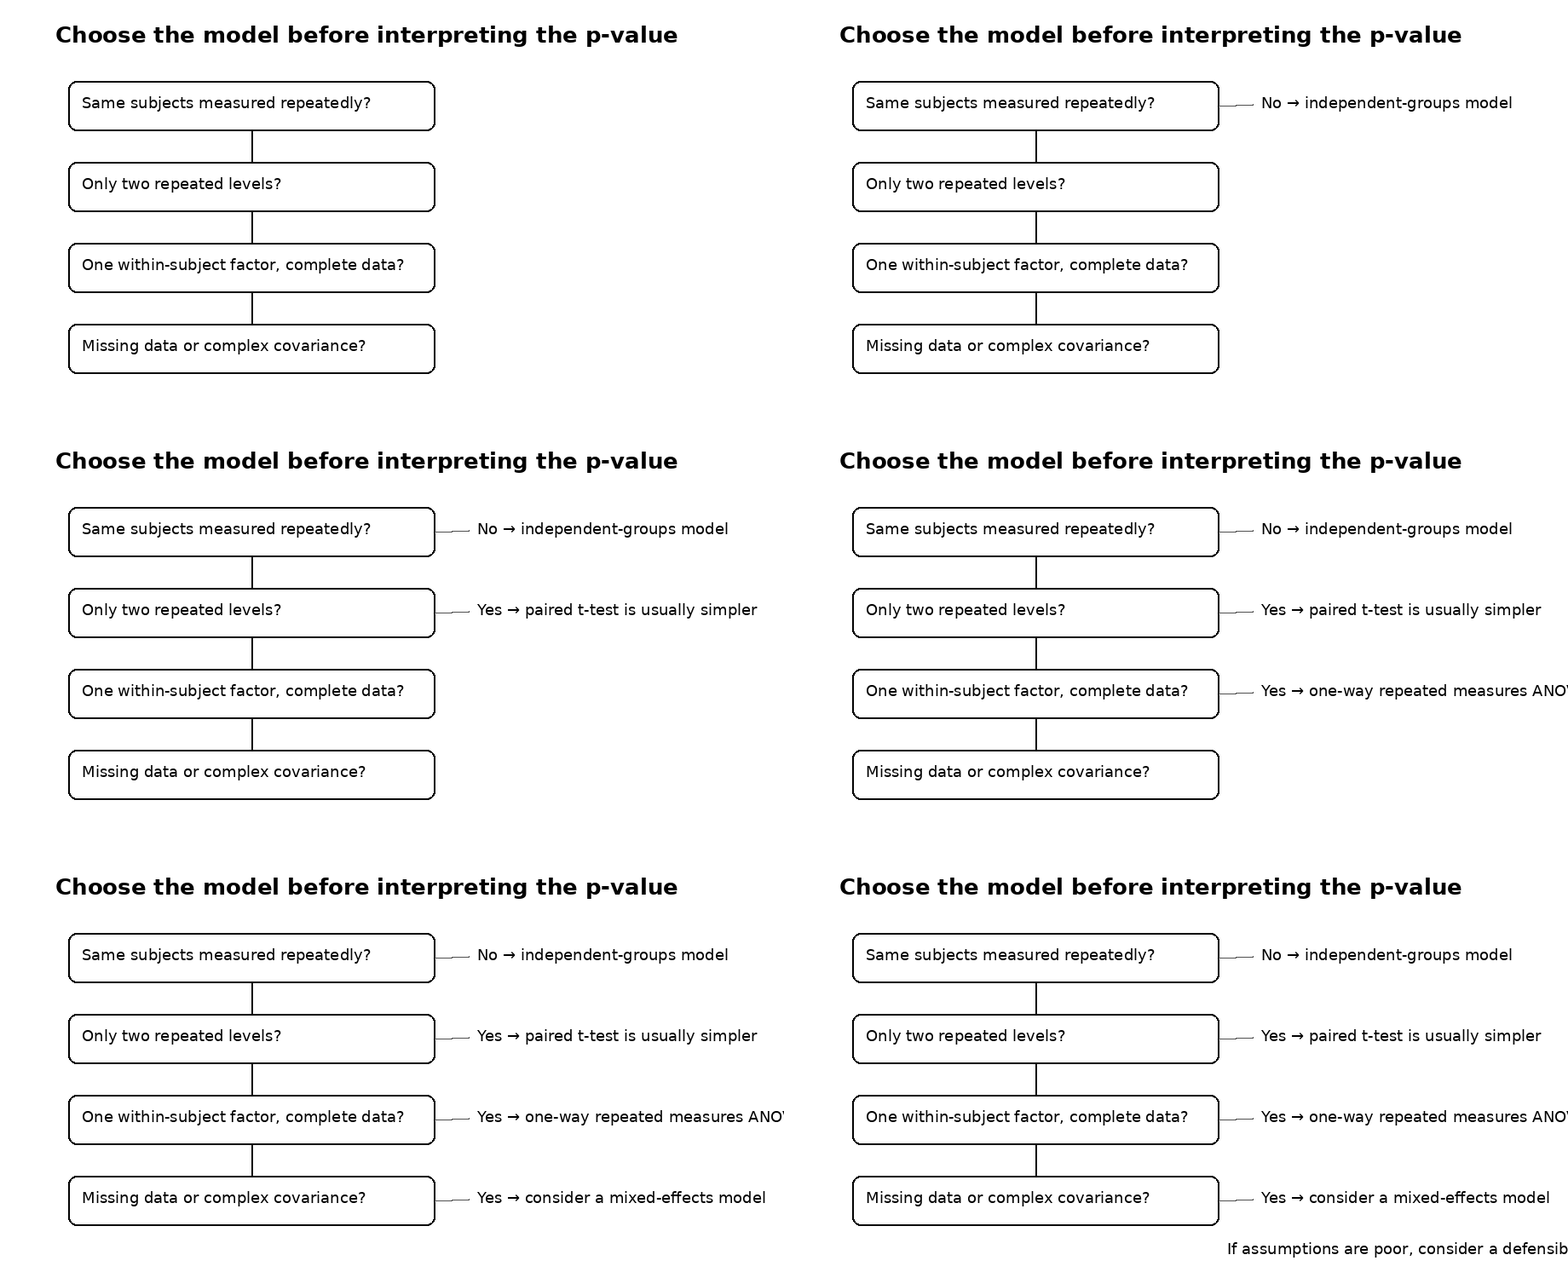
With exactly two repeated measurements, a paired t-test is usually the simpler analysis. Repeated measures ANOVA can be written for two levels, but it adds little practical value, and sphericity cannot be violated because only one difference variance exists. [2][5]
Choose the model before interpreting the p-value
| Situation | Method to consider |
|---|---|
| Same subjects measured twice | Paired t-test |
| Same subjects measured at 3+ levels of one factor | One-way repeated measures ANOVA |
| Different subjects in each condition | Ordinary one-way ANOVA |
| Repeated factor plus an independent grouping factor | Mixed ANOVA or an appropriate mixed model |
| Related observations where a rank-based analysis better matches the question/data | Friedman test |
| Repeated observations with important missing data or a more flexible covariance structure | Linear mixed-effects model |
The last row is a frequent real-world exception. Classical repeated measures ANOVA requires complete repeated observations for each included subject. GraphPad documents that a mixed-effects model can use many incomplete repeated datasets, although the interpretation still depends on assumptions about why values are missing. [6][7]
Repeated Measures ANOVA Assumptions
Correct data entry does not guarantee a valid analysis. The assumptions concern both the way the study was designed and the error structure of the statistical model.
The outcome is quantitative
The dependent variable is normally treated as a continuous quantitative outcome. Examples include time, score, concentration, pressure, or another measured response where means and differences are meaningful.
Repeated observations are related, but different subjects are independent
Measurements within one subject are intentionally dependent. The separate subjects or experimental units, however, should normally be independent. If participants influence one another or several rows are pseudo-replicates from the same underlying unit, the apparent sample size can be misleading.
Normality concerns the model errors, not a ritual test on every raw column
For the univariate repeated-measures approach, IBM describes the measurements on a subject through a multivariate-normal framework with assumptions on the covariance matrix. [4] In practice, this is more nuanced than requiring each condition column to pass a separate normality test. Residual behavior, within-subject contrasts, sample size, extreme observations, and the scientific context all matter.
Outliers require investigation, not automatic deletion
An extreme value can materially change means, sums of squares, and the F-ratio. First determine whether it reflects data-entry error, measurement failure, a genuine observation, or evidence that the chosen model is inappropriate. Removing a point simply because significance changes is not a defensible criterion.
Sphericity matters when there are three or more repeated levels
The special repeated-measures covariance assumption is sphericity. It is not the same as the ordinary independent-groups rule that all group variances must be equal.
What Is Sphericity and Why Does It Matter?
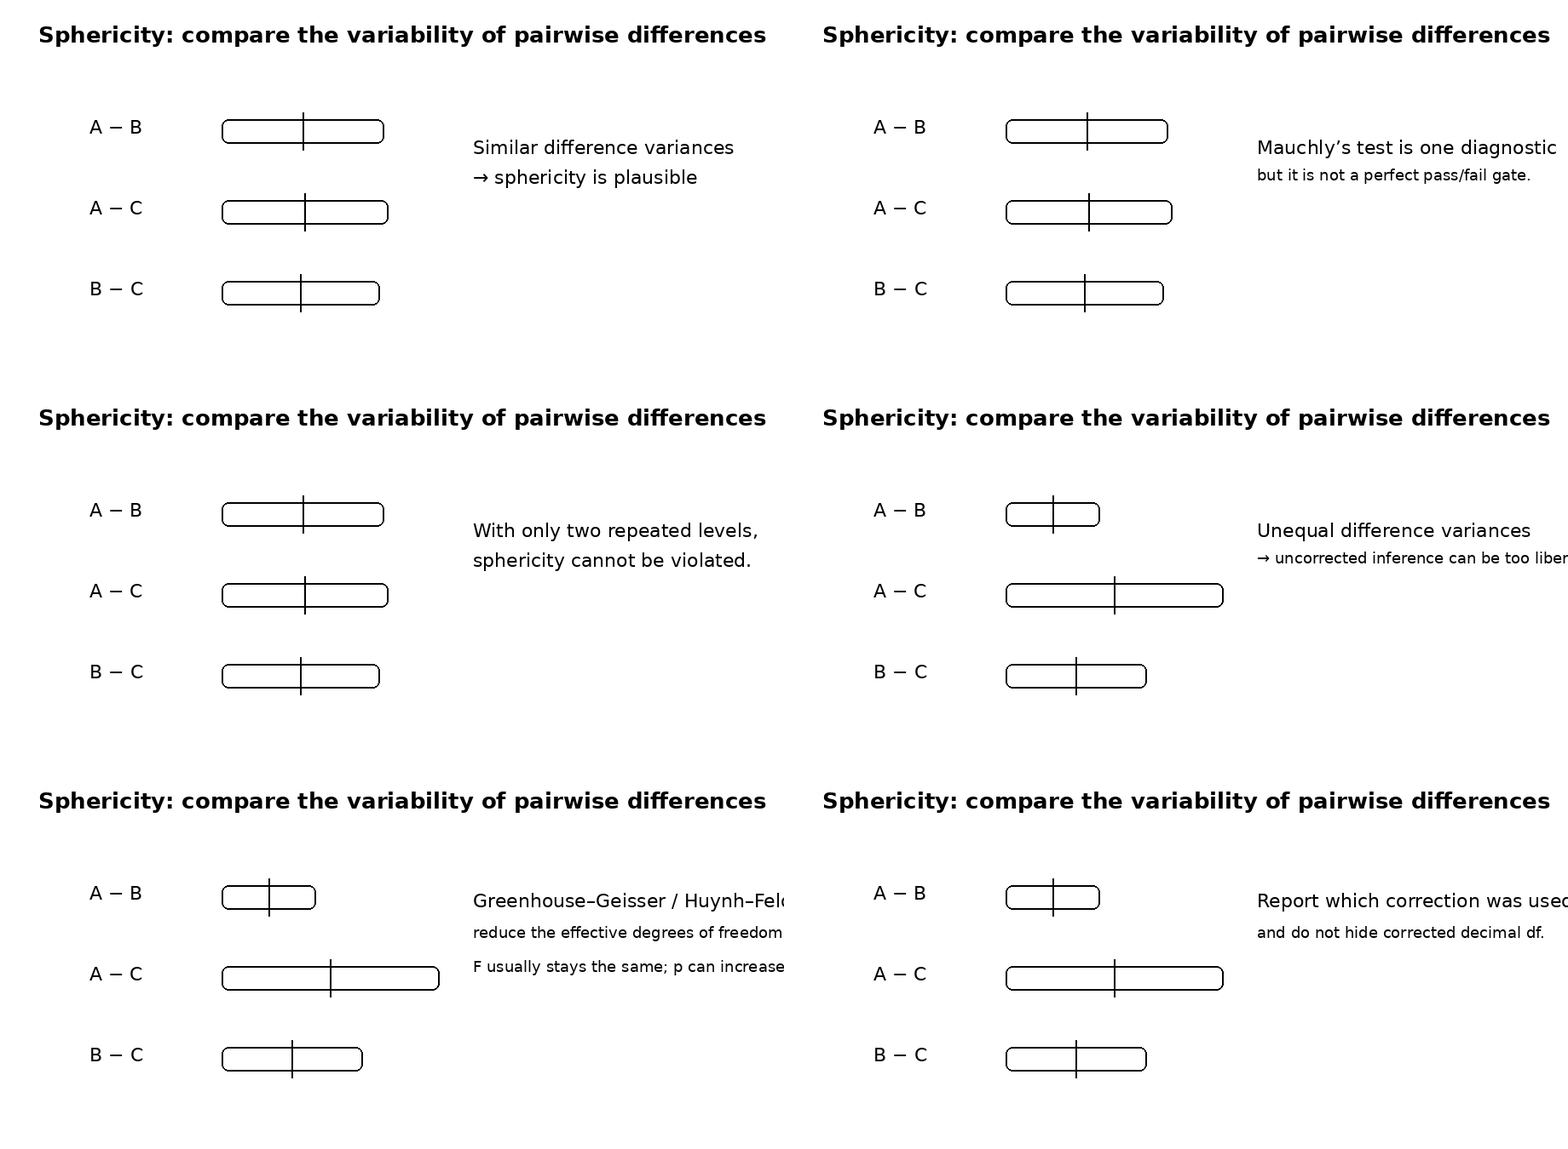
Sphericity means that the population variances of the differences between every pair of repeated levels are equal. With three time points A, B, and C, the variance of A−B, A−C, and B−C should be comparable.
Mauchly's test is useful, but not a perfect gatekeeper
Mauchly's test evaluates the sphericity assumption. IBM states that a significance value below .05 indicates that the sphericity assumption for the univariate tests does not hold, and that epsilon values can be used to adjust the degrees of freedom. [3] The practical mistake is to turn that one diagnostic into a magical pass/fail switch. Assumption checks should complement the design, covariance pattern, sample size, and sensitivity of the conclusion to correction.
Greenhouse-Geisser and Huynh-Feldt corrections
Greenhouse-Geisser and Huynh-Feldt corrections adjust the numerator and denominator degrees of freedom using an estimated epsilon. The F-statistic is typically unchanged; the reference distribution changes, so the corrected p-value can become larger. IBM notes that Huynh-Feldt is generally less conservative than Greenhouse-Geisser and is capped at 1 when its estimate exceeds 1. [3]
Decimal degrees of freedom are therefore expected in a corrected result. They are not a software error.
Two-level exceptionIf the repeated factor has only two levels, sphericity cannot be violated. In that setting a paired t-test is usually the clearest analysis.
How Repeated Measures ANOVA Is Calculated
For a complete one-factor design, total variation is partitioned into variation due to the repeated condition, stable variation among subjects, and residual error. This decomposition is the reason the method can be more sensitive than treating repeated observations as independent groups.
Let n be the number of subjects, k the number of conditions, and Yᵢⱼ the observation from subject i under condition j. Let Ȳ·· be the grand mean, Ȳ·ⱼ a condition mean, and Ȳᵢ· a subject mean.
When the null hypothesis is compatible with the data, systematic condition variation is not large relative to residual error. Larger F-ratios provide stronger evidence against equality of all condition means, with the p-value taken from the right tail of the appropriate F distribution.
How to Interpret Repeated Measures ANOVA Results
Interpret the research question and descriptive statistics before reducing the analysis to a p-value. Suppose the output is F(2, 38) = 6.41, p = .004. At a prespecified α = .05, the data provide evidence that the population means are not all equal.
That result does not identify the direction of change, which specific levels differ, whether every pair differs, or whether the difference is practically important. Those questions require condition means, uncertainty intervals, an effect-size measure, and the comparisons that match the research question.
A non-significant result is not proof of equality
If p is above the chosen significance level, the analysis has not supplied enough evidence to reject the null hypothesis. That is different from proving that all means are identical. Precision, sample size, variability, confidence intervals, and the size of differences still matter.
Statistical significance is not practical significance
A small p-value reflects evidence under a specified model; it is not a direct measure of importance. Large samples can make small effects detectable, while small studies can remain inconclusive even when an effect could matter. Report effect magnitude and the actual condition means alongside the hypothesis test.
Effect Size for Repeated Measures ANOVA
Effect sizes quantify magnitude, but repeated-measures designs make the denominator choice especially important. A calculator should name the measure rather than displaying an unlabeled “eta squared.”
Partial eta squared removes the subject component from the denominator. It therefore expresses the condition effect relative to the error term used in the hypothesis test.
Generalized eta squared retains the subject component in this simple design, which can make it more comparable across different experimental structures. Methodological guidance by Lakens emphasizes that effect-size definitions and benchmarks must be matched to the design rather than treated as interchangeable. [9]
Cohen’s f can also be derived from a suitable eta-squared measure as f = √[η²/(1−η²)]. If a calculator offers f, it should document which underlying eta-squared definition is being converted.
What to Do After a Significant Repeated Measures ANOVA
The omnibus ANOVA answers whether all repeated-condition means can reasonably be treated as equal. It does not locate the difference.
Use planned contrasts when they match the research question
If the study specified particular comparisons before examining the data, planned contrasts may be more informative than comparing every pair. For example, a trial may primarily care about baseline versus final follow-up rather than every intermediate time point.
Use corrected pairwise comparisons when all pairs matter
When all pairwise differences are genuinely of interest, paired comparisons should respect the within-subject design and control the multiplicity created by testing several hypotheses. Bonferroni is simple and conservative; Sidak is another familywise-error adjustment. Choose the strategy because it matches the inferential plan, not because it produces the smallest adjusted p-value.
Why the omnibus test can be significant when no adjusted pair is
The omnibus hypothesis and each pairwise hypothesis are different tests. Pairwise procedures also pay a multiplicity penalty. It is therefore possible for the global test to detect evidence that the set of means is not equal while no individual pair survives a conservative correction. That does not make the omnibus result “wrong.”
Repeated Measures ANOVA Example
Consider the following synthetic teaching dataset. Eight participants are measured at baseline, after one week, and after two weeks. The numbers are intentionally simple so the variance decomposition is easy to audit.
| Subject | Baseline | Week 1 | Week 2 |
|---|---|---|---|
| 1 | 52 | 55 | 59 |
| 2 | 55 | 57 | 61 |
| 3 | 49 | 52 | 54 |
| 4 | 60 | 63 | 66 |
| 5 | 58 | 60 | 63 |
| 6 | 54 | 58 | 60 |
| 7 | 51 | 53 | 56 |
| 8 | 57 | 59 | 62 |
The condition means are 54.50, 57.125, and 60.125, with a grand mean of 57.25.
| Source | SS | df | MS |
|---|---|---|---|
| Condition | 126.750 | 2 | 63.375 |
| Subjects | 291.833 | 7 | 41.690 |
| Error | 3.917 | 14 | 0.280 |
| Total | 422.500 | 23 | — |
The example therefore provides very strong evidence that the three condition means are not all equal. Because the data are synthetic, this result is for teaching only and should not be treated as evidence about any real treatment or population.
For this dataset, partial eta squared is approximately .970, while generalized eta squared is .300. The contrast is instructive: partial eta squared excludes the large subject component from its denominator, whereas generalized eta squared retains it. Neither value should be mislabeled as simply “eta squared.”
Teaching takeaway: the calculator gives the F-ratio, but the design, correction choice, effect-size definition, and follow-up comparisons determine whether the result is interpreted well.
Repeated Measures ANOVA vs Other Statistical Tests
Repeated measures ANOVA vs ordinary one-way ANOVA
Ordinary one-way ANOVA is for independent groups. Repeated measures ANOVA accounts for the fact that observations from the same subject are related. Treating repeated observations as independent discards that pairing and changes the error model.
Repeated measures ANOVA vs paired t-test
The paired t-test is the natural two-level case. With three or more repeated levels, repeated measures ANOVA provides a single omnibus test instead of running several uncorrected paired t-tests.
Repeated measures ANOVA vs mixed ANOVA
A one-way repeated measures design has a within-subject factor. If the study also contains an independent grouping factor, such as treatment arm or cohort, a mixed ANOVA or suitable mixed model is needed to represent both dimensions.
Repeated measures ANOVA vs Friedman test
The Friedman test is a rank-based alternative for several related conditions. It is not an automatic replacement merely because a normality test returns p < .05. Switching from a mean-based model to a rank-based procedure changes the inferential target, so the decision should reflect the outcome scale, distribution, outliers, sample size, and research question.
Repeated measures ANOVA vs mixed-effects model
Mixed-effects models are more flexible. They can represent subject-level random effects and, depending on the specification, incomplete observations and more complex covariance structures. The trade-off is additional modeling choice and interpretation. GraphPad describes classical repeated measures ANOVA as requiring complete observations, while its mixed-model approach can analyze many incomplete repeated datasets. [6][7]
Common Repeated Measures ANOVA Mistakes
Treating repeated observations as independent groups is one of the most consequential mistakes because it ignores the study design. The second is treating Mauchly’s test as the only piece of evidence that matters for sphericity. A third is reporting only p without the means, uncertainty, and a clearly named effect size.
Missing data deserve special care. Dropping an entire subject because one repeated value is absent can discard considerable information. More importantly, the reason for missingness may be scientifically informative. GraphPad cautions that mixed-model results can still be misleading when observations are missing because participants became very ill, values were outside the measurable range, or another outcome-related event caused dropout. [6]
Order effects can also undermine interpretation even when the arithmetic is perfect. In crossover or sequential-treatment designs, a previous treatment may influence the next measurement. Randomizing treatment order and, where scientifically appropriate, using a washout period address the design problem more directly than an after-the-fact statistical correction. Penn State discusses carryover and washout explicitly in its crossover-design material. [10]
How to Report Repeated Measures ANOVA Results
A useful report should let the reader understand both the numerical result and the analytical choices behind it. State the repeated factor and its levels, number of subjects included, descriptive results, F-statistic, numerator and denominator degrees of freedom, p-value, and the exact effect-size measure. If a sphericity correction was used, name it. If follow-up comparisons were performed, identify the contrast or pairwise method and multiplicity correction.
For a corrected analysis, wording such as “Greenhouse-Geisser corrected” should appear next to the result rather than leaving decimal degrees of freedom unexplained. When generalized eta squared is used, label it η²G rather than substituting the partial-eta symbol.
For a thesis, manuscript, or regulated workflow, follow the reporting rules required by the target journal, institution, protocol, or analysis plan in addition to these statistical essentials.
Frequently Asked Questions About Repeated Measures ANOVA
What is repeated measures ANOVA used for?
It tests whether mean outcomes differ across related conditions or occasions when the same subjects or matched units provide the observations.
How many groups do you need?
The model can be written with two or more repeated levels, but a paired t-test is usually simpler with exactly two. Repeated measures ANOVA is most useful when the factor has three or more levels.
What does the F-statistic mean?
It is the ratio of the mean square associated with the repeated condition to the residual mean square. Larger values indicate that systematic condition variation is large relative to unexplained error.
What does a significant result tell you?
It provides evidence that not all population condition means are equal. It does not identify which pairs differ or whether the effect is practically important.
What should I do if Mauchly's test is significant?
Treat that as evidence against sphericity for the univariate test. Review an appropriate corrected result, such as Greenhouse-Geisser or Huynh-Feldt, or use a model whose covariance structure better suits the data. [3]
Can repeated measures ANOVA handle missing data?
Classical repeated measures ANOVA requires complete repeated observations for included subjects. Mixed-effects models can often use partially observed subjects, but the missing-data mechanism remains important for interpretation. [6][7]
Do I always need post-hoc tests?
No. If the omnibus result is significant and the research question requires locating differences, use planned contrasts or justified pairwise comparisons. A prespecified contrast can be more informative than automatically testing every pair.
Why are corrected degrees of freedom decimals?
Greenhouse-Geisser and Huynh-Feldt corrections multiply the original degrees of freedom by an estimated epsilon. Because epsilon is usually fractional, the corrected degrees of freedom can be fractional as well. [3]
Repeated Measures ANOVA Calculator: Summary and Next Steps
Use a repeated measures ANOVA calculator when the same independent subjects or experimental units are measured across levels of one within-subject factor and the assumptions of the chosen model are defensible. The highest-impact decision is selecting the correct model before interpreting the p-value.
With two repeated measurements, a paired t-test is usually enough. With three or more complete repeated measurements under one factor, one-way repeated measures ANOVA may be appropriate. If sphericity is questionable, use and report a defensible correction. If the design includes an independent grouping factor, consider a mixed design. If missing observations or covariance complexity matter, investigate a mixed-effects model.
After that choice, interpret the ANOVA together with the condition means, uncertainty, a clearly named effect size, and the follow-up comparisons that match the research question. The goal is not merely to obtain p < .05; it is to reach a statistical conclusion that accurately represents the study design and the evidence.
Sources
- Google Search Central: Optimizing your website for generative AI features on Google Search.
- UCLA Statistical Methods and Data Analytics: Choosing a statistical analysis.
- IBM SPSS Statistics: Mauchly’s Test of Sphericity.
- IBM SPSS Statistics: GLM Repeated Measures.
- GraphPad Prism Statistics Guide: Repeated measures one-way ANOVA.
- GraphPad Prism Statistics Guide: Missing values in repeated measures ANOVA.
- GraphPad Prism Statistics Guide: The mixed model approach to analyzing repeated measures data.
- jamovi Documentation: Restructuring Data.
- Lakens D. Calculating and reporting effect sizes to facilitate cumulative science.
- Penn State STAT 502: Repeated Measures / Crossover Designs.
- Google Search Central: Article structured data.
- Google Search Central: SoftwareApplication structured data.
- Google Search Central: General structured data guidelines.