
Spearman Correlation: Meaning, Formula and Uses
A decision-first guide to ranks, monotonicity, tied values, inference, software, and reporting.
Spearman Correlation: Definition, Formula, Uses and Interpretation
Spearman correlation is a rank-based statistical measure of the strength and direction of a monotonic relationship between two paired variables. It is useful when relative order matters more than the exact distance between observations, or when a relationship consistently rises or falls without following a straight line.
The coefficient is commonly written as Spearman’s rho, using the Greek symbol ρ, or as rₛ for a sample statistic. It ranges from −1 to +1. The sign shows direction, while the absolute magnitude shows how closely the data follow a consistent increasing or decreasing order. [1]
What Is Spearman Correlation in Simple Terms?
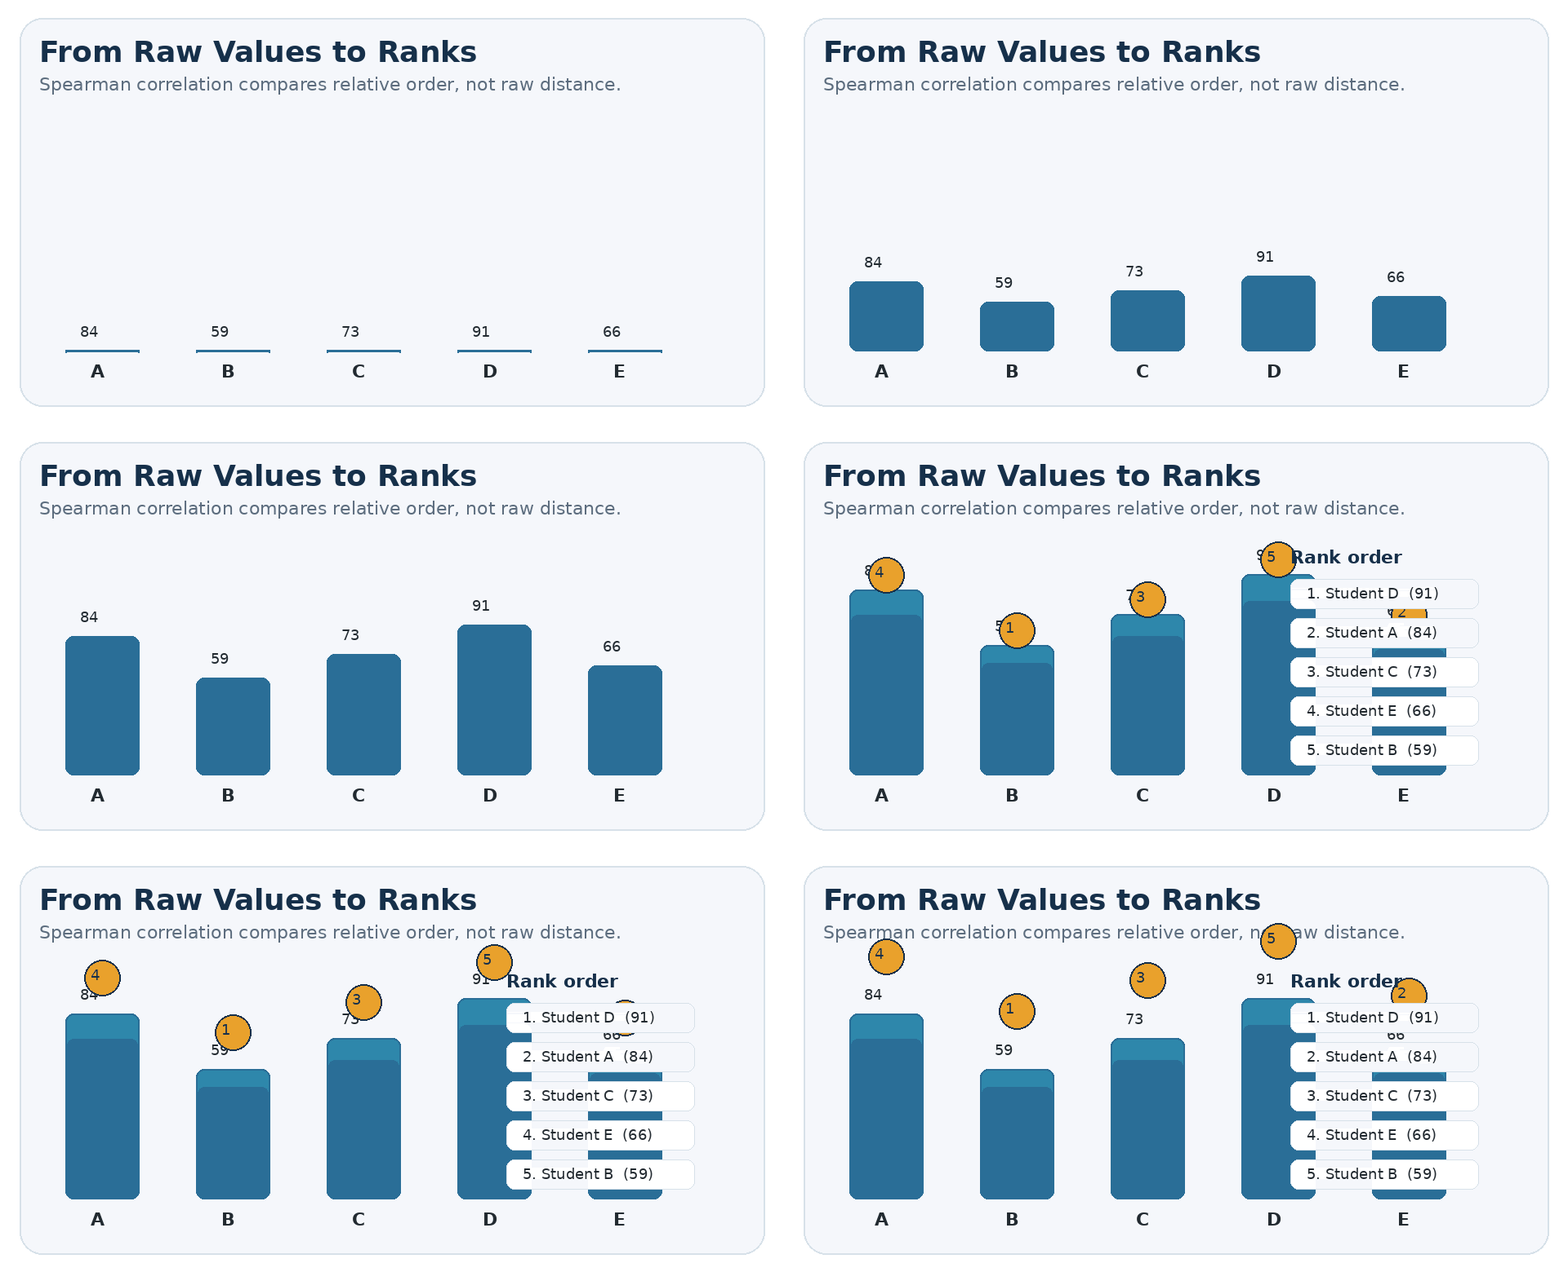
Imagine ranking the same students by mathematics performance and science performance. Spearman correlation asks whether students who occupy higher positions in one ranking also tend to occupy higher positions in the other.
The calculation focuses on relative position rather than the original score gaps. A large numerical difference may become only a one-place difference after ranking. This makes Spearman’s rank correlation especially useful for ordered categories, rankings, and continuous measurements where order is more meaningful than raw distance.
It is best understood as a measure of ordered co-movement. It does not tell you how many units one variable changes when another changes, and it does not provide a predictive equation.
What Does Spearman Correlation Measure?
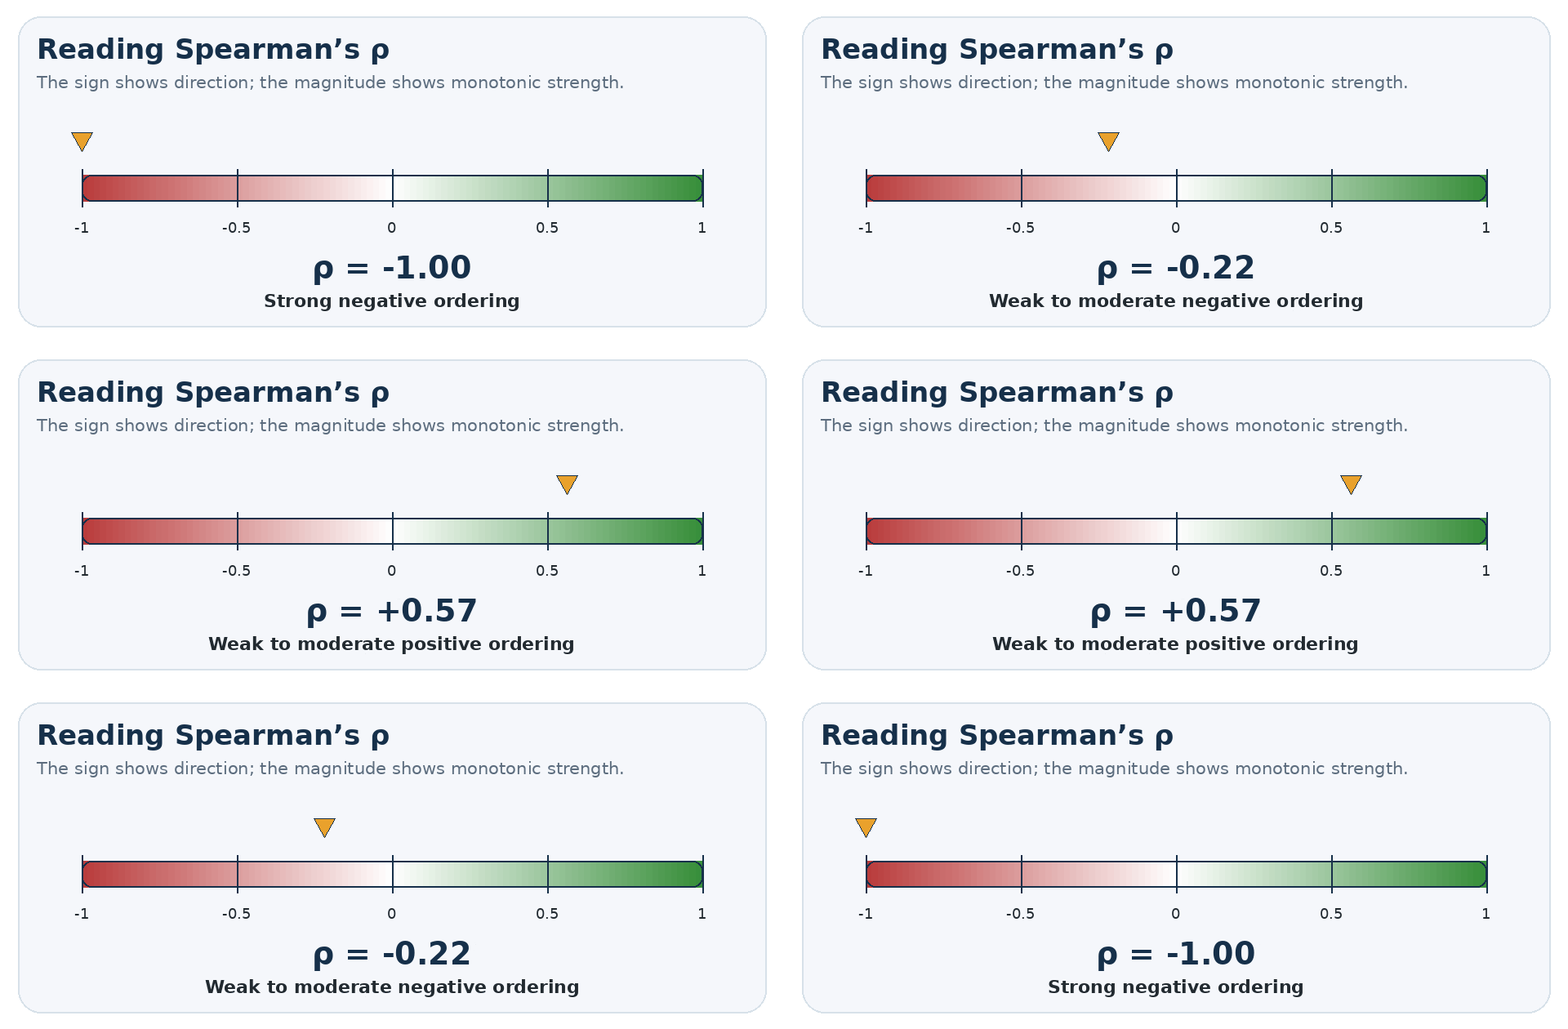
Spearman’s rho measures direction and monotonic strength. A positive coefficient means that higher ranks on one variable generally accompany higher ranks on the other. A negative coefficient means that higher ranks on one variable generally accompany lower ranks on the other.
A coefficient of +1 represents identical rank ordering, while −1 represents exactly reversed ordering. A value near zero means that the observations show little consistent increasing or decreasing rank pattern.
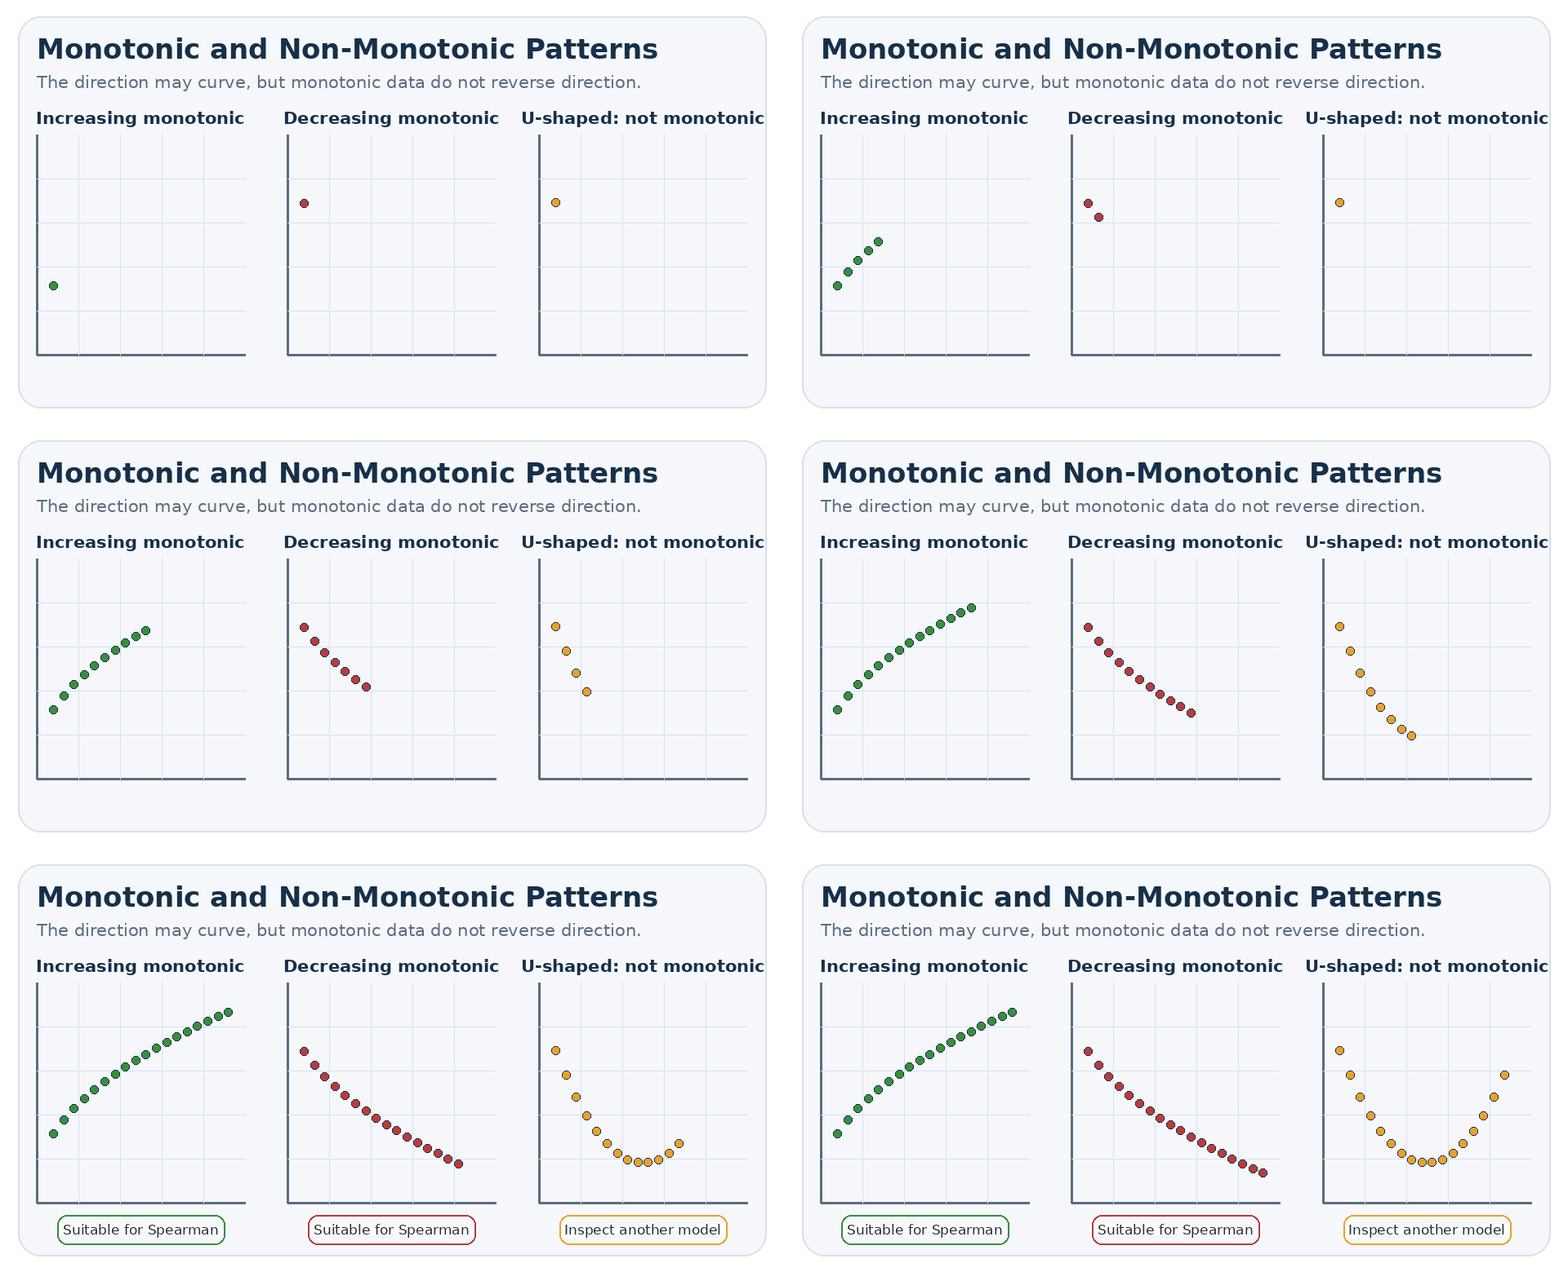
A near-zero result does not prove independence or show that no relationship exists. A clear U-shaped pattern may produce a value near zero because the direction reverses across the range. Spearman correlation detects monotonic association, not every possible form of dependence.
Monotonic Relationships and Why the Scatterplot Matters
A monotonic relationship keeps the same overall direction. In a monotonically increasing relationship, Y generally rises as X rises. In a monotonically decreasing relationship, Y generally falls as X rises. The rate of change may vary, so the pattern can curve without becoming non-monotonic.
A non-monotonic relationship changes direction. For example, an outcome might decline at low values of X and increase after a turning point. One correlation coefficient cannot adequately describe that U-shaped pattern.
A scatterplot should therefore be checked before the statistic is interpreted. The coefficient compresses the relationship into one number, while the graph reveals whether that number is an appropriate summary.
Why Spearman’s Rank Correlation Is Non-Parametric
Spearman’s rank-order correlation is described as non-parametric because it works with ranks and does not require the original paired observations to follow a bivariate normal distribution. The R Project describes Spearman’s method as a rank-based measure of association and computes it as correlation between ranked variables. [3]
Non-parametric does not mean assumption-free. The observations still need to be paired correctly, the ordering must be meaningful, and conventional inference generally expects one pair to be independent of the other pairs.
The p-value can also depend on sample size, tied observations, missing-data treatment, and the software procedure used. The label non-parametric should not be treated as permission to ignore study design or relationship shape.
When Should You Use Spearman Correlation?
Use Spearman correlation when two variables are measured on the same cases and the research question concerns monotonic association. It is a natural choice for ordinal variables such as severity categories, satisfaction levels, preference positions, class rankings, or finishing places.
The method can also be used with interval or ratio data because the original measurements can be converted into ranks. A continuous outcome may increase quickly at first and then level off; Spearman’s rho can remain high when the ordering stays consistently increasing even though the path is curved.
Rank transformation reduces the numerical leverage of extreme raw values because an unusually large observation becomes the highest rank rather than retaining its full numerical distance. It is still important to inspect unusual observations because they can alter ordering, reveal data-quality problems, or identify subgroups.
Do Not Choose It Only Because Normality Failed
The common instruction to use Pearson for normal data and Spearman for non-normal data is incomplete. Pearson correlation measures linear association between original values, while Spearman correlation measures monotonic association between ranks. These are different statistical targets, not merely two versions of the same question.
A skewed dataset can still have a meaningful linear relationship. A normally distributed dataset can contain a curved monotonic pattern. Method selection should begin with the research objective, measurement scale, scatterplot, influential observations, and sampling design rather than a normality test alone.
Assumptions and Data Checks Before Analysis
The variables must be paired, meaning every X value corresponds to the Y value from the same person, object, period, or experimental unit. Both variables must have meaningful order. Ordinal, interval, and ratio data can be ranked, but purely nominal categories such as eye color do not have a natural rank.
Independence applies across pairs. Repeated measurements from one participant, employees nested within departments, or observations collected over time may require a method that accounts for clustering or serial dependence.
The variables must contain variation. A constant variable cannot have a meaningful rank association. Missing values also require a declared rule because pairwise and listwise deletion can produce different sample sizes and different correlation matrices. [6]
Finally, check the scatterplot for monotonicity, unusual points, restricted range, and subgroup structure. These checks often matter more than choosing a particular strength label after the coefficient has been calculated.
Spearman Correlation Formula Explained
Spearman’s rho is formally Pearson correlation applied to two columns of ranks. When no tied ranks are present, the simplified formula is: [5]
In the formula, dᵢ is the difference between the two ranks for observation i, dᵢ² is the squared rank difference, and n is the number of paired observations. Larger rank disagreements increase the sum of squared differences and reduce the coefficient.
The shortcut works cleanly only when the rank columns contain distinct positions. With ties, average ranks should be assigned and Pearson correlation should be calculated between the completed rank columns.
How to Calculate Spearman Correlation
Place the paired observations in two columns so that every row represents the same case. Rank the X values and Y values independently. Rank 1 may represent either the lowest or highest value, provided the direction is applied consistently to both variables.
Calculate the difference between the two ranks in every row, square each difference, and add the squared values. When no ties exist, substitute the total and the sample size into the simplified formula.
For real datasets with repeated values, calculate average ranks and then compute Pearson correlation between the two rank columns. Statistical software normally performs this transformation automatically, but the analyst should still inspect how ties and missing cases were handled.
Calculate Your Spearman Correlation
Want to check your own repeated-measures data without calculating every rank manually? Use our Spearman Correlation Calculator
to enter your conditions, calculate the test statistic and p-value, and review the result.
Spearman Correlation Worked Example
Suppose five students report weekly study hours and receive examination scores. The table shows the raw measurements, their ranks, and the squared rank differences.
| Student | Study Hours | Exam Score | Hours Rank | Score Rank | d | d² |
|---|---|---|---|---|---|---|
| A | 2 | 55 | 1 | 1 | 0 | 0 |
| B | 4 | 65 | 2 | 3 | −1 | 1 |
| C | 6 | 60 | 3 | 2 | 1 | 1 |
| D | 8 | 80 | 4 | 4 | 0 | 0 |
| E | 10 | 90 | 5 | 5 | 0 | 0 |
The sum of squared rank differences is 2 and n equals 5. Substituting these values gives rₛ = 1 − [6(2) ÷ 5(5² − 1)] = 0.90.
The result indicates a strong positive monotonic association in this small example. Students who studied for more hours generally received higher examination scores, although the ordering was not perfect.
The calculation does not show that studying caused the higher scores. Motivation, previous knowledge, teaching quality, sleep, and other variables could influence both study time and performance. The small sample also makes the estimate uncertain.
How to Handle Tied Ranks
A tie occurs when two or more observations have the same value. If two scores would occupy positions three and four, both receive the average rank of 3.5 because neither can be placed ahead of the other.
NIST describes the general calculation by replacing observations with ranks, assigning average ranks to ties, and calculating correlation between those ranks. The simple rank-difference shortcut should not be applied uncritically when ties are present. [5]
Ties are common in questionnaire data, particularly individual five-point Likert items. Spearman’s rho can still be calculated, but extensive ties reduce the amount of distinct ordering information. Kendall’s tau-b may be worth considering when tied pairs are central to the interpretation.
How to Interpret Spearman Correlation Results
The sign gives direction, while the absolute magnitude indicates how closely the ranks follow a consistent monotonic order. A coefficient of 0.70 represents positive ordering; a coefficient of −0.70 represents a similarly strong pattern in the opposite direction.
Terms such as weak, moderate, and strong can support communication, but there are no universal cutoffs that apply equally across medicine, psychology, education, business, and engineering. The same coefficient may have different practical importance in different fields.
Interpretation should combine magnitude, sample size, confidence interval, measurement quality, subject knowledge, and practical consequences. A modest coefficient can matter in a complex system, while a large coefficient can be unreliable when it comes from a small or restricted sample.
Statistical Significance, P-Values, and Small Samples
A conventional two-sided test evaluates whether the population rank association differs from zero. A one-sided test evaluates a prespecified positive or negative direction. The direction should be chosen before the result is inspected.
The p-value does not measure effect size or practical importance. Large samples can make small coefficients statistically significant, while small samples may leave a large coefficient uncertain.
Software can use different inferential procedures. SciPy’s documentation explains that its common asymptotic p-value is most accurate for large samples and advises permutation testing for smaller samples. R documents exact or algorithmic calculations under some settings and asymptotic approximations under others. [1]
Published methodological research has shown that common Spearman tests can have poor Type I error control in some small-sample or nonstandard distribution settings and proposes a studentized permutation test as a more robust alternative. This is a qualification of routine inference, not a claim that every conventional result is invalid. [10]
In practical work, record the software version, test direction, missing-value rule, tie handling, and p-value method. These details matter most when the sample is small or the result lies close to a decision threshold.
Confidence Intervals for Spearman’s Rho
A p-value evaluates compatibility with a null procedure. A confidence interval communicates uncertainty around the estimated coefficient. A narrow interval suggests greater precision, while a wide interval means meaningfully weaker or stronger population associations remain plausible.
IBM SPSS provides confidence-interval options for Spearman correlation, including several variance-estimation methods. Base R’s standard cor.test output does not provide the same built-in confidence interval for Spearman as it does for Pearson, so a justified bootstrap or specialist package may be needed. [7]
The reporting statement should name the interval method because analytic, bootstrap, and permutation-based procedures do not necessarily produce identical limits.
Spearman Correlation vs Pearson Correlation
| Feature | Spearman Correlation | Pearson Correlation |
|---|---|---|
| Values analyzed | Ranked values | Original numerical values |
| Relationship measured | Monotonic | Linear |
| Suitable measurement | Ordinal, interval, or ratio | Mainly interval or ratio |
| Normality needed to calculate coefficient | No | No |
| Effect of extreme numerical values | Generally lower | Generally higher |
| Curved monotonic pattern | Can represent it well | May understate it |
| Common notation | ρ or rs | r |
Choose Pearson when the scientific question concerns linear association in the original measurement units and the scatterplot supports that interpretation. Choose Spearman when ordered position is the meaningful target or when the pattern remains consistently increasing or decreasing without being linear.
Reporting both coefficients can sometimes act as a sensitivity analysis, but only when the reason is stated. Selecting whichever test produces the smaller p-value is not a valid method-selection strategy.
Spearman Correlation vs Kendall’s Tau
Spearman’s rho and Kendall’s tau are both rank-based measures, but they summarize ordering differently. Spearman calculates correlation between rank values, while Kendall examines whether pairs of observations are concordant, discordant, or tied.
Kendall’s tau-b is often considered when a dataset contains many ties or when a pairwise probability interpretation is useful. Spearman remains widely used because it is familiar, straightforward to calculate, and directly connected to Pearson correlation on ranks.
Neither method is universally superior. The choice depends on the intended interpretation, tie structure, sample size, software procedure, and reporting convention.
When Rank Correlation May Fail
Spearman correlation should not be the sole summary of a U-shaped, inverted-U, cyclical, segmented, or otherwise non-monotonic relationship. A regression model, spline, generalized additive model, or another dependence measure may better represent the actual shape.
The statistic is also not a predictive model. It does not estimate how many units Y will change when X changes, adjust for confounding variables, generate forecasts, or establish a causal mechanism.
Ordinary inference can be misleading when observations are repeated, clustered, time-dependent, or selected from only part of the available range. Subgroup structure can also hide or reverse patterns. A scatterplot colored by relevant categories can reveal relationships that the overall coefficient conceals.
Real-World Applications of Spearman Correlation
In education, the method can compare class rankings across subjects or relate ordered engagement ratings to examination performance. In psychology and health research, it can examine relationships involving symptom severity, questionnaire scores, disease stages, behavioral ratings, or ordered treatment responses.
Business researchers may compare customer satisfaction with renewal likelihood, service ratings with purchase frequency, or employee performance positions across review systems. Sports analysts can compare rankings across competitions, while environmental researchers can relate ordered pollution levels to biological responses.
In machine learning, recommendation systems, and information retrieval, Spearman’s rho can assess whether predicted scores preserve the observed order. It evaluates overall ranking agreement; top-weighted metrics may be more suitable when only the first few recommendations or search results matter.
Generative tools such as ChatGPT or Gemini can help explain output, draft code, or reformat a results statement, but the coefficient and p-value should be verified in statistical software. AI-generated interpretation does not replace inspection of the data, assumptions, and study design.
How to Run Spearman Correlation in Statistical Software
IBM SPSS Statistics
Open Analyze, select Correlate, and choose Bivariate. Move the variables into the analysis box and select Spearman. Review the selected missing-value rule, test direction, confidence-interval settings, and the number of cases used. [6]
R
Use the following command for a two-sided Spearman test. Record the R version and the exact or approximate setting used because inferential details can differ across samples. [4]
cor.test(x, y, method = "spearman", alternative = "two.sided")Python and SciPy
SciPy calculates the coefficient and p-value through spearmanr. Inspect the missing-value policy and consider a permutation procedure for a smaller sample. [1]
from scipy import stats

result = stats.spearmanr(x, y, nan_policy="omit")
print(result.statistic)
print(result.pvalue)
Microsoft Excel
Excel can calculate the coefficient by ranking both variables with RANK.AVG and then correlating the rank columns with CORREL. This workflow returns the coefficient; additional calculations are needed for a defensible p-value or confidence interval. [8]
=RANK.AVG(A2,$A$2:$A$11,1)
=CORREL(C2:C11,D2:D11)
How to Report Spearman Correlation
A complete report identifies the variables, coefficient, sample size, direction, p-value method, and practical interpretation. Include a confidence interval when a justified procedure is available.
A suitable statement is: “A Spearman rank correlation showed a positive monotonic association between study engagement and examination performance, rₛ = .62, n = 84, two-sided p < .001, 95% CI [.46, .74]. Students with higher engagement scores generally achieved higher examination scores.”
For a non-significant result, write that the analysis did not provide clear evidence of a monotonic association rather than claiming that no relationship exists. Avoid causal wording such as caused, affected, or led to unless the research design genuinely supports causal inference.
Common Mistakes and Misconceptions
The most common mistake is selecting Spearman automatically because a normality test rejected normality. The research question and relationship shape should determine the method.
Another mistake is applying the no-ties formula to repeated values. Average ranks and correlation between the rank columns provide the general calculation. A third error is treating a near-zero coefficient as evidence of no relationship, even though a strong non-monotonic pattern may be present.
Researchers also overuse fixed strength labels, report only a p-value, ignore uncertainty, and treat statistical significance as practical importance. When many correlations are tested, a prespecified analysis plan and an appropriate multiple-testing correction may be necessary.
You May Also Like Linear Regression Calculator
FAQs
Does Spearman Correlation Require Normal Data?
No. The coefficient is calculated from ranks and does not require the original variables to be normally distributed. The inferential procedure must still suit the sample and study design.
Can It Be Used for Continuous Data?
Yes. Continuous measurements can be converted into ranks before the coefficient is calculated.
Can It Handle Tied Values?
Yes. Tied observations should receive the average of the ranks they would otherwise occupy.
Is It Resistant to Outliers?
It is generally less sensitive to the numerical size of extreme values than Pearson correlation, but unusual observations can still alter ranks or reveal data problems.
Can It Detect Curved Relationships?
It can detect curved relationships that remain monotonic. It does not reliably summarize curves that reverse direction.
What Is a Good Spearman Coefficient?
There is no universal threshold. Interpret the value using subject knowledge, uncertainty, sample size, measurement quality, and practical consequences.
Does a High Coefficient Prove Causation?
No. A high coefficient shows strong monotonic association, not that one variable caused the other.
What Is the Minimum Sample Size?
There is no single minimum that guarantees a reliable conclusion. Plan the sample using the expected association, desired power, significance level, measurement quality, and study design.
Spearman Correlation Summary and Practical Next Step
Spearman correlation is the right choice when the central question is whether higher positions on one variable consistently correspond to higher or lower positions on another.
Before running it, confirm that the observations are paired, the variables have meaningful order, and the scatterplot shows an approximately monotonic pattern. Review ties, missing values, unusual observations, subgroup structure, and dependence between cases.
Choose Pearson when linear association in the original units is the target. Consider Kendall’s tau when pairwise concordance or extensive ties are central. For small or unusual samples, consider a justified resampling procedure rather than accepting a default asymptotic p-value without review.
The practical value of Spearman correlation comes from matching the method to the research question, inspecting the full data pattern, handling ranks transparently, and reporting the coefficient with its uncertainty and limitations.
Authoritative Sources
The article uses primary software documentation and methodological research for claims that require verification.
[1] SciPy: spearmanr documentation
[2] SciPy tutorial: Spearman correlation coefficient
[3] R Project: Correlation, variance and covariance
[4] R Project: Test for association between paired samples
[5] NIST: Rank correlation independence test
[6] IBM SPSS Statistics: Bivariate correlations
[7] IBM SPSS Statistics: Bivariate correlations confidence interval
[8] Microsoft Support: RANK.AVG function
[9] Microsoft Support: Statistical functions reference
[10] Yu and Hutson: A robust Spearman correlation coefficient permutation test
Try it in DataClue
Ready to run Summary Statistics?
Calculate mean, median, mode, standard deviation, variance, range, and quartiles for your data.
Run Summary Statistics