
State GDP Growth: Compare U.S. Economies by State
See how real GDP growth differs across U.S. states using official BEA data. Compare rankings, industry drivers, the national benchmark, and an interactive quarterly map.
State GDP Growth: Compare U.S. Economies
See how real GDP growth differs across U.S. states using official BEA data. Compare rankings, industry drivers, the national benchmark, and an interactive quarterly map.
The U.S. economy does not grow at one speed. Every quarter, some state economies expand much faster than the national average, while others slow or contract. A state GDP growth comparison helps show where economic momentum is strongest and where it is weaker.
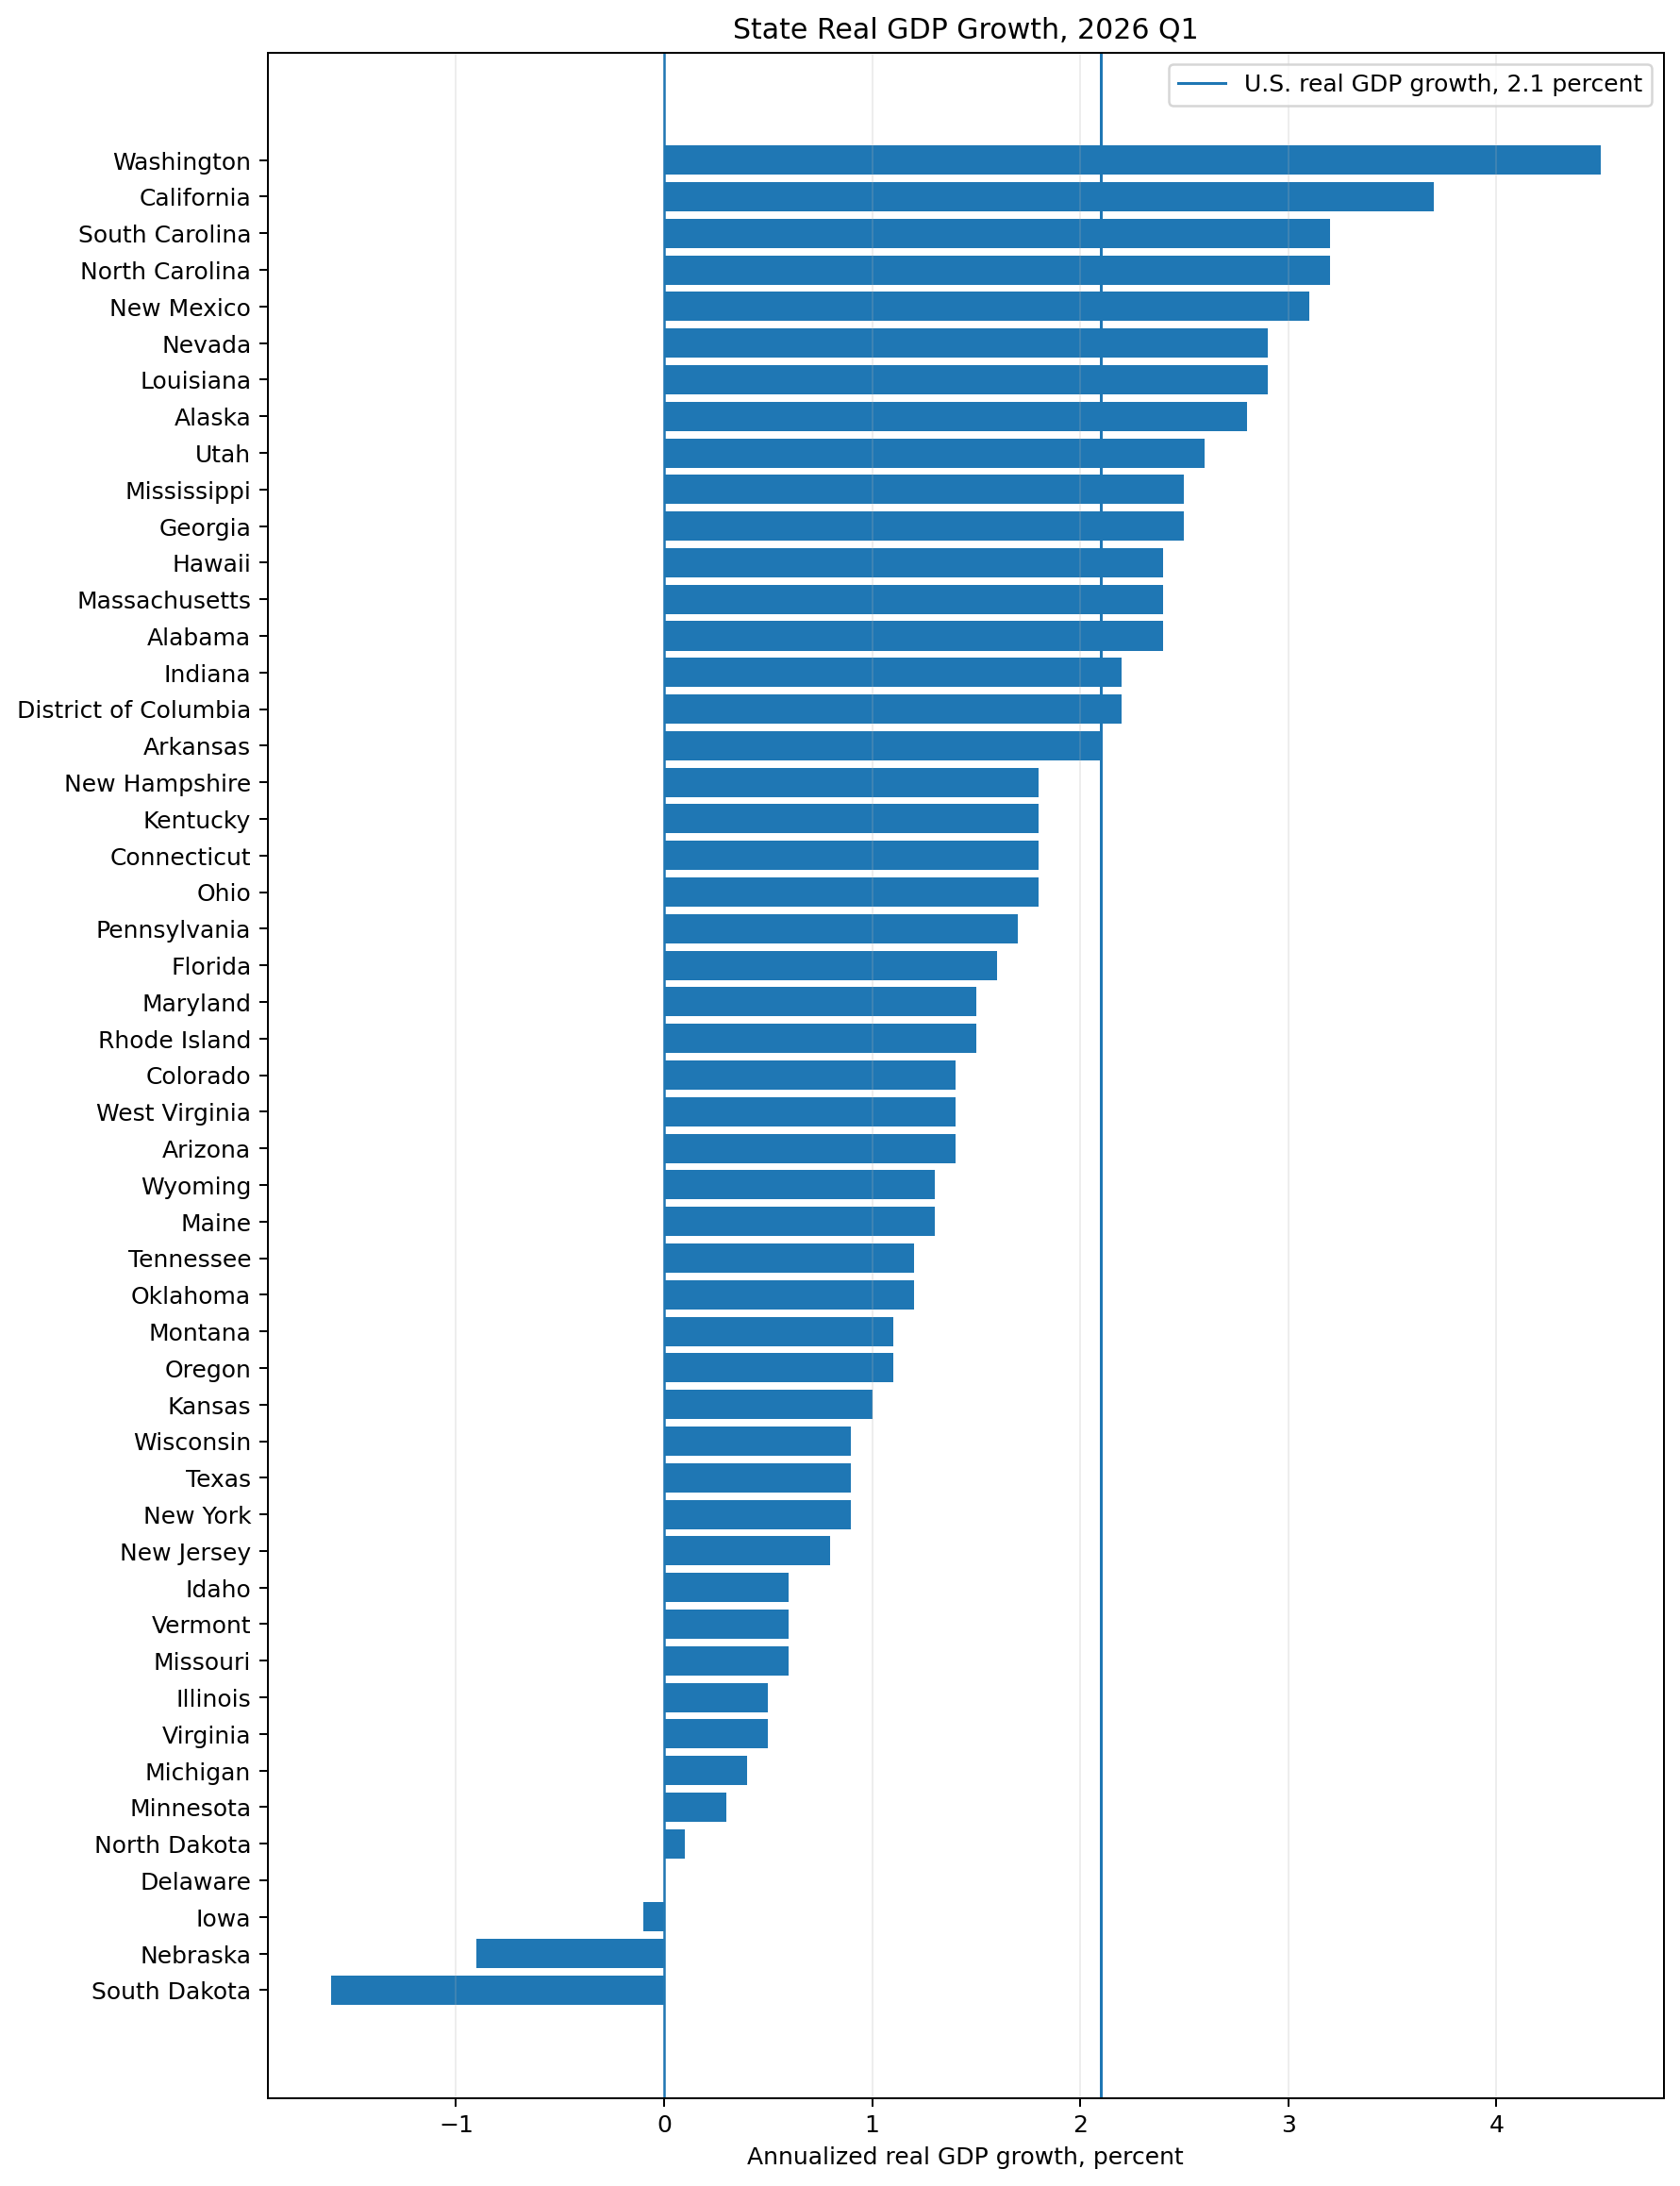
The latest comparable state data cover the first quarter of 2026. Real GDP increased in 46 states and the District of Columbia. Washington grew the fastest at a 4.5 percent annual rate. South Dakota had the weakest result at minus 1.6 percent, while Delaware was essentially unchanged.
The national economy grew at a 2.1 percent annual rate in the same quarter. That is the correct national benchmark for this state comparison. National GDP data for the second quarter are already available, but second quarter state GDP will not be released until September 30, 2026.
Quick Answer
Interactive State GDP Map
The map below compares 2026 Q1 real GDP growth across the states and the District of Columbia. Hover over a state to see the exact growth rate, its gap from the national pace, its recent average, and year over year real GDP growth.
State GDP Growth Comparison: Latest Rankings
BEA reported positive real GDP growth in 46 states and the District of Columbia in 2026 Q1. Three states contracted, while Delaware was unchanged after rounding. The median state growth rate was 1.4 percent.
Fifteen states grew faster than the 2.1 percent U.S. rate. The difference between Washington and South Dakota was 6.1 percentage points, which shows how strongly industry mix can shape state results.
| Rank | State | Growth | Gap from U.S. | Recent four quarter average |
|---|---|---|---|---|
| 1 | Washington | 4.5% | +2.4 pp | 2.7% |
| 2 | California | 3.7% | +1.6 pp | 3.3% |
| 3 | North Carolina | 3.2% | +1.1 pp | 3.4% |
| 4 | South Carolina | 3.2% | +1.1 pp | 2.7% |
| 5 | New Mexico | 3.1% | +1.0 pp | 2.9% |
| 6 | Louisiana | 2.9% | +0.8 pp | 2.7% |
| 7 | Nevada | 2.9% | +0.8 pp | 2.7% |
| 8 | Alaska | 2.8% | +0.7 pp | 2.1% |
| 9 | Utah | 2.6% | +0.5 pp | 2.7% |
| 10 | Georgia | 2.5% | +0.4 pp | 2.6% |
Which States Are Growing Fastest?
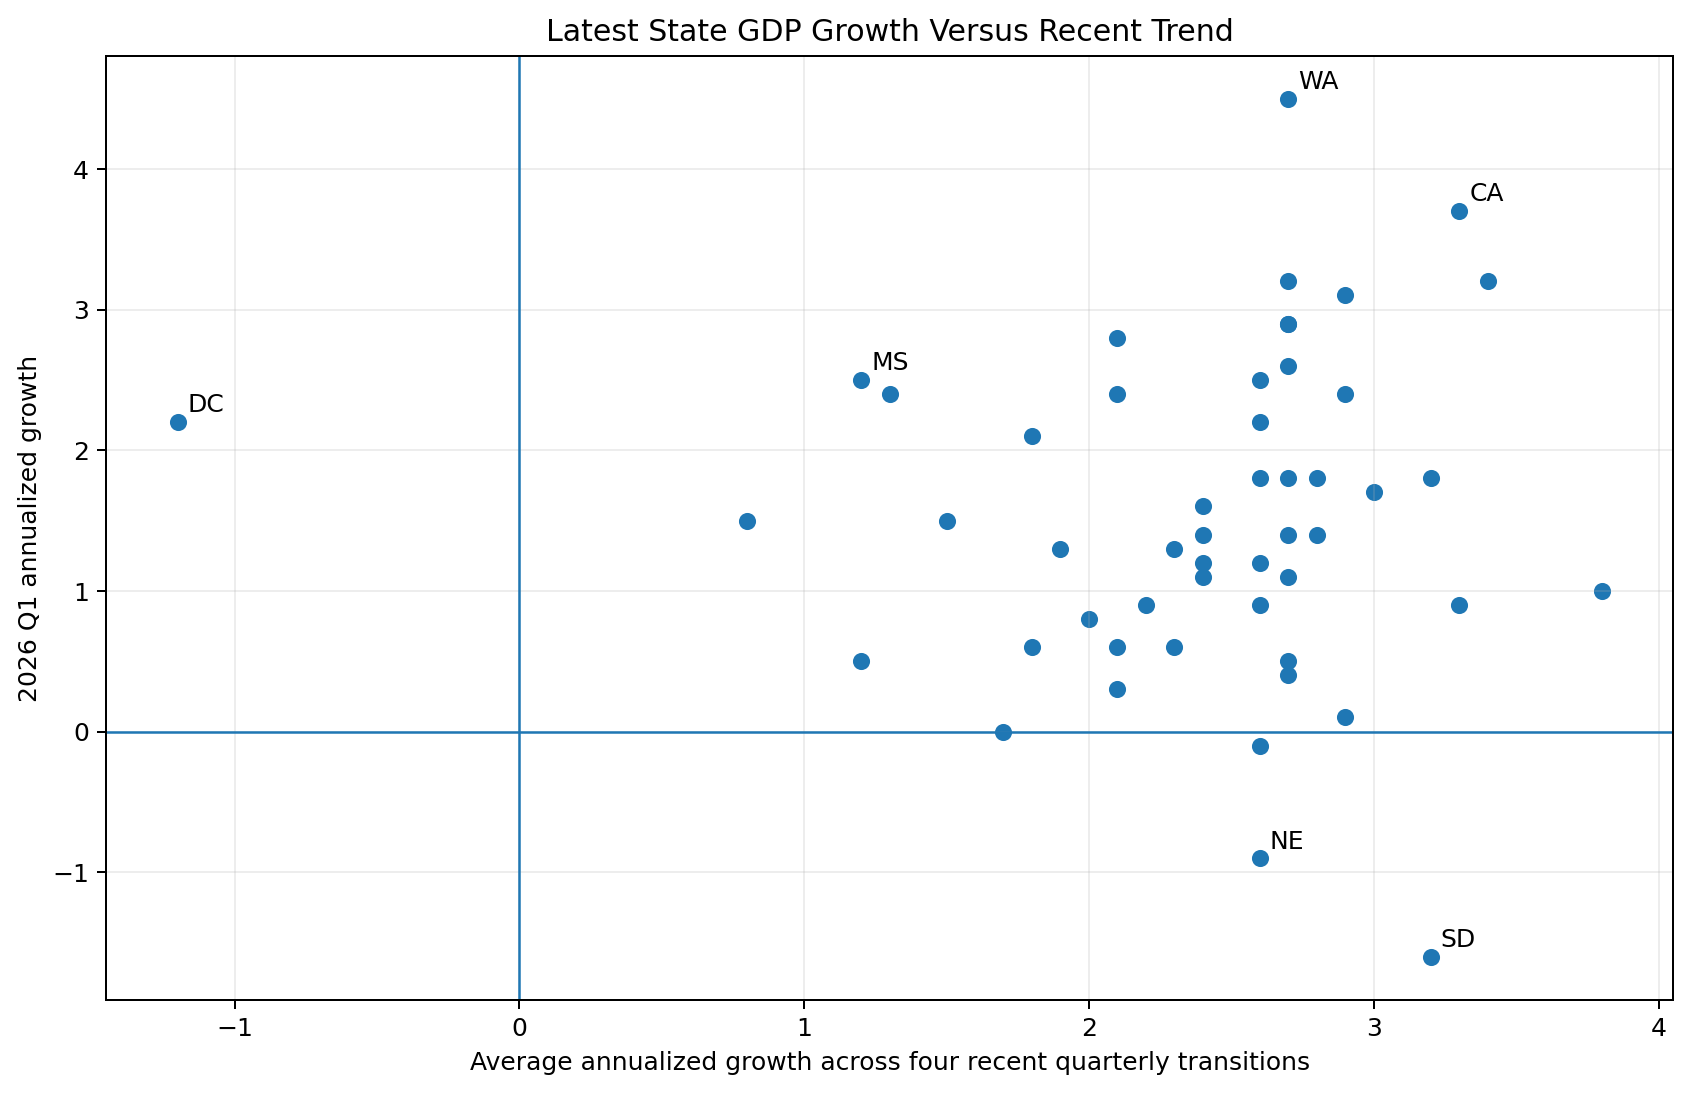
Washington led the country at 4.5 percent annualized growth. BEA identified information as the leading contributor to the increase. That result fits the state's large technology and digital services base, but the data should be read as a quarterly output measure rather than a broad judgment about every business or household.
California ranked second at 3.7 percent. North Carolina and South Carolina grew about 3.2 percent. New Mexico grew 3.1 percent, while Louisiana and Nevada were near 2.9 percent.
Alaska, Utah, Georgia, Mississippi, Alabama, Massachusetts, and Hawaii also grew faster than the national pace. A strong one quarter rate can change quickly, so recent average growth is useful as a second check.
Which State Economies Are Contracting?
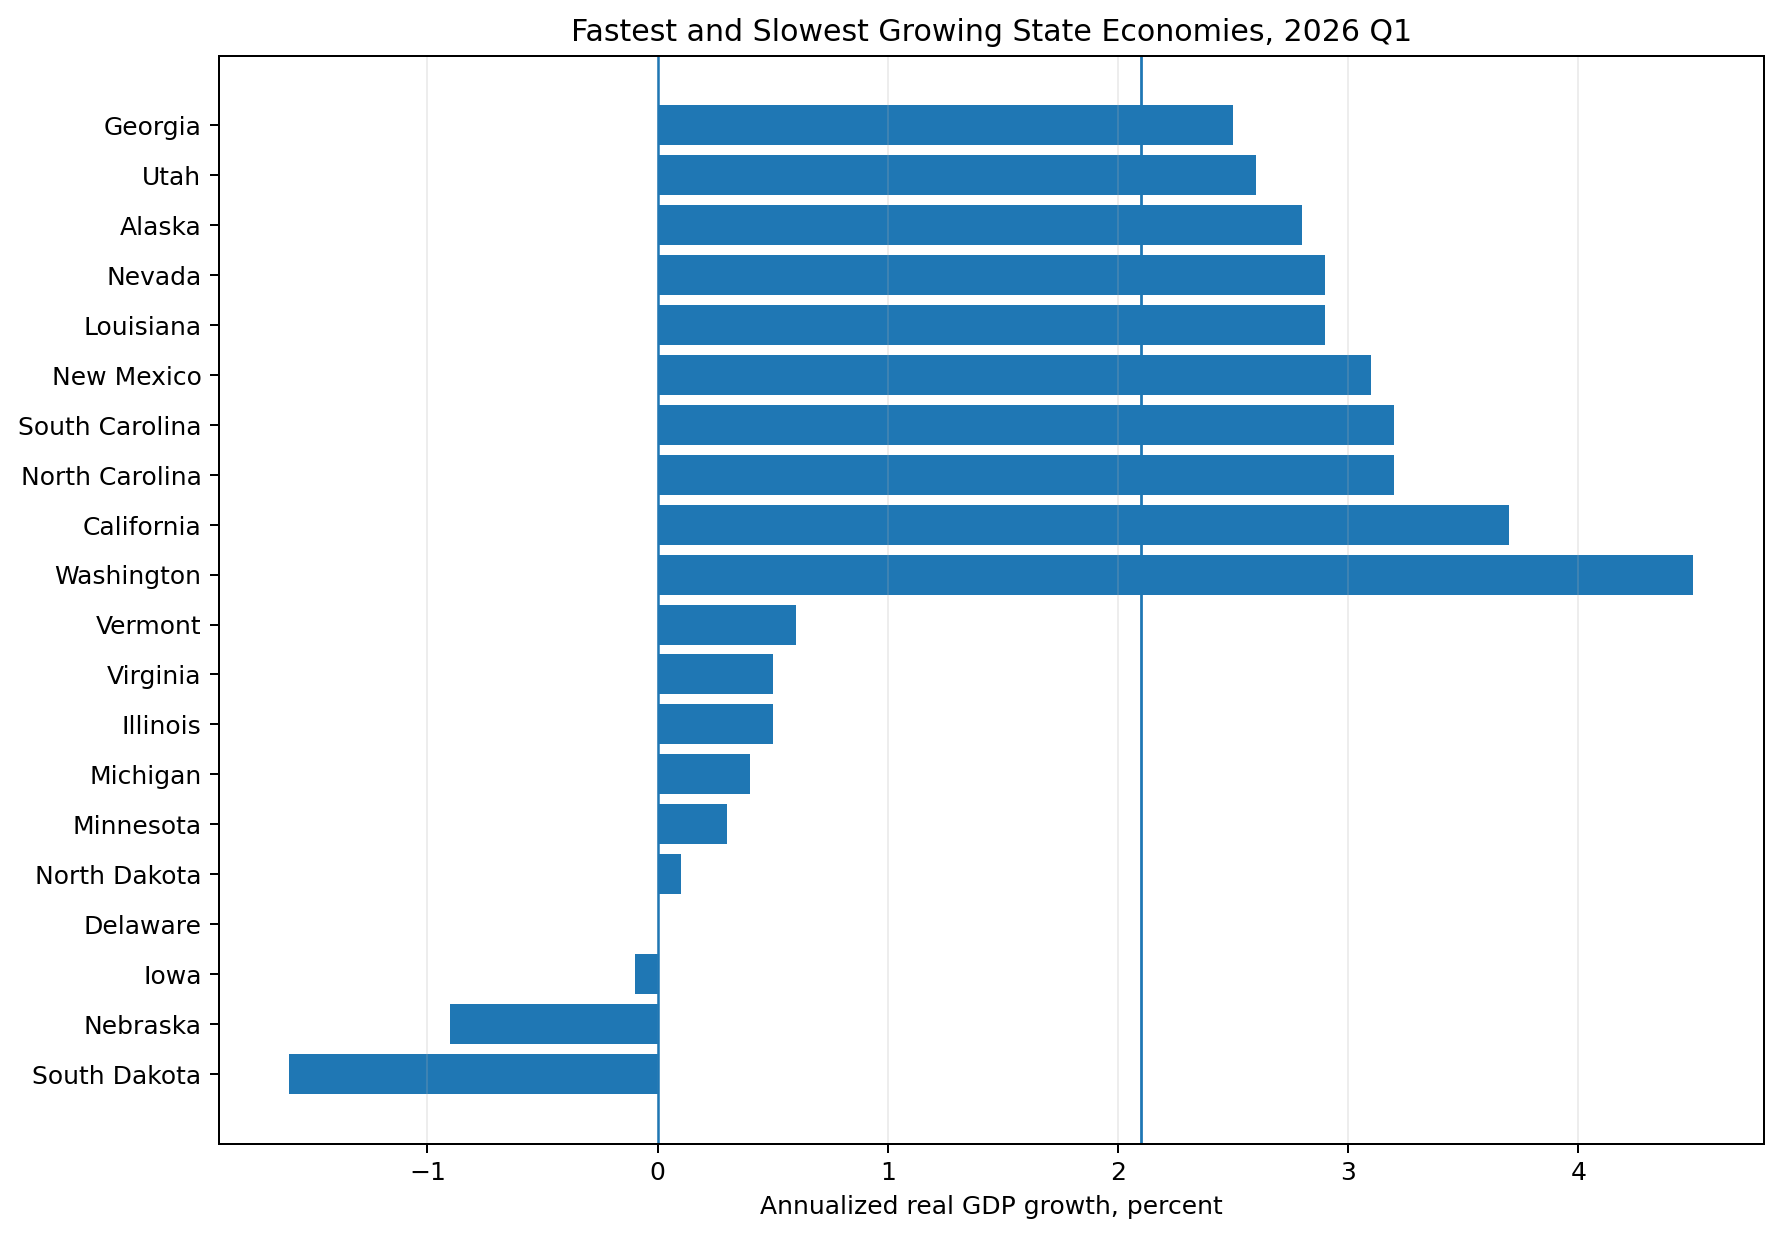
South Dakota had the weakest reading, with real GDP falling at a 1.6 percent annual rate. BEA said agriculture, forestry, fishing and hunting was the leading contributor to the decline.
Nebraska contracted 0.9 percent and Iowa edged down 0.1 percent. Delaware was essentially flat. A negative quarter does not automatically mean a state is in recession, especially when an industry such as agriculture, energy, or manufacturing can create large short term changes.
| Rank | State | Growth | Gap from U.S. | Recent four quarter average |
|---|---|---|---|---|
| 51 | South Dakota | -1.6% | -3.7 pp | 3.2% |
| 50 | Nebraska | -0.9% | -3.0 pp | 2.6% |
| 49 | Iowa | -0.1% | -2.2 pp | 2.6% |
| 48 | Delaware | 0.0% | -2.1 pp | 1.7% |
| 47 | North Dakota | 0.1% | -2.0 pp | 2.9% |
| 46 | Minnesota | 0.3% | -1.8 pp | 2.1% |
| 45 | Michigan | 0.4% | -1.7 pp | 2.7% |
| 43 | Illinois | 0.5% | -1.6 pp | 2.7% |
| 44 | Virginia | 0.5% | -1.6 pp | 1.2% |
| 42 | Vermont | 0.6% | -1.5 pp | 1.8% |
How State Growth Compares With U.S. GDP
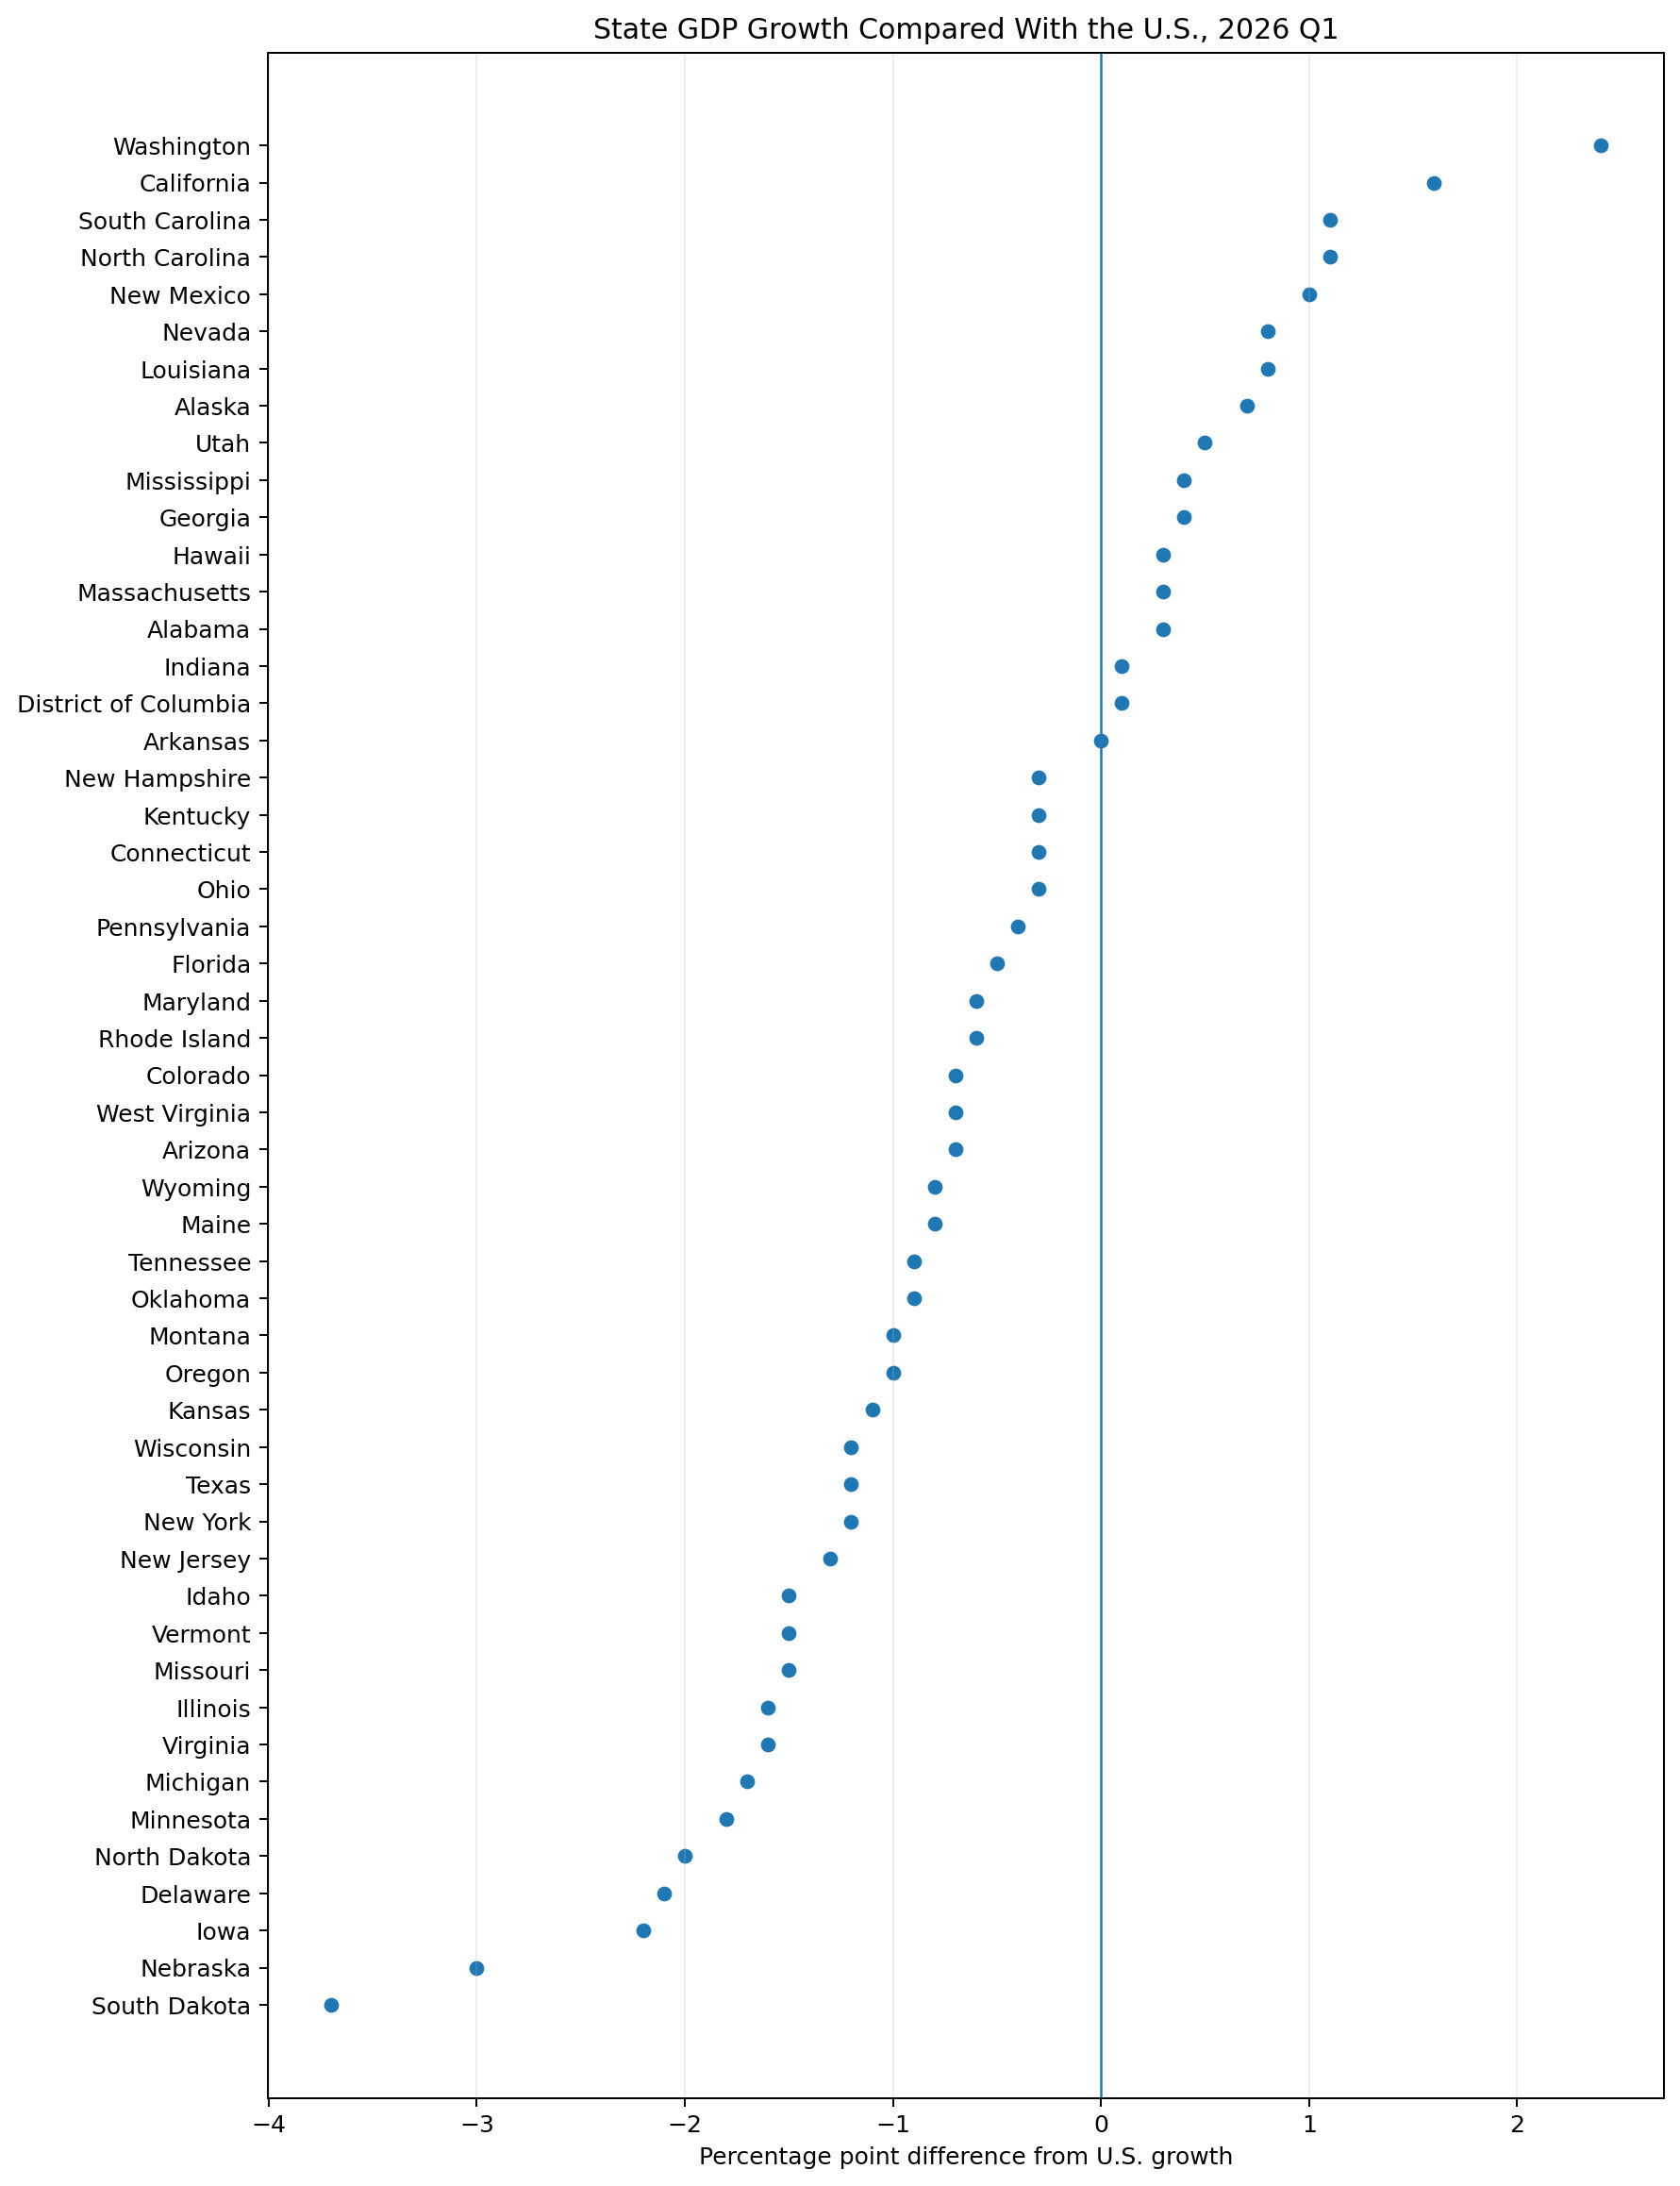
The national economy grew at a 2.1 percent annual rate in 2026 Q1. This is the correct benchmark because it covers the same quarter as the state data.
Washington was 2.4 percentage points above the national pace. South Dakota was 3.7 points below it. Many states posted positive growth while still expanding more slowly than the country as a whole.
What Is State GDP?
Gross domestic product by state measures the value of goods and services produced within a state. It is the regional version of national GDP.
State GDP can answer two different questions. Total GDP shows the size of a state economy. GDP growth shows how quickly inflation adjusted output changed. This article focuses on growth.
Real GDP Versus Current Dollar GDP
Current dollar GDP uses the prices that existed during the period. It can rise because a state produced more, because prices rose, or because both happened.
Real GDP removes the effect of changing prices. That makes it the better measure for comparing changes in actual economic output across states.
Why Quarterly Growth Is Reported at an Annual Rate
BEA reports most quarterly percent changes at annual rates. The calculation asks what the full year pace would be if the latest quarter continued for four quarters.
Washington's 4.5 percent figure therefore does not mean its economy became 4.5 percent larger in three months. The actual quarter to quarter increase was smaller. The 4.5 percent figure expresses that movement at an annual pace.
What Industries Drive State GDP Growth?
State economies have different industry mixes. Technology, farming, energy, tourism, manufacturing, finance, professional services, and government can have very different weights from one state to another.
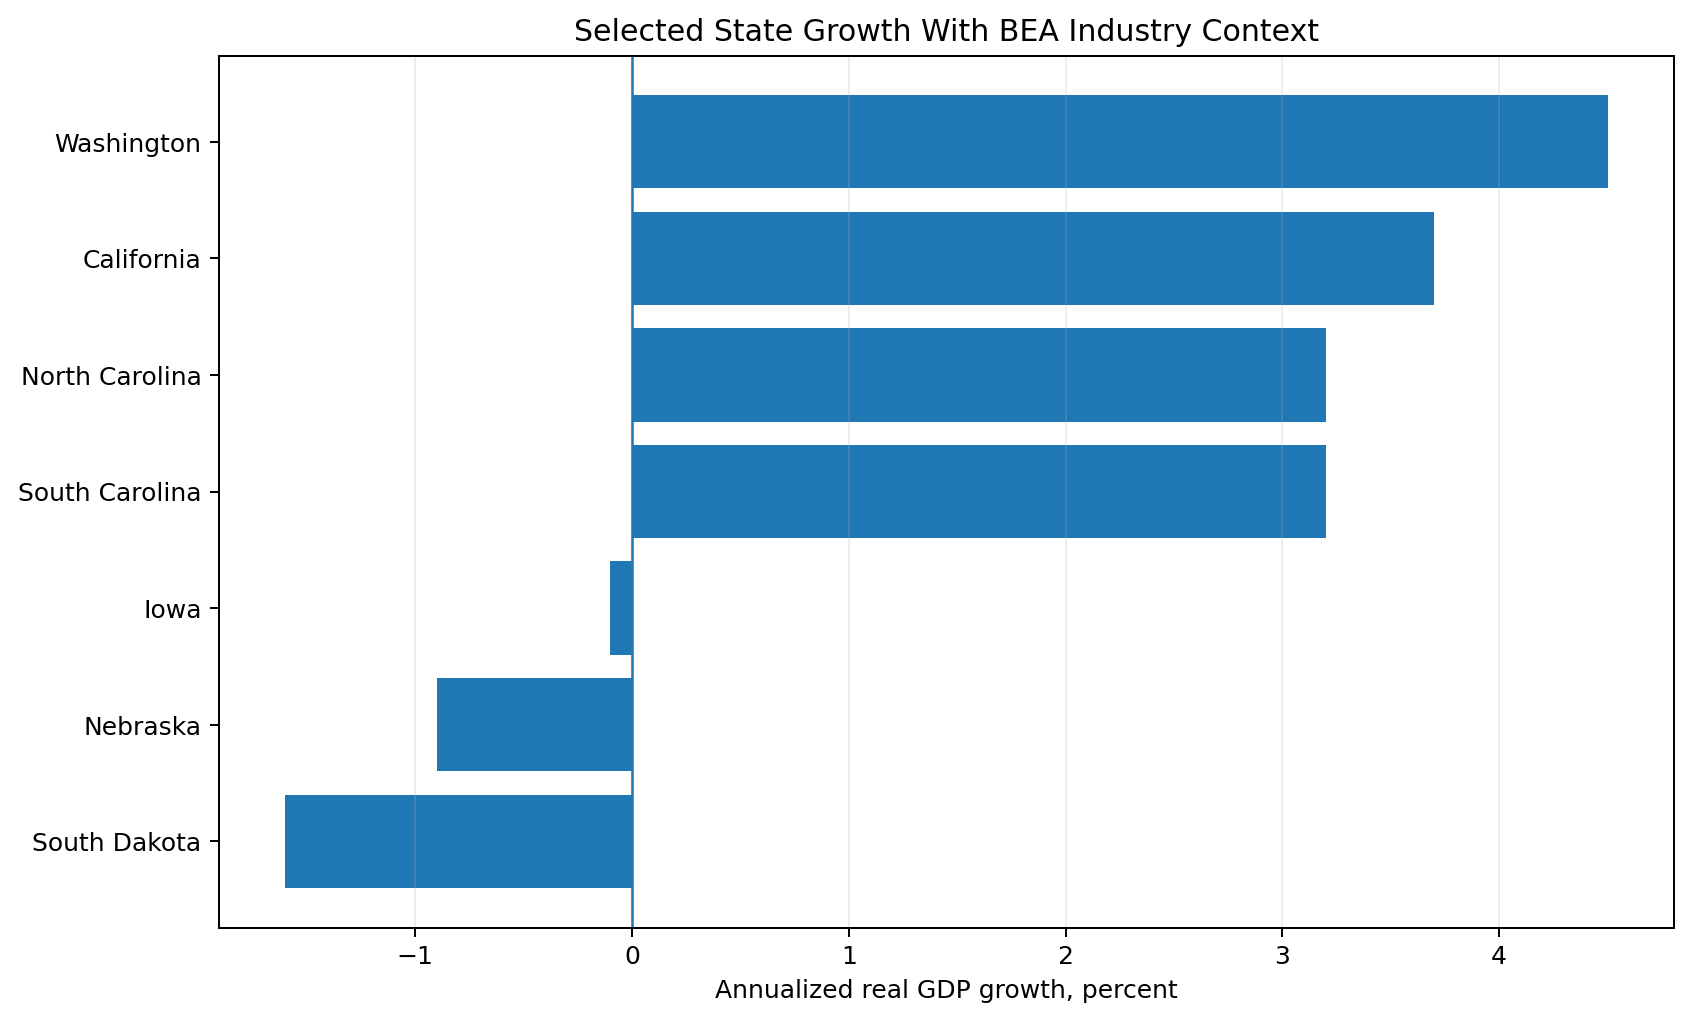
BEA table SQGDP11 shows industry contributions to changes in real GDP by state. In 2026 Q1, information was the leading contributor to Washington's increase. Agriculture, forestry, fishing and hunting was the leading contributor to South Dakota's decline.
This is why a state GDP ranking should not stop at the headline rate. Industry contributions help explain why two states can move in opposite directions during the same national quarter.
How Stable Are State Growth Rankings?
One quarter can be noisy. A useful trend check compares the latest rate with several earlier quarters.
Washington's latest 4.5 percent rate was above its recent four quarter average of about 2.7 percent. California's 3.7 percent rate was close to its recent average near 3.3 percent. South Dakota was negative in the latest quarter even though its recent average remained positive because earlier quarters were stronger.
Rankings can change after revisions as well. A state should not be called structurally strong or weak from one quarter alone.
How State GDP Growth Changed Over Time
The recent animation below shows four quarterly transitions from 2025 Q2 through 2026 Q1. The scale stays fixed across frames, which makes changes easier to compare without visual rescaling.
The Python method in the next section can extend the same analysis back to 2005 using the BEA API or a complete historical download. This standalone HTML embeds recent quarters so the file remains self contained.
How to Download BEA State GDP Data With Python
The BEA Regional API can return quarterly GDP by state. Use an API key stored in an environment variable rather than putting a private key directly in a public notebook or article.
import os
import requests
import pandas as pd

BEA_KEY = os.environ.get("BEA_API_KEY")

params = {
    "UserID": BEA_KEY,
    "method": "GetData",
    "datasetname": "Regional",
    "TableName": "SQGDP1",
    "GeoFips": "STATE",
    "Year": "ALL",
    "ResultFormat": "JSON",
}

response = requests.get(
    "https://apps.bea.gov/api/data",
    params=params,
    timeout=60,
)
response.raise_for_status()
payload = response.json()
Inspect the current table metadata before choosing a line code. Then calculate annualized quarter to quarter growth from real GDP levels when needed.
def annualized_growth(current_level, prior_level):
    return (
        (current_level / prior_level) ** 4 - 1
    ) * 100

state_panel["growth"] = (
    state_panel
    .groupby("State")["RealGDP"]
    .transform(
        lambda s: (
            (s / s.shift(1)) ** 4 - 1
        ) * 100
    )
)

latest = (
    state_panel
    .sort_values("Quarter")
    .groupby("State")
    .tail(1)
    .sort_values("growth", ascending=False)
)
How to Build the Interactive Map in Python
Plotly can map state postal codes directly. Keep a normal HTML table below the map so exact values remain accessible even if JavaScript is unavailable.
import plotly.express as px

fig = px.choropleth(
    latest,
    locations="StateCode",
    locationmode="USA-states",
    color="growth",
    scope="usa",
    hover_name="State",
    hover_data={
        "growth": ":.1f",
        "USGap": ":.1f",
        "FourQuarterAverage": ":.1f",
    },
)

fig.update_layout(
    title="State GDP Growth Across the U.S.: Latest Quarter"
)

fig.show()
Common Mistakes When Comparing State Economies
- Do not rank states by total GDP size when the question is growth.
- Do not mix current dollar GDP with real GDP.
- Do not treat an annualized quarterly rate as the actual full year change.
- Do not compare state and national figures from different quarters without a clear note.
- Do not ignore revisions.
- Do not present the District of Columbia as one of the 50 states.
- Do not use an interactive map without a crawlable table of exact values.
Limits of State GDP Data
State GDP is a broad measure of production, not a complete measure of household well being. Strong GDP growth does not mean every worker, industry, or community in a state is doing well.
The estimates are also revised. The September 30, 2026 release will add the next state quarter and begin the 2026 regional annual update, which can change recent historical values.
Conclusion
The latest state GDP growth comparison shows an economy that is expanding at very different speeds across the country. Washington led at 4.5 percent, California followed at 3.7 percent, and several Southern and Western states grew faster than the nation.
South Dakota, Nebraska, and Iowa contracted, even as U.S. real GDP grew 2.1 percent. The most useful reading combines the latest ranking with the national benchmark, recent trends, and industry contributions.
Frequently Asked Questions
Which state has the fastest GDP growth?
Washington had the fastest real GDP growth in 2026 Q1 at a 4.5 percent annual rate, according to BEA.
Which state economy grew the slowest?
South Dakota had the weakest result in 2026 Q1, with real GDP falling at a 1.6 percent annual rate.
What is real GDP by state?
Real GDP by state measures inflation adjusted economic output produced within each state. It is useful for comparing changes in actual production over time.
Why is quarterly state GDP growth annualized?
BEA converts the quarter to quarter change into an annual pace. This makes quarterly rates easier to compare, but it does not mean the economy changed by the full annualized percentage in only three months.
What is the difference between state GDP growth and GDP size?
GDP size shows how large a state economy is. GDP growth shows how fast its inflation adjusted output changed.
Which industries drive state GDP growth?
The answer differs by state. BEA table SQGDP11 shows industry contributions. In 2026 Q1, information led Washington's increase, while agriculture was the leading drag in South Dakota.
How often is GDP by state released?
BEA releases state GDP quarterly with the third estimate of national GDP.
Does BEA revise state GDP data?
Yes. State estimates are revised as new source data arrive, and BEA also conducts annual updates.
Can I download state GDP data with Python?
Yes. The BEA Regional API can return state GDP tables, and FRED also republishes many BEA state real GDP series.
Can a state contract while U.S. GDP is positive?
Yes. State economies have different industry mixes and can move in different directions during the same quarter.
Full State GDP Growth Table
This table contains all 50 states and the District of Columbia. Growth is the annualized change from 2025 Q4 to 2026 Q1, rounded to one decimal place.
| Rank | State | Code | 2026 Q1 | Gap vs U.S. | Recent avg | Year over year | Status |
|---|---|---|---|---|---|---|---|
| 1 | Washington | WA | 4.5% | +2.4 pp | 2.7% | 2.7% | Faster than U.S. |
| 2 | California | CA | 3.7% | +1.6 pp | 3.3% | 3.3% | Faster than U.S. |
| 3 | North Carolina | NC | 3.2% | +1.1 pp | 3.4% | 3.4% | Faster than U.S. |
| 4 | South Carolina | SC | 3.2% | +1.1 pp | 2.7% | 2.7% | Faster than U.S. |
| 5 | New Mexico | NM | 3.1% | +1.0 pp | 2.9% | 2.9% | Faster than U.S. |
| 6 | Louisiana | LA | 2.9% | +0.8 pp | 2.7% | 2.7% | Faster than U.S. |
| 7 | Nevada | NV | 2.9% | +0.8 pp | 2.7% | 2.7% | Faster than U.S. |
| 8 | Alaska | AK | 2.8% | +0.7 pp | 2.1% | 2.1% | Faster than U.S. |
| 9 | Utah | UT | 2.6% | +0.5 pp | 2.7% | 2.7% | Faster than U.S. |
| 10 | Georgia | GA | 2.5% | +0.4 pp | 2.6% | 2.6% | Faster than U.S. |
| 11 | Mississippi | MS | 2.5% | +0.4 pp | 1.2% | 1.2% | Faster than U.S. |
| 12 | Alabama | AL | 2.4% | +0.3 pp | 2.1% | 2.1% | Faster than U.S. |
| 13 | Hawaii | HI | 2.4% | +0.3 pp | 1.3% | 1.3% | Faster than U.S. |
| 14 | Massachusetts | MA | 2.4% | +0.3 pp | 2.9% | 2.9% | Faster than U.S. |
| 15 | District of Columbia | DC | 2.2% | +0.1 pp | -1.2% | -1.3% | Near U.S. |
| 16 | Indiana | IN | 2.2% | +0.1 pp | 2.6% | 2.6% | Near U.S. |
| 17 | Arkansas | AR | 2.1% | +0.0 pp | 1.8% | 1.8% | Near U.S. |
| 18 | Connecticut | CT | 1.8% | -0.3 pp | 3.2% | 3.1% | Slower than U.S. |
| 19 | Kentucky | KY | 1.8% | -0.3 pp | 2.6% | 2.6% | Slower than U.S. |
| 20 | New Hampshire | NH | 1.8% | -0.3 pp | 2.7% | 2.7% | Slower than U.S. |
| 21 | Ohio | OH | 1.8% | -0.3 pp | 2.8% | 2.8% | Slower than U.S. |
| 22 | Pennsylvania | PA | 1.7% | -0.4 pp | 3.0% | 3.0% | Slower than U.S. |
| 23 | Florida | FL | 1.6% | -0.5 pp | 2.4% | 2.4% | Slower than U.S. |
| 24 | Maryland | MD | 1.5% | -0.6 pp | 0.8% | 0.8% | Slower than U.S. |
| 25 | Rhode Island | RI | 1.5% | -0.6 pp | 1.5% | 1.5% | Slower than U.S. |
| 26 | Arizona | AZ | 1.4% | -0.7 pp | 2.8% | 2.8% | Slower than U.S. |
| 27 | Colorado | CO | 1.4% | -0.7 pp | 2.7% | 2.7% | Slower than U.S. |
| 28 | West Virginia | WV | 1.4% | -0.7 pp | 2.4% | 2.3% | Slower than U.S. |
| 29 | Maine | ME | 1.3% | -0.8 pp | 1.9% | 1.9% | Slower than U.S. |
| 30 | Wyoming | WY | 1.3% | -0.8 pp | 2.3% | 2.3% | Slower than U.S. |
| 31 | Oklahoma | OK | 1.2% | -0.9 pp | 2.6% | 2.6% | Slower than U.S. |
| 32 | Tennessee | TN | 1.2% | -0.9 pp | 2.4% | 2.4% | Slower than U.S. |
| 33 | Montana | MT | 1.1% | -1.0 pp | 2.7% | 2.7% | Slower than U.S. |
| 34 | Oregon | OR | 1.1% | -1.0 pp | 2.4% | 2.4% | Slower than U.S. |
| 35 | Kansas | KS | 1.0% | -1.1 pp | 3.8% | 3.7% | Slower than U.S. |
| 36 | New York | NY | 0.9% | -1.2 pp | 2.6% | 2.5% | Slower than U.S. |
| 37 | Texas | TX | 0.9% | -1.2 pp | 3.3% | 3.3% | Slower than U.S. |
| 38 | Wisconsin | WI | 0.9% | -1.2 pp | 2.2% | 2.2% | Slower than U.S. |
| 39 | New Jersey | NJ | 0.8% | -1.3 pp | 2.0% | 2.0% | Slower than U.S. |
| 40 | Idaho | ID | 0.6% | -1.5 pp | 2.1% | 2.1% | Slower than U.S. |
| 41 | Missouri | MO | 0.6% | -1.5 pp | 2.3% | 2.2% | Slower than U.S. |
| 42 | Vermont | VT | 0.6% | -1.5 pp | 1.8% | 1.8% | Slower than U.S. |
| 43 | Illinois | IL | 0.5% | -1.6 pp | 2.7% | 2.6% | Slower than U.S. |
| 44 | Virginia | VA | 0.5% | -1.6 pp | 1.2% | 1.2% | Slower than U.S. |
| 45 | Michigan | MI | 0.4% | -1.7 pp | 2.7% | 2.6% | Slower than U.S. |
| 46 | Minnesota | MN | 0.3% | -1.8 pp | 2.1% | 2.1% | Slower than U.S. |
| 47 | North Dakota | ND | 0.1% | -2.0 pp | 2.9% | 2.9% | Slower than U.S. |
| 48 | Delaware | DE | 0.0% | -2.1 pp | 1.7% | 1.7% | No change |
| 49 | Iowa | IA | -0.1% | -2.2 pp | 2.6% | 2.6% | Contracting |
| 50 | Nebraska | NE | -0.9% | -3.0 pp | 2.6% | 2.5% | Contracting |
| 51 | South Dakota | SD | -1.6% | -3.7 pp | 3.2% | 3.2% | Contracting |
Methodology and Sources
The primary source is the U.S. Bureau of Economic Analysis. The state reference period is 2026 Q1. The national comparison uses U.S. real GDP growth of 2.1 percent for the same quarter.
State real GDP levels were cross checked through FRED series sourced from BEA. Annualized quarterly growth was calculated from the latest and prior quarter real GDP levels, then rounded to one decimal place. The recent average uses four quarterly transitions from 2025 Q2 through 2026 Q1.
District of Columbia is shown separately from the 50 states. Data were checked on August 24, 2026. The next state GDP release is scheduled for September 30, 2026.
Downloads
Files attached to this article for your reference.