
Statistics for Dissertation Research: Tests, Methods & Help
Statistics for dissertation research is the process of choosing, applying, checking, and interpreting quantitative methods that answer your research questions with defensible evidence. The right statistical test is not…
Statistics for Dissertation Research
Statistics for dissertation research is the process of choosing, applying, checking, and interpreting quantitative methods that answer your research questions with defensible evidence. The right statistical test is not determined by the software you use or by whichever method is most familiar. It follows from the research question, study design, variables, dependence structure, sample, and assumptions.
That distinction matters because a dissertation must do more than produce statistical output. You need to explain why an analysis was appropriate, what the result estimates, how uncertain it is, what limitations remain, and how another researcher could reproduce the analysis.
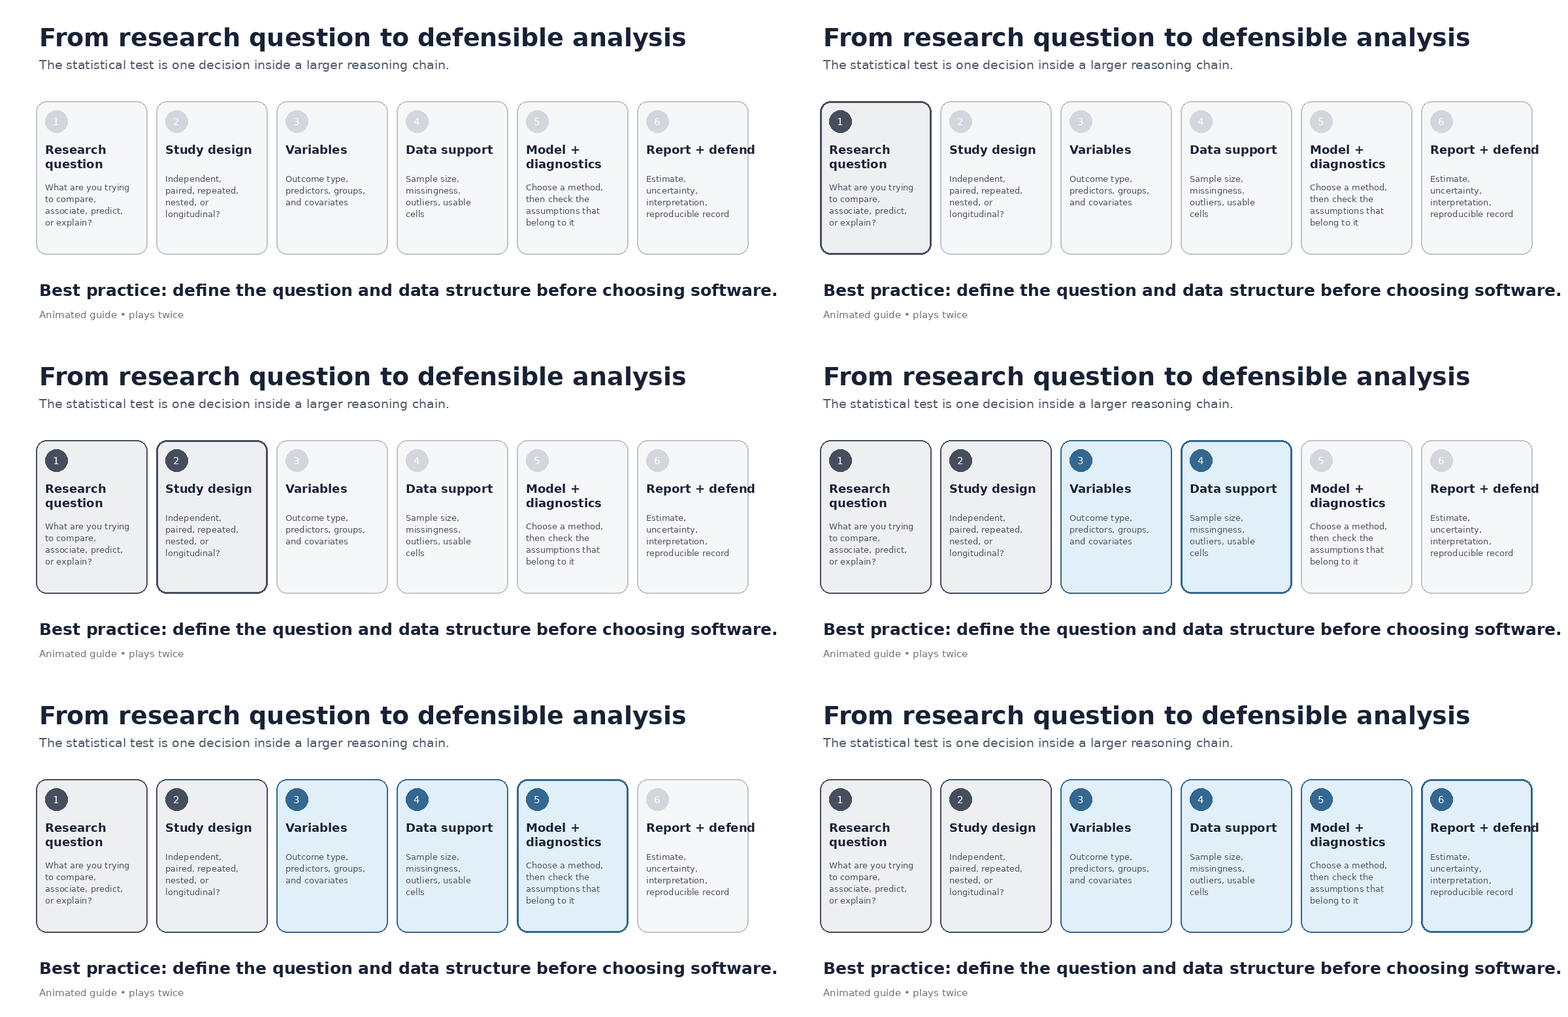
A useful decision chain is research question → study design → variable structure → data characteristics → statistical model → diagnostics → effect estimate and uncertainty → interpretation → reporting. If that chain is coherent, your dissertation statistical analysis is much easier to justify and defend.
What Is Statistics for Dissertation Research?
Dissertation statistics includes the quantitative decisions made before, during, and after data analysis. Depending on the project, it can involve sample-size planning, coding and cleaning data, descriptive statistics, hypothesis tests, regression, model diagnostics, effect sizes, confidence intervals, data visualization, and reproducible reporting.
Statistics does not belong only in Chapter 4 or the results chapter. The methodology should explain how variables are measured, how the sample was obtained, what analyses are planned, and why those analyses answer the research questions. The results section reports the findings. The discussion then interprets those findings in relation to theory, prior research, limitations, and practical implications.
Not every dissertation requires inferential statistics. A qualitative dissertation may rely on thematic, content, framework, discourse, or another qualitative analytical approach. Mixed-methods research may combine quantitative statistical analysis with qualitative analysis, but the two strands should be integrated around the research problem rather than treated as unrelated exercises.
Why Statistical Analysis Matters in a Dissertation
Statistical analysis turns observed data into structured evidence. It can quantify group differences, relationships, trends, prediction, change over time, and uncertainty. It does not automatically prove a theory, and it does not make weak study design disappear.
A common mistake is to treat the analysis as a hunt for a p-value below .05. That is too narrow. The American Statistical Association has emphasized that sound statistical inference requires attention to uncertainty, variability, multiplicity, and replicability, and that no single statistical measure answers every inferential question. [1]
For a dissertation, that means a useful result is not simply “significant” or “not significant.” A stronger interpretation asks what was estimated, how large the estimated effect is, how precise that estimate is, whether the model is credible, and what the design allows you to conclude.
Statistical choices also affect validity. If the same participants are measured repeatedly, an analysis that treats every observation as independent may understate uncertainty. If the outcome is binary, ordinary linear regression is usually not the natural starting model. If students are nested within schools, that clustering may need to be represented. The method is therefore part of the dissertation's reasoning, not merely a software setting.
What Statistics Do You Need for a Dissertation?
Descriptive statistics explain what you observed
Descriptive statistics summarize the sample before you make broader inferences. Means and standard deviations are common for roughly symmetric continuous variables. Medians and interquartile ranges can be more informative for strongly skewed variables. Counts and percentages are usually appropriate for categorical variables.
The summary should match the variable and its distribution. Reporting a mean alone for a heavily skewed variable can hide the shape of the data and make the sample harder to understand.
Inferential statistics address research questions beyond the sample
Inferential methods estimate population quantities or evaluate hypotheses using sample data. Common dissertation methods include t-tests, analysis of variance, chi-square procedures, correlation, linear regression, logistic regression, non-parametric methods, and more advanced models.
The purpose of inferential analysis is not to make the sample look impressive. It is to quantify what the data support under a stated model and its assumptions.
Correlation and regression answer different questions
Correlation summarizes association between variables. Regression models an outcome in relation to one or more predictors.
For example, a Pearson correlation can summarize the linear association between study hours and examination score. Multiple linear regression can estimate the relationship between study hours and examination score while accounting for other included predictors such as prior GPA or attendance.
Neither correlation nor regression establishes causation by itself. Causal interpretation depends on the research design, assumptions, measurement, confounding control, and other features of the study.
Reliability, factor analysis, and measurement models matter for survey research
A dissertation using multi-item scales may need to assess how those measurements behave. Reliability concerns consistency, while validity is broader and cannot be demonstrated by one coefficient.
Exploratory factor analysis is used when the latent structure is uncertain and the researcher wants to investigate plausible dimensions. Confirmatory factor analysis evaluates a prespecified measurement structure. Structural equation modeling can extend this framework to relationships among latent and observed variables.
A high Cronbach's alpha should not be described as proof that a questionnaire is valid. Reliability evidence and validity evidence answer different questions.
How to Choose the Right Statistical Test for Dissertation Research
The most useful way to choose a test is to answer six methodological questions before opening SPSS, R, Stata, or another package.
What is the research question asking?
First identify the analytical objective. Are you describing a sample, comparing groups, measuring association, predicting an outcome, modeling change, classifying observations, estimating time to an event, or evaluating a measurement structure?
This decision narrows the statistical family before software enters the discussion.
What is the outcome variable?
Determine what you are trying to explain, compare, or predict. A continuous score, yes/no outcome, ordered category, count, and time-to-event outcome require different modeling strategies.
The outcome variable often has more influence on model selection than the name of the discipline or the statistical package being used.
What predictors, groups, or covariates are involved?
Identify the independent variables, predictors, exposures, grouping variables, and covariates. Ask whether each is categorical or continuous and whether the research question requires adjustment for multiple variables.
Variable roles should follow the research design and conceptual framework, not the boxes offered by a software dialog.
How are the observations related?
Determine whether observations are independent, paired, repeated, nested, clustered, or longitudinal. This is a high-impact decision because dependence changes the uncertainty calculation and often the model itself.
A row in a spreadsheet is not automatically an independent participant. Several rows may belong to one person, classroom, hospital, company, household, or another higher-level unit.
What does the dataset actually support?
Before fitting the planned model, examine sample size, missingness, cell counts, range, variation, unusual observations, and data quality. A program may successfully return output even when the data provide weak support for a complex model.
Sample-size planning is best considered before data collection. G*Power, for example, supports power analyses for several t, F, chi-square, z, and exact-test families and can compute effect sizes, but its output is only as appropriate as the effect-size and design assumptions supplied to it. [6]
Do the assumptions of the proposed model hold sufficiently?
Assumptions belong to specific models. They should be evaluated in the context of the test, design, sample, and inferential goal rather than through one generic checklist.
Only after these questions are answered should you commit to a statistical procedure.
Which Statistical Test Should You Use?
The table below is a starting framework, not an automatic test selector. It assumes the design and other model conditions are suitable.
| Research question | Typical outcome or design | Common starting method | What to check next |
|---|---|---|---|
| Are two independent groups different? | Continuous outcome | Independent-samples t-test or Welch's t-test | Independence, influential observations, variance structure, distribution of the relevant errors |
| Did the same participants change between two occasions? | Continuous paired measurements | Paired-samples t-test | Distribution and unusual values in the within-pair differences |
| Are three or more independent groups different? | Continuous outcome | One-way ANOVA | Overall model assumptions and the need for planned contrasts or follow-up comparisons |
| Are two quantitative variables related? | Continuous variables | Pearson correlation | Linearity, outliers, range restriction, independence |
| Is there a monotonic rank association? | Ordinal or suitable quantitative variables | Spearman correlation | Whether a rank-based monotonic association answers the research question |
| Are two categorical variables associated? | Categorical variables | Chi-square test of independence | Expected cell counts and whether Fisher's exact test or modeling is more suitable |
| Does one or more predictors explain a continuous outcome? | Continuous outcome | Linear regression | Functional form, residuals, independence, constant variance, collinearity, influence |
| Does one or more predictors explain a yes/no outcome? | Binary outcome | Binary logistic regression | Sample support, separation, functional form for continuous predictors, model fit |
| Do outcomes change across repeated occasions? | Repeated or longitudinal observations | Repeated-measures or mixed-effects model | Dependence, covariance structure, missingness, time specification |
| Does a questionnaire have an underlying latent structure? | Multiple measured items | EFA or CFA | Objective, sample support, measurement level, model identification and fit |
Pearson and Spearman correlation are not interchangeable normality switches
Pearson's correlation measures linear association between quantitative variables. Spearman's correlation evaluates monotonic association through ranks and is useful for ordinal measurements and some non-linear or outlier-sensitive situations.
The shortcut “normal data equals Pearson, non-normal data equals Spearman” is incomplete. Relationship shape, measurement scale, outliers, sample size, and the inferential question matter as well.
Independent and paired t-tests solve different designs
An independent-samples t-test compares two independent groups. A paired-samples t-test analyzes linked measurements, such as pre-intervention and post-intervention scores from the same participants.
For unequal variances between independent groups, Welch's t-test is often a practical alternative to the classic equal-variance formulation rather than abandoning mean comparison entirely.
ANOVA is an overall comparison, not an automatic list of pairwise conclusions
One-way ANOVA evaluates evidence that mean outcomes differ somewhere across three or more groups. A statistically detectable overall result does not by itself identify which groups differ.
Planned contrasts or appropriately controlled follow-up comparisons should reflect the research questions rather than being generated simply because the software offers them.
Chi-square methods work with categorical frequencies
A chi-square test of independence evaluates association between categorical variables using observed and expected frequencies. Sparse contingency tables or small expected counts can make Fisher's exact test or a different model more appropriate.
Linear and logistic regression are chosen largely by the outcome
Linear regression is a common starting model for a continuous outcome. Binary logistic regression is designed for an outcome with two categories. Ordinal and multinomial logistic models extend the idea to other categorical outcome structures.
In multiple linear regression, IBM SPSS provides residual, influence, confidence-interval, model-fit, and collinearity diagnostics, including tolerance and variance inflation factors, because regression evaluation goes well beyond reading coefficients and p-values. [3]
Non-parametric methods are alternatives, not emergency replacements
Mann-Whitney U, Wilcoxon signed-rank, Kruskal-Wallis, Friedman, and related methods can be appropriate when their estimands and assumptions match the question.
But “my normality test is significant, so I must use a non-parametric test” is not a reliable universal rule. Depending on the problem, a robust method, transformation, alternative distribution, Welch-type procedure, generalized model, or mixed model may preserve the question more directly.
What Assumptions Should You Check?
Normality is not a universal gatekeeper
One of the most repeated dissertation rules is that “the data must be normally distributed.” That statement is too broad.
For classical linear modeling, the relevant assumptions concern the model's error or residual structure rather than requiring every raw predictor and outcome to pass a standalone normality test. NIST's model-validation guidance emphasizes residual examination for features such as normality, independence, constant variance, and unexplained structure. [2]
IBM's SPSS documentation similarly uses residual plots and residual diagnostics to assess model assumptions and identify unusual or influential observations. [3]
A significant Shapiro-Wilk test on a raw variable should therefore not automatically determine the entire analysis.
Independence is often more important than researchers realize
Independence comes primarily from the study design. Repeated observations from one person, students within classrooms, patients within hospitals, or employees within organizations may be correlated.
A normality test will not detect that dependence. When clustering or repeated measurement is present, a mixed-effects, multilevel, repeated-measures, generalized estimating, or another appropriate correlated-data approach may be needed.
Constant variance and linearity should be evaluated in the fitted model
For linear regression, residual-versus-fitted plots can reveal changing variance, curvature, and other systematic patterns. IBM specifically documents residual plots for evaluating normality, linearity, equality of variances, outliers, and influential cases. [3]
If a pattern remains in the residuals, the problem may be model specification rather than simply “bad data.”
Multicollinearity affects interpretation of regression coefficients
When predictors contain very similar linear information, individual regression coefficients can become unstable. Variance inflation factors, tolerance, condition indices, and examination of predictor relationships can help diagnose the issue. IBM SPSS includes these diagnostics in its regression procedures. [3]
The practical response is not always to delete one variable automatically. Theory, measurement quality, the research question, and sensitivity of the estimates should guide the decision.
Outliers should be investigated, not automatically removed
An extreme value can be a data-entry error, a genuine unusual participant, evidence of another population, or a sign that the model is poorly specified.
Removing observations because they weaken statistical significance is not a defensible rule. Check the raw record, document the reason for any exclusion, examine influence, and consider sensitivity analyses where appropriate.
Missing data requires a reasoned strategy
Listwise deletion can be simple, but it is not automatically unbiased or efficient. The consequences depend on how much data are missing, which variables are affected, why they are missing, and what assumptions the analysis makes.
Before choosing a method, describe the missing-data pattern and preserve a record of how missing values were coded and handled.
How to Analyze Dissertation Data From Plan to Results
Translate each research question into an analytical target
Create a question-to-analysis matrix before running tests. For each research question, record the outcome, predictors or groups, measurement type, dependence structure, proposed model, effect measure, assumption checks, and planned sensitivity analyses.
This is one of the highest-impact actions in dissertation data analysis because it exposes mismatches before they become results-chapter problems.
Preserve raw data and build a documented analysis copy
Keep an untouched version of the original dataset. Perform recoding, exclusions, scale scoring, transformations, and missing-value handling in a separate analysis copy or through reproducible syntax.
Simple coding errors can have large consequences. If “99” means missing but is analyzed as a genuine questionnaire score, descriptive and inferential results can both become misleading.
Screen the dataset before testing hypotheses
Inspect ranges, frequencies, distributions, missingness, duplicate cases, impossible values, and plots. Descriptive analysis is not filler. It is the first quality-control stage of the statistical workflow.
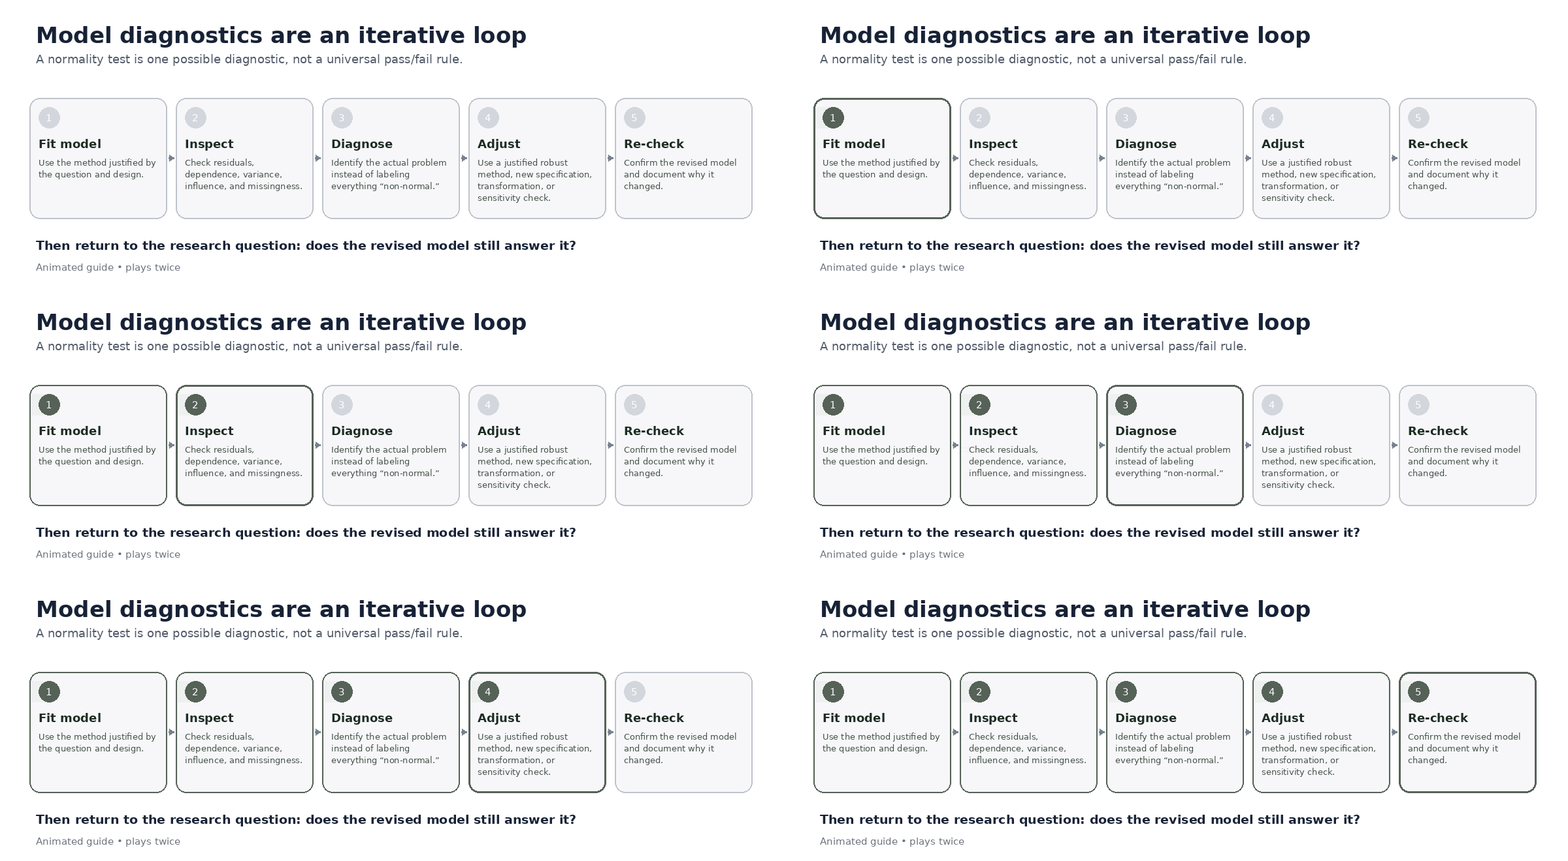
Run diagnostics that belong to the proposed model
Avoid applying an identical assumption checklist to every statistical test. Examine the diagnostics that are relevant to the actual model and interpret them in context.
Where the initial model is inadequate, document why you changed it. A transparent change is more defensible than silently trying alternatives until one produces a preferred result.
Report effect estimates and uncertainty
A p-value alone does not tell the reader how large an effect is. Report an appropriate effect estimate and, where available, a confidence interval or another measure of uncertainty.
The ASA's guidance explicitly emphasizes capturing uncertainty and recognizing that different statistical summaries answer different questions. [1]
Make the workflow reproducible
Save SPSS syntax, R scripts, Stata do-files, SAS programs, Python notebooks, or equivalent records. Document variable recodes, exclusions, transformations, model specifications, software versions, and material deviations from the planned analysis.
Reproducibility becomes especially valuable when a supervisor asks for a revised model, a sensitivity analysis, or a publication-ready version of the dissertation results.
Which Statistical Software Is Best for Dissertation Research?
There is no universal best statistical package. Choose software after you know which analyses are required.
SPSS is practical for menu-driven workflows with reproducible syntax
SPSS supports many common dissertation analyses and provides regression diagnostics, confidence intervals, model-fit statistics, residual information, influence measures, and collinearity diagnostics. [3]
Its graphical interface can reduce the initial learning burden, especially in programs where supervisors and peers already use SPSS. For reproducibility, save syntax instead of relying entirely on undocumented menu clicks.
R offers flexibility and reproducible code
The R Project describes R as a free software environment for statistical computing and graphics, with facilities for data analysis, modeling, and graphical display. [4]
R is particularly strong when the dissertation needs reproducible code, extensible packages, specialized models, or custom graphics. The practical trade-off is a steeper learning curve for students who have never programmed.
Stata is strong for many longitudinal, panel, epidemiological, and survival workflows
Stata provides tools for regression, panel and multilevel analysis, and survival analysis. Its survival-analysis documentation covers censoring, delayed entry, time-varying covariates, Cox models, parametric survival models, frailty models, and related methods. [5]
That does not make Stata universally better. It makes it a strong fit when the required methods and local research workflow align with its strengths.
SAS can be appropriate where the research environment already depends on it
SAS remains relevant in institutional, large-data, and regulated environments. For an individual student, however, the cost and learning curve may not be justified if a supported alternative already handles the required analyses.
JASP and jamovi can reduce the coding burden
Graphical tools such as JASP and jamovi can make common analyses accessible without requiring extensive programming. Their suitability depends on whether they support the exact model, diagnostics, output, and reproducibility required by the dissertation.
Ease of use should not be confused with methodological adequacy.
AMOS, Mplus, and lavaan are relevant to latent-variable modeling
Confirmatory factor analysis and structural equation modeling may be performed in specialized tools such as AMOS or Mplus or through packages such as lavaan in R.
Choose the environment based on the required model, methodological support available to you, licensing, reproducibility, and disciplinary conventions.
Python is useful when statistics sits inside a broader coded workflow
Python can support data preparation, statistical modeling, automation, visualization, and reproducible notebooks. It is especially useful when the dissertation already involves programming or when analysis must integrate with larger data-processing workflows.
Choose software in the right order
For most dissertation researchers, the practical order is required method → university or supervisor constraints → reproducibility → available support → learning curve → cost.
Software executes the method. It does not decide which method answers the research question.
When Advanced Statistics Are Actually Necessary
Advanced models should solve design or measurement problems that simpler methods cannot solve adequately.
Mixed-effects and multilevel models
These models are useful when observations are grouped or repeated, such as time points within participants or students within schools. Random effects can represent variation associated with those grouping structures.
A mixed model is not automatically superior to repeated-measures ANOVA. It becomes attractive when the design, covariance structure, missing observations, unequal measurement schedules, or hierarchy justify the flexibility.
Repeated-measures ANOVA
Repeated-measures ANOVA can be appropriate for relatively simple repeated designs. Its assumptions and data requirements should be considered explicitly, especially as the number of occasions and complexity increase.
Exploratory and confirmatory factor analysis
EFA explores possible latent structure. CFA tests a specified measurement structure. They should not be treated as interchangeable stages that automatically validate a questionnaire.
Structural equation modeling
SEM is useful when the theory requires relationships among latent constructs or multiple simultaneous pathways. A complicated SEM is not better than a well-specified regression merely because it looks more advanced.
Mediation and moderation
Mediation concerns an hypothesized pathway through which variables may be related. Moderation concerns whether a relationship varies depending on another variable.
Statistical mediation alone does not establish a causal mechanism. Causal interpretation still depends on design and assumptions.
Survival analysis
Survival analysis models time to an event while addressing issues such as censoring. The event may be death, relapse, recovery, employee turnover, equipment failure, or another defined event whose timing matters. Stata's official documentation describes these time-to-event and censoring features directly. [5]
Ordinal and multinomial logistic regression
Ordinal logistic regression is relevant when outcome categories have a meaningful order. Multinomial logistic regression applies when a categorical outcome has more than two unordered categories.
The outcome structure should determine the model family, not a desire to use a more sophisticated technique.
Common Dissertation Statistics Mistakes and How to Avoid Them
Choosing the analysis after seeing which result is significant
Trying multiple analyses and presenting only the preferred one can distort evidence. When a change from the original analysis plan is necessary, explain why it was made and distinguish confirmatory from exploratory work.
Treating Likert data as one universal statistical problem
There is no single “Likert-scale statistical test.” An individual ordinal item, a multi-item composite score, a predictor, an outcome, and a latent factor are different analytical objects.
The appropriate method depends on what is being measured and what the research question asks.
Using a normality test as the only diagnostic
Model assumptions cannot usually be reduced to one p-value from a normality test. Independence, functional form, variance structure, influential observations, and the particular error distribution required by the model may matter more.
Reporting significance without magnitude
Statistical significance is not the same as practical, clinical, educational, or theoretical importance. Report an effect estimate and uncertainty so the reader can judge the size and precision of the finding.
Running many tests without considering multiplicity
The more hypotheses examined, the more opportunities there are for chance findings. The appropriate response depends on whether analyses were planned, exploratory, hierarchical, or part of a broader model, but multiplicity should not be ignored.
Reporting software output instead of research findings
A dissertation should not read like an exported SPSS viewer. Report the statistics needed to answer each research question and explain their meaning.
Treating non-significance as proof of no effect
Failure to detect a statistically significant effect is not automatically evidence that two groups are identical or that a relationship is exactly zero.
The estimate, confidence interval, sample size, measurement quality, model, and study design determine what the data can reasonably rule out.
Failing to preserve syntax or analytical decisions
A result that cannot be reconstructed becomes difficult to audit, revise, or defend. Keep the code, syntax, data-cleaning record, and model decisions with the project.
How Should Dissertation Statistical Results Be Reported?
Organize results around research questions, not software menus
Readers should be able to move from a research question or hypothesis to the analysis that answers it. This is usually clearer than structuring the results chapter as “SPSS procedure 1, SPSS procedure 2, SPSS procedure 3.”
Report the information needed to interpret the result
Depending on the method, useful reporting may include sample sizes, descriptive summaries, parameter estimates, standard errors, confidence intervals, test statistics, degrees of freedom, p-values, effect sizes, model-fit measures, and relevant diagnostics.
Do not include a number merely because the software printed it.
Distinguish p-values, effect estimates, and confidence intervals
These quantities serve different purposes. An effect estimate communicates magnitude. A confidence interval communicates uncertainty under the model. A p-value summarizes compatibility of the observed data with a specified null model under its assumptions.
A clear dissertation reports them as complementary information rather than interchangeable proof.
Use tables and figures to answer questions efficiently
Tables should use descriptive titles, clear labels, consistent precision, and units where relevant. Figures are particularly useful for interactions, trajectories, distributions, predicted probabilities, and patterns that are difficult to understand from a table alone.
Use reporting guidance that matches the study type
SAMPL provides guidance focused on reporting statistical methods and analyses in biomedical articles. [7] STROBE provides reporting guidance for cohort, case-control, and cross-sectional observational studies and explicitly states that it is not a prescription for designing or conducting those studies. [8] CONSORT 2025 is the updated reporting guideline for randomized trials. [9] PRISMA 2020 provides the statement, checklists, and flow diagrams for systematic-review reporting. [10]
These guidelines are not interchangeable. Use the one that matches the study design, discipline, journal, and university requirements.
When Should You Hire a Dissertation Statistician?
Not every dissertation needs a statistical consultant. Straightforward quantitative analyses can often be completed independently when the researcher understands the design, variables, assumptions, software, and interpretation.
Professional statistical guidance becomes more useful when the difficult part is no longer operating software but making methodological decisions that materially affect validity.
Seek help early when the design or sample-size plan is uncertain
Some statistical problems are best solved before data collection. Measurement choices, number of groups, repeated measurements, clustering, anticipated effect size, and sample size can constrain what the eventual study can support.
A consultation during proposal development can therefore be more valuable than trying to repair a design after the dataset is complete.
Complex data structures justify specialist input more often than complex software does
Longitudinal data, multilevel sampling, substantial missingness, survival outcomes, latent-variable models, complex surveys, and advanced causal or multivariate methods may justify specialist support when the student or supervisory team lacks the relevant methodological expertise.
The key question is not “Is this analysis advanced?” It is “Can I explain why this model is appropriate and defend the assumptions and interpretation?”
Statistical support should preserve academic responsibility
A statistician can help plan analyses, inspect data quality, select or review models, create reproducible code, and explain results. They should not fabricate data, conceal analytical decisions, invent findings, or provide a student with work they cannot understand well enough to defend.
University policies on external assistance, disclosure, authorship, confidentiality, and submitted work vary by institution and country. Check the rules that apply to your program before sharing data or commissioning analysis.
How to Evaluate Dissertation Statistics Help Before Hiring
A stronger evaluation question than “Can you run SPSS?” is “Can you provide an analysis whose decisions I can understand, reproduce, and defend?”
Check methodological fit, not just credentials
The consultant's training should be relevant to the actual research design and model. Experience with routine survey regression does not automatically demonstrate expertise in multilevel survival analysis, complex sampling, or structural equation modeling.
Require a rationale for test selection
The deliverable should connect the research question, variables, study design, and assumptions to the method. A bare statement that “ANOVA was appropriate” is weaker than a documented reason.
Ask how assumptions and diagnostics will be handled
Clarify which diagnostics are included, what happens if the original analysis plan is not supported, and whether sensitivity analyses are part of the scope.
Request reproducible analysis files
Where possible, obtain the SPSS syntax, R script, Stata do-file, SAS code, Python notebook, or equivalent analytical record used to produce the results.
A software output file or screenshots alone provide much less value during revisions and defense preparation.
Clarify the actual deliverables
Raw output, a cleaned dataset, formatted tables, figures, a written results section, methodology text, consultation meetings, and revision support are different services. Ask for a written scope so the price can be compared with an actual deliverable.
Check confidentiality and data-handling requirements
Research datasets may contain personal, confidential, commercially sensitive, or otherwise restricted information. Confirm how files will be transferred, accessed, stored, retained, and deleted, and make sure the arrangement is compatible with the study's ethics approval and institutional requirements.
Avoid guarantees of approval or statistical significance
No credible analysis can guarantee dissertation approval, successful defense, publication, or a particular p-value. Methodological support can improve the quality and transparency of the work, but it cannot control academic outcomes.
What Does Dissertation Statistics Help Cost?
There is no reliable universal price for dissertation statistics help. Pricing varies with the dataset, number of research questions, model complexity, software, reporting scope, meetings, turnaround, and revision requirements, as well as the consultant's market and location.
A single prespecified analysis on a clean dataset is a different project from cleaning raw data, validating measures, creating an analysis plan, fitting multiple models, producing publication-ready tables, writing results, and responding to committee revisions.
The condition of the dataset can also affect cost. A clear codebook, documented variable definitions, clean data, final research questions, and known institutional requirements reduce ambiguity and make quotations more comparable.
Fixed-fee and hourly arrangements can both be reasonable. For a fixed fee, confirm what constitutes a revision and what falls outside scope. For hourly work, clarify how time and cost will be reported. In either case, compare the complete deliverable rather than the headline price.
FAQs
What statistical test should I use for my dissertation?
Choose the method from the research question, outcome type, predictors or groups, study design, dependence between observations, sample support, and the assumptions of the proposed model. Software should come after those decisions.
Do all dissertations need statistical analysis?
No. Quantitative dissertations generally require statistical analysis. Qualitative dissertations use qualitative analytical methods. Mixed-methods dissertations may require both.
How many statistical tests should a dissertation include?
There is no correct number. Use the analyses required to answer the research questions. Adding more tests does not make a dissertation stronger and can create multiplicity and interpretation problems.
Can I use SPSS for my entire dissertation analysis?
Possibly. SPSS supports many common analyses and regression diagnostics. [3] Whether it is sufficient depends on the exact models, institutional expectations, and reproducibility needs of the project.
Is R better than SPSS for dissertation research?
Neither is universally better. R is free, code-based, extensible, and well suited to reproducible analysis. [4] SPSS provides a graphical workflow that may be easier to enter for researchers working in an SPSS-based program. Choose according to required methods and the research environment.
Do I need to test my data for normality?
Sometimes normality matters, but asking whether every raw variable passes a normality test is often the wrong question. For classical linear models, diagnostics commonly focus on the residuals together with independence, constant variance, functional form, and influence. [2] [3]
What should I do if my data are not normally distributed?
First determine which assumption matters for the proposed method and why. Then examine plots, residuals, outliers, sample structure, and model specification. A robust procedure, transformation, alternative distribution, Welch-type method, non-parametric method, or different model may be appropriate depending on the research question.
Should I report effect sizes as well as p-values?
In most inferential settings, reporting magnitude and uncertainty makes the result more informative than a p-value alone. The ASA's guidance emphasizes uncertainty and warns against reducing inference to a single threshold. [1]
Can a statistician analyze my dissertation data?
Statistical consultants can provide legitimate methodological support, but the acceptable scope varies by university and program. Follow your institution's rules, understand the analysis you submit, and disclose external assistance when required.
When should I contact a dissertation statistician?
Before data collection is ideal when the design, sample size, measurement plan, or proposed analysis is uncertain. After data collection, seek help when model selection, missing data, dependence, diagnostics, or advanced methods exceed your current expertise.
What should I prepare before asking for statistical help?
Prepare the final research questions or hypotheses, methodology, variable definitions, codebook, dataset, measurement instruments where relevant, institutional requirements, proposed analysis, and any supervisor comments. Keep an untouched copy of the raw data.
Statistics for Dissertation Research: The Decision That Matters Most
The central decision in statistics for dissertation research is not which button to press in SPSS, R, Stata, SAS, JASP, or Python. It is whether the proposed analysis genuinely answers the research question with the design and data you have.
Start with the question, identify the outcome and predictors, determine how observations are related, assess what the sample supports, and then evaluate the assumptions of the model you intend to use. Report effect estimates and uncertainty rather than treating statistical significance as the whole result, and preserve enough code and documentation for the workflow to be reproduced.
For straightforward designs, that process may be manageable without outside help. For longitudinal, clustered, substantially incomplete, latent-variable, survival, or otherwise complex data, statistical consultation can be a sensible next step when methodological decisions exceed your current training.
The standard to aim for is not an analysis that merely runs. It is an analysis you can justify, reproduce, interpret, and defend.
Sources and Further Reading
[1] American Statistical Association. ASA President’s Task Force Statement on Statistical Significance and Replicability
[2] NIST/SEMATECH. e-Handbook: Residual Analysis and Model Validation
[3] IBM. SPSS Statistics: Linear Regression Statistics and Diagnostics
[4] R Project. The R Project for Statistical Computing
[5] StataCorp. Stata Survival Analysis Capabilities
[6] Heinrich Heine University Düsseldorf. G*Power: Statistical Power Analyses for Mac and Windows
[7] EQUATOR Network. SAMPL Guidelines for Basic Statistical Reporting
[8] STROBE Initiative. Strengthening the Reporting of Observational Studies in Epidemiology
[9] EQUATOR Network. CONSORT 2025 Statement for Reporting Randomised Trials
[10] PRISMA. PRISMA 2020 Statement