
Two-Way ANOVA Calculator & Guide
A two-way ANOVA tests whether two categorical factors are associated with differences in one quantitative outcome, and whether the effect of one factor depends on the level of the other. A two-way ANOVA calculator can…
A two-way ANOVA tests whether two categorical factors are associated with differences in one quantitative outcome, and whether the effect of one factor depends on the level of the other. A two-way ANOVA calculator can produce the F statistics and p-values quickly, but the result is only useful when the design, replication, and assumptions match the model.
For most users, the real task is not simply “get three p-values.” It is to confirm the correct ANOVA, calculate the main effects and interaction, interpret the pattern, decide whether follow-up comparisons are needed, and report the result without overstating what the data show.
Two-Way ANOVA Calculator
For a standard balanced fixed-effects analysis, enter the raw observations for each combination of Factor A and Factor B. The web version of this guide includes a working balanced 2 × 2 calculator. It expects the same number of independent observations in all four cells and at least two observations per cell.
| Quick design check: Use the standard calculator only when the outcome is quantitative, both predictors are categorical, observations are independent, each Factor A × Factor B cell contains independent replications, and the calculator’s balanced-design requirement matches your data. If the same subject is measured repeatedly, or cell sizes are unequal, use a model designed for that structure. |
|---|
| Design question | What it means for the analysis |
|---|---|
| One quantitative outcome? | Ordinary ANOVA models a continuous response such as yield, score, pressure, or time. |
| Two categorical factors? | Factor A and Factor B consist of discrete levels or groups. |
| Independent observations? | Different experimental units should provide the independent replications in each cell. |
| Repeated measurements? | If the same unit contributes multiple observations, use a repeated-measures or mixed-effects approach rather than treating those values as independent. |
| Equal cell sizes? | A simple balanced calculator assumes the same number of observations in every A × B cell. |
| At least two observations per cell? | Replication is needed to estimate within-cell error separately from interaction in the conventional full factorial model. |
How to enter the data
Suppose Factor A has levels A1 and A2, Factor B has levels B1 and B2, and the outcome is a test score. Put every independent score from the same factor combination in the same cell. Raw observations preserve the within-cell variation that ANOVA needs to estimate error.
| B1 | B2 | |
|---|---|---|
| A1 | 8, 9, 7, 10 | 12, 11, 13, 12 |
| A2 | 10, 11, 9, 10 | 16, 15, 17, 14 |
A long-format dataset expresses the same structure with one row per observation: Factor A, Factor B, and Outcome. Statistical packages such as R and general linear-model software typically work naturally with this format.
What Is a Two-Way ANOVA?
Two-way ANOVA, also called two-factor ANOVA, is a factorial analysis of variance. A factorial design contains combinations of factor levels, so the model can estimate both main effects and the interaction within one analysis. NIST describes the fixed-effects two-factor model as an overall mean plus an effect for Factor A, an effect for Factor B, an A × B interaction, and residual error. ()
Yᵢⱼₖ = μ + αᵢ + βⱼ + (αβ)ᵢⱼ + εᵢⱼₖ
Main effects
The Factor A main effect compares the marginal means of A after averaging across Factor B. The Factor B main effect does the same after averaging across Factor A. These averages are useful summaries only when they answer the scientific question and do not conceal an important interaction.
Interaction effect
The A × B interaction asks whether the effect of one factor changes across levels of the other. For example, a treatment could outperform a control in one population but show little advantage in another. The interaction is therefore a statement about conditional effects, not simply whether two lines happen to cross on a graph.
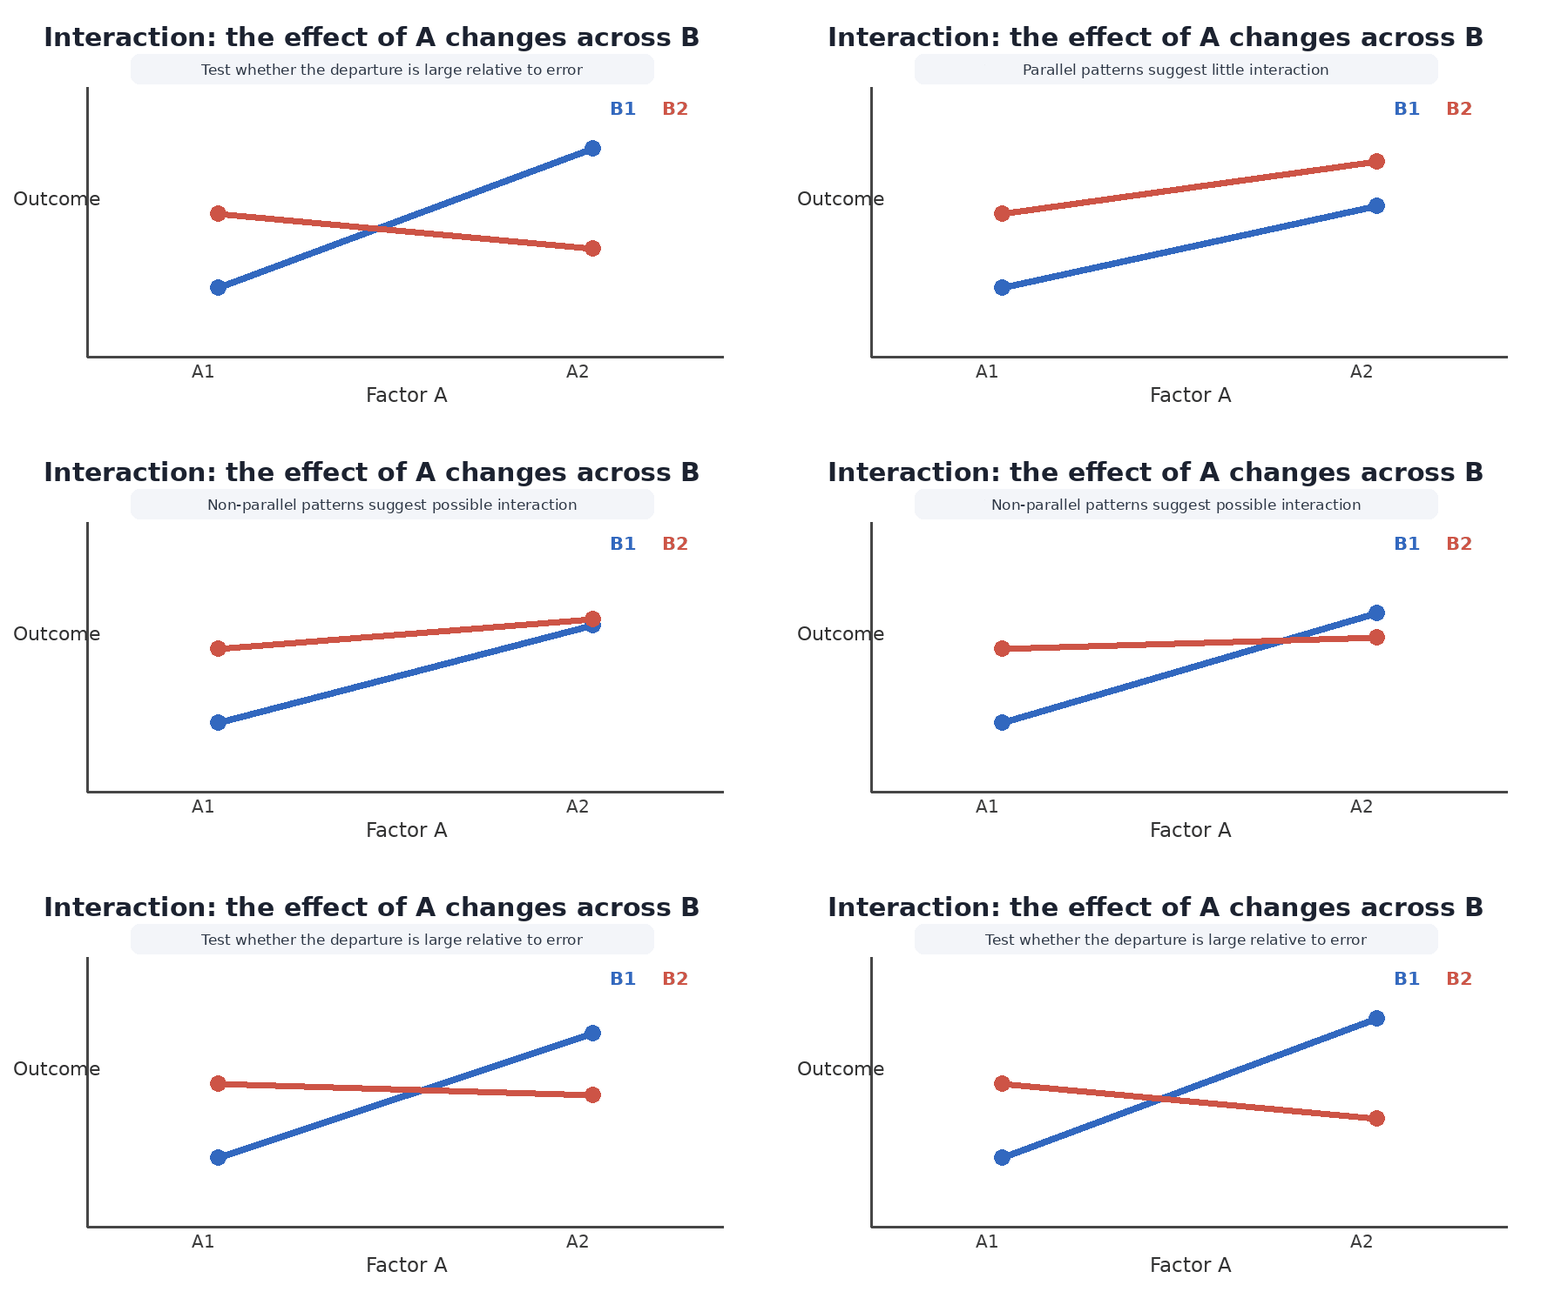
Interaction plots are descriptive. The ANOVA interaction test asks whether the observed non-parallel pattern is large relative to residual variation.
When Should You Use a Two-Way ANOVA?
Use an ordinary two-way ANOVA when one continuous outcome is measured across combinations of two categorical factors and the observations are independent. The exact model also depends on whether the factor levels are fixed or random, whether observations are repeated, whether cells are balanced, and whether there is replication.
Replication versus repeated measures
Replication means that different independent experimental units are observed under the same factor combination. Repeated measures means that the same unit contributes values under multiple conditions or time points. These designs create different error structures and are not interchangeable. GraphPad’s documentation explicitly notes that repeated-measures or mixed-effects analyses account for correlation among multiple responses from the same subject. ()
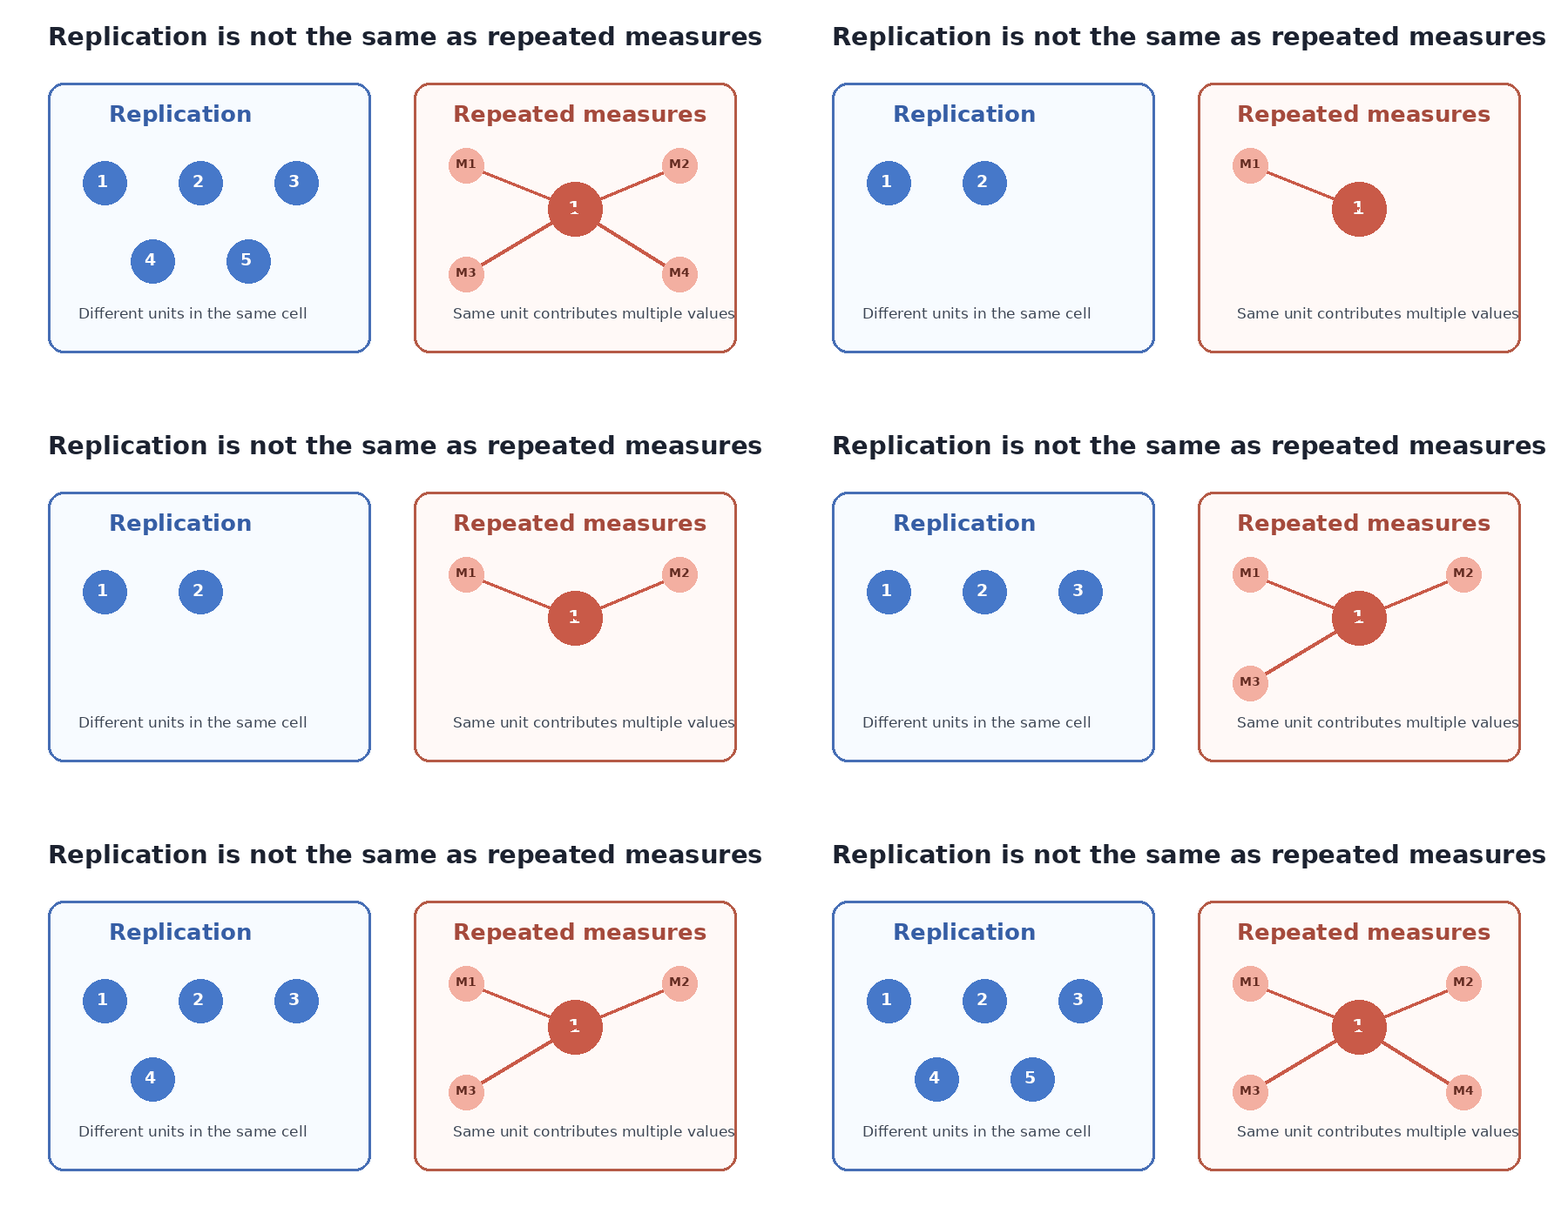
Independent replications estimate within-cell variation. Repeated measurements from the same unit must be modeled as correlated observations.
Balanced versus unbalanced designs
A balanced design has the same number of observations in every cell. The classic sums-of-squares decomposition is especially simple in that case. Unbalanced data are not automatically invalid, but the model specification and sums-of-squares convention become more important. R’s aov documentation covers both balanced and unbalanced experimental designs, while MATLAB’s anova2 is structured around replicated row-by-column layouts. (); ()
Two-way ANOVA without replication
“Without replication” needs careful interpretation. If there is exactly one observation in each A × B cell, a conventional full factorial model cannot separately estimate interaction and residual error. MATLAB therefore returns an interaction p-value only when the number of replications is greater than one. Microsoft Excel still provides a tool named ANOVA: Two-Factor Without Replication for one observation per factor pair, but that procedure should not be mistaken for a replicated interaction test. (); ()
| High-impact warning: One value per cell is not simply a normal two-way ANOVA with a smaller sample. Without replication, interaction and within-cell error are confounded unless additional assumptions are imposed. |
|---|
Two-Way ANOVA Assumptions
The most useful assumption checks focus on the experimental design and model residuals. NIST states the classical expectation as residuals that are approximately normal and independent, with mean zero and constant variance, and recommends graphical residual checks. ()
Independence
Independence is mainly a design issue. Ten measurements from one patient, classroom, plant, batch, or machine are not automatically ten independent experimental units. If observations are clustered or repeated, use a model that represents that dependence.
Normality of residuals
The relevant normality assumption concerns the unexplained errors, not simply whether all raw outcome values pooled together form a bell-shaped histogram. A residual Q-Q plot or normal probability plot is more directly connected to the ANOVA model.
Homogeneity of variance
The standard fixed-effects model assumes roughly constant residual variance across factor combinations. Cell-level spreads and a residual-versus-fitted plot can reveal strong heteroscedasticity. Formal variance tests can supplement these diagnostics but should not replace them.
What if assumptions fail?
The remedy depends on the failure. Repeated observations call for repeated-measures or mixed models. Strongly unequal variances may require variance-aware or robust methods. Count, binary, or heavily bounded outcomes may be better handled by a generalized linear model. Transformations can sometimes help, but the goal is to choose a model that reflects how the data were generated rather than to make an assumption test pass.
How to Calculate a Two-Way ANOVA
For a balanced fixed-effects design with a levels of Factor A, b levels of Factor B, and r independent observations in every cell, total variation is partitioned into Factor A, Factor B, interaction, and residual error. NIST gives this standard balanced decomposition. ()
SS Total = SS A + SS B + SS A×B + SS Error
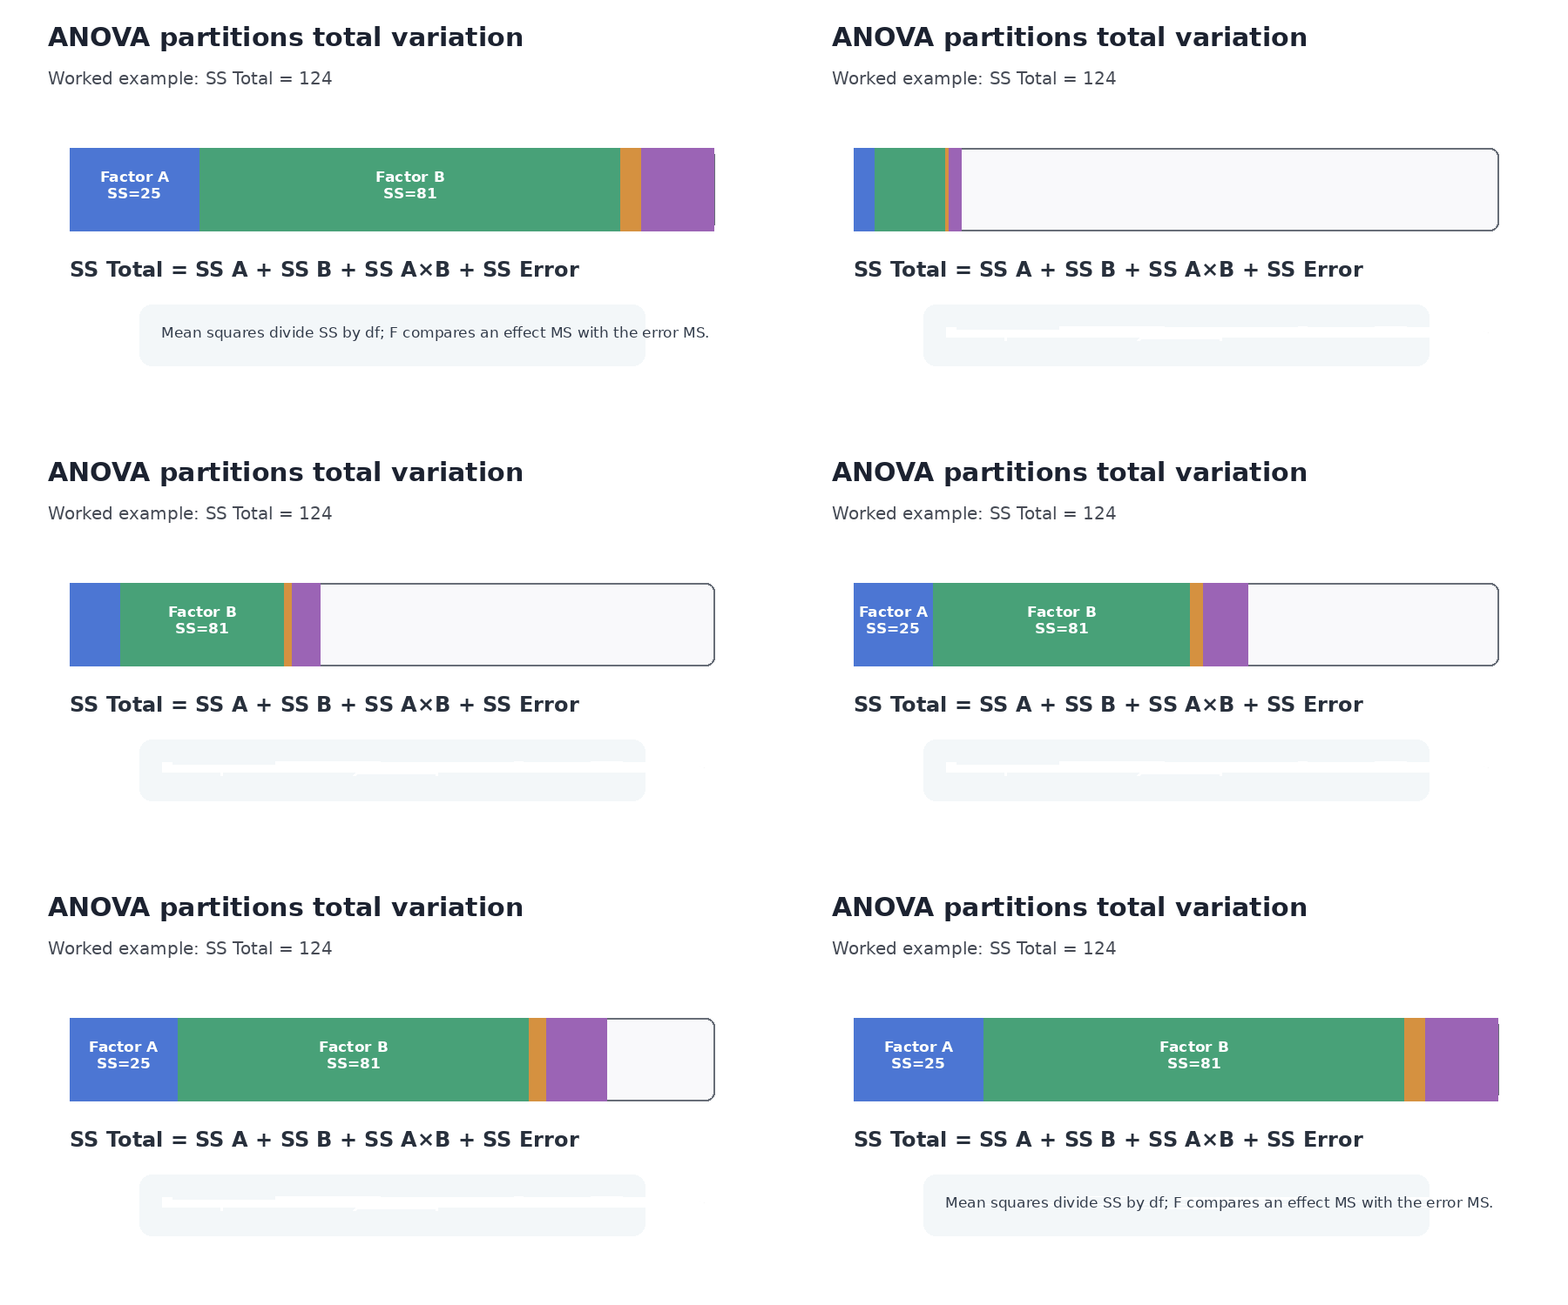
ANOVA separates total variability into variation associated with Factor A, Factor B, their interaction, and unexplained within-cell error.
Core formulas for a balanced fixed-effects design
SS A = br Σᵢ(Ȳᵢ.. − Ȳ...)²
SS B = ar Σⱼ(Ȳ.ⱼ. − Ȳ...)²
SS A×B = r ΣᵢΣⱼ(Ȳᵢⱼ. − Ȳᵢ.. − Ȳ.ⱼ. + Ȳ...)²
SS Error = ΣᵢΣⱼΣₖ(Yᵢⱼₖ − Ȳᵢⱼ.)²
Degrees of freedom are dfA = a − 1, dfB = b − 1, dfA×B = (a − 1)(b − 1), and dfError = ab(r − 1). Each mean square is SS divided by its degrees of freedom. In the conventional balanced fixed-effects model, each effect F statistic is its mean square divided by the error mean square.
F A = MS A / MS Error | F B = MS B / MS Error | F A×B = MS A×B / MS Error
These F denominators are not universal for every random-effects, mixed-effects, or repeated-measures ANOVA. The model determines the appropriate error term.
How to Read a Two-Way ANOVA Table
| Source | What it represents | Typical df | F test |
|---|---|---|---|
| Factor A | Differences among Factor A marginal means | a − 1 | MS A / MS Error |
| Factor B | Differences among Factor B marginal means | b − 1 | MS B / MS Error |
| A × B | Departure from an additive main-effects pattern | (a − 1)(b − 1) | MS A×B / MS Error |
| Error | Unexplained within-cell variation | ab(r − 1) | — |
| Total | All variation around the grand mean | abr − 1 | — |
The p-value is the right-tail probability associated with the observed F statistic under the corresponding null hypothesis. It is not the probability that the null hypothesis is true. A result should therefore be read together with the source row, effect estimate, degrees of freedom, design, and uncertainty.
How to Interpret Two-Way ANOVA Results
Examine the interaction first
Interaction is the natural starting point because it tells you whether the effect of one factor is reasonably summarized by a single average across the other factor. If the interaction is substantial, inspect the cell means and the scientific comparisons that matter within levels of the other factor.
If the interaction is significant
A significant interaction is evidence that the effect of Factor A changes across Factor B, or equivalently that the effect of Factor B changes across Factor A. This usually shifts attention toward simple effects, planned contrasts, or selected pairwise comparisons rather than treating the marginal main effects as uniform effects in every condition.
If the interaction is not significant
A non-significant interaction does not prove that the interaction is exactly zero. It means the analysis did not detect sufficient evidence against the no-interaction hypothesis at the chosen significance level. The interaction estimate, confidence interval, plot, residual variation, and sample size still matter.
Do not treat “ignore the main effects” as an absolute rule
The common instruction to ignore main effects whenever an interaction is significant is a useful warning but can be too rigid. Main effects still represent averages across the other factor. The problem is interpretive: those averages can be misleading if the conditional effects differ sharply. Report a marginal effect only when that average answers a meaningful question, and explain it alongside the interaction.
Statistical significance versus effect size
A p-value describes evidence against a null model; it does not directly measure practical importance. One common factorial-ANOVA effect size is partial eta squared: ηp² = SS effect / (SS effect + SS Error). Lakens recommends reporting effect sizes and cautions against interpreting them only through generic small/medium/large labels without research context. ()
Worked Two-Way ANOVA Example
Using the four cells entered earlier, there are four independent observations per cell and 16 observations in total.
| B1 | B2 | A marginal mean | |
|---|---|---|---|
| A1 | 8.50 | 12.00 | 10.25 |
| A2 | 10.00 | 15.50 | 12.75 |
| B marginal mean | 9.25 | 13.75 | Grand mean = 11.50 |
The Factor A marginal means differ by 2.50 units and the Factor B marginal means by 4.50 units. The A1-to-A2 change is 1.50 units at B1 and 3.50 units at B2, so the cell pattern is not perfectly additive. The interaction test determines whether that departure is large relative to the within-cell error.
| Source | SS | df | MS | F | p |
|---|---|---|---|---|---|
| Factor A | 25.000 | 1 | 25.000 | 21.429 | 0.000581 |
| Factor B | 81.000 | 1 | 81.000 | 69.429 | 0.00000247 |
| A × B | 4.000 | 1 | 4.000 | 3.429 | 0.08883 |
| Error | 14.000 | 12 | 1.167 | ||
| Total | 124.000 | 15 |
At α = .05, both main effects are statistically significant, while the interaction is not: F(1, 12) = 3.43, p = .089. The correct wording is not “there is no interaction,” but “the analysis did not detect a statistically significant interaction at the .05 level.”
For this example, partial η² is about .64 for Factor A, .85 for Factor B, and .22 for the interaction. The relatively large interaction estimate alongside p = .089 illustrates why effect magnitude and uncertainty should be considered together, especially with small samples. This is a calculation demonstration, not evidence that four observations per cell are generally adequate for research.
Example reporting language
A two-way ANOVA found a significant main effect of Factor A, F(1, 12) = 21.43, p < .001, ηp² = .64, and a significant main effect of Factor B, F(1, 12) = 69.43, p < .001, ηp² = .85. The Factor A × Factor B interaction was not statistically significant, F(1, 12) = 3.43, p = .089, ηp² = .22.
What to Do After a Significant Result
A significant omnibus effect does not automatically identify which means differ. The follow-up analysis should match the hypothesis rather than defaulting to the largest possible set of pairwise comparisons.
When a main effect has more than two levels
If a significant factor has three or more levels, post-hoc or planned comparisons may be needed. Tukey-style procedures are useful when the goal is to examine a family of pairwise mean comparisons while controlling the familywise error rate.
When the interaction is significant
Simple effects are often more informative than a blanket post-hoc routine. For example, compare treatments separately within each population, or compare temperatures separately within each manufacturing process. Decide which conditional comparisons answer the scientific question, then control multiplicity for that comparison family.
Two-Way ANOVA vs Other Statistical Tests
| Method | Use it when |
|---|---|
| One-way ANOVA | One categorical factor and one quantitative outcome. |
| Ordinary two-way ANOVA | Two categorical factors, one quantitative outcome, and independent observations. |
| Repeated-measures or mixed ANOVA | The same units contribute repeated or matched observations. |
| ANCOVA | Categorical factors are modeled together with a relevant continuous covariate. |
| MANOVA | Several dependent variables are analyzed jointly. |
| General linear model / regression | You need flexible coding, covariates, interactions, or unbalanced designs. |
| Generalized linear model | The outcome distribution is not appropriately modeled as continuous Gaussian data. |
| Mixed-effects model | Observations are clustered, hierarchical, repeated, or involve random effects that need explicit modeling. |
Two-way ANOVA is itself a special case of the general linear model. That connection explains why more general statistical software can handle designs that a simple calculator should reject rather than forcing into balanced formulas.
Common Two-Way ANOVA Mistakes
| Mistake | Why it causes trouble |
|---|---|
| Treating repeated measurements as independent | The analysis ignores within-subject or within-unit correlation. |
| Using one observation per cell and reporting an interaction test | Interaction cannot be separated from residual error in the conventional full model. |
| Using a balanced calculator for unequal cell sizes | The simple formulas may no longer represent the intended model. |
| Checking only the pooled raw-data distribution | ANOVA assumptions concern model residuals and the data-collection design. |
| Reading p ≥ .05 as proof of no effect | Failure to reject is not evidence that the true effect is exactly zero. |
| Assuming non-parallel lines automatically prove interaction | An interaction plot is descriptive; the test compares the pattern with residual variation. |
| Automatically running Tukey after every significant row | The correct follow-up depends on the hypothesis and comparison family. |
| Reporting only p-values | Effect estimates, descriptive statistics, and uncertainty are needed to understand magnitude. |
How to Report a Two-Way ANOVA
A useful report identifies the outcome and factors, states the design, summarizes the cell or marginal means relevant to the question, and reports F statistics with numerator and denominator degrees of freedom, p-values, and an effect-size measure when appropriate. If interaction is important, report the conditional comparisons or simple effects that explain it. Also describe material assumption checks and any departures from the standard model.
For reproducibility, researchers may verify results in R, Python, SPSS, GraphPad Prism, MATLAB, SAS, Minitab, or another statistical package. The software name is less important than specifying the fitted model and ensuring that repeated observations, missing cells, random effects, and unbalanced designs are handled appropriately.
Frequently Asked Questions
What is a two-way ANOVA in simple terms?
It tests whether two categorical factors are associated with differences in one quantitative outcome and whether the effect of either factor depends on the other factor.
Can a two-way ANOVA have more than two levels per factor?
Yes. “Two-way” means two factors, not two levels. A 3 × 4 design is still a two-way ANOVA because it contains two factors with three and four levels.
Should the interaction be interpreted before the main effects?
Usually, yes. Interaction tells you whether a main effect can be treated as roughly consistent across the other factor. If interaction is important, emphasize cell means and conditional comparisons.
What does p < .05 mean?
If .05 was chosen as the significance level, a p-value below .05 is sufficient to reject the corresponding null hypothesis under the model assumptions. It does not mean there is a 95% probability that the alternative hypothesis is true.
Can I use two-way ANOVA with unequal sample sizes?
Often yes, but use general linear-model software designed for unbalanced data rather than applying a balanced-design calculator blindly. With unequal cells, model specification and sums-of-squares choices can affect the reported tests.
What is the difference between replication and repeated measures?
Replication uses different independent units within the same cell. Repeated measures use multiple observations from the same unit. Repeated measurements are correlated and require a model that accounts for that structure.
Can I run a two-way ANOVA with one observation per cell?
You can perform an additive row-and-column analysis under additional assumptions, and Excel provides a procedure called Two-Factor Without Replication. But with one value in every cell, the conventional full factorial model cannot separately estimate interaction and residual error, so a standard independent interaction test is unavailable.
Conclusion: Use the Calculator Only After You Identify the Design
The most important step in using a two-way ANOVA calculator is not typing the numbers. It is identifying the experimental unit, deciding whether observations are independent or repeated, confirming whether replication is available, and checking whether a balanced fixed-effects model actually matches the dataset.
When that design is appropriate, two-way ANOVA gives a compact view of Factor A, Factor B, and their interaction. Interpret the interaction before treating marginal means as universal effects, check residual assumptions, report effect magnitude as well as significance, and choose follow-up comparisons that answer the scientific question. If the design is repeated, unbalanced, clustered, or otherwise more complex, move to a model built for those conditions rather than forcing the data into a simple two-way ANOVA calculator.
Sources and Further Reading
Try it in DataClue
Ready to run Two-Way ANOVA?
Examine the effect of two categorical independent variables on a continuous dependent variable. Requires replicate observations in factor combinations.
Run Two-Way ANOVA