
U.S. Federal Debt Data: Levels, Holders, and Interest
A clear guide to the size of federal debt, who holds Treasury securities, and why interest costs are rising.
U.S. Federal Debt Data Analysis: Levels, Holders, and Interest
A clear guide to the size of federal debt, who holds Treasury securities, and why interest costs are rising.
|
$40.03T |
$32.28T |
$9.299T |
$1.170T |
Introduction
U.S. federal debt moved above $40 trillion for the first time in August 2026. The milestone is large, but the number makes more sense when it is broken into parts. On August 21, 2026, total public debt outstanding was about $40.03 trillion. About $32.28 trillion was debt held by the public. Roughly $7.73 trillion was held inside federal government accounts.
This US federal debt data analysis looks beyond the headline total. It explains who holds Treasury securities, how foreign ownership fits into the picture, how much interest the government is paying, and why the average cost of borrowing matters. The goal is not to make a political case. It is to make the accounting easier to understand.
The main sources are the U.S. Treasury Bureau of the Fiscal Service and the Treasury International Capital system. The figures in this article come from different release schedules, so every current number keeps its own reference date.
Quick Answer
The federal debt is now a little above $40 trillion. Debt held by the public makes up about 80.6 percent of that total. Intragovernmental holdings make up the rest. The public portion includes Treasury securities held by investors outside federal government accounts, including individuals, financial firms, the Federal Reserve, state and local governments, and foreign investors.
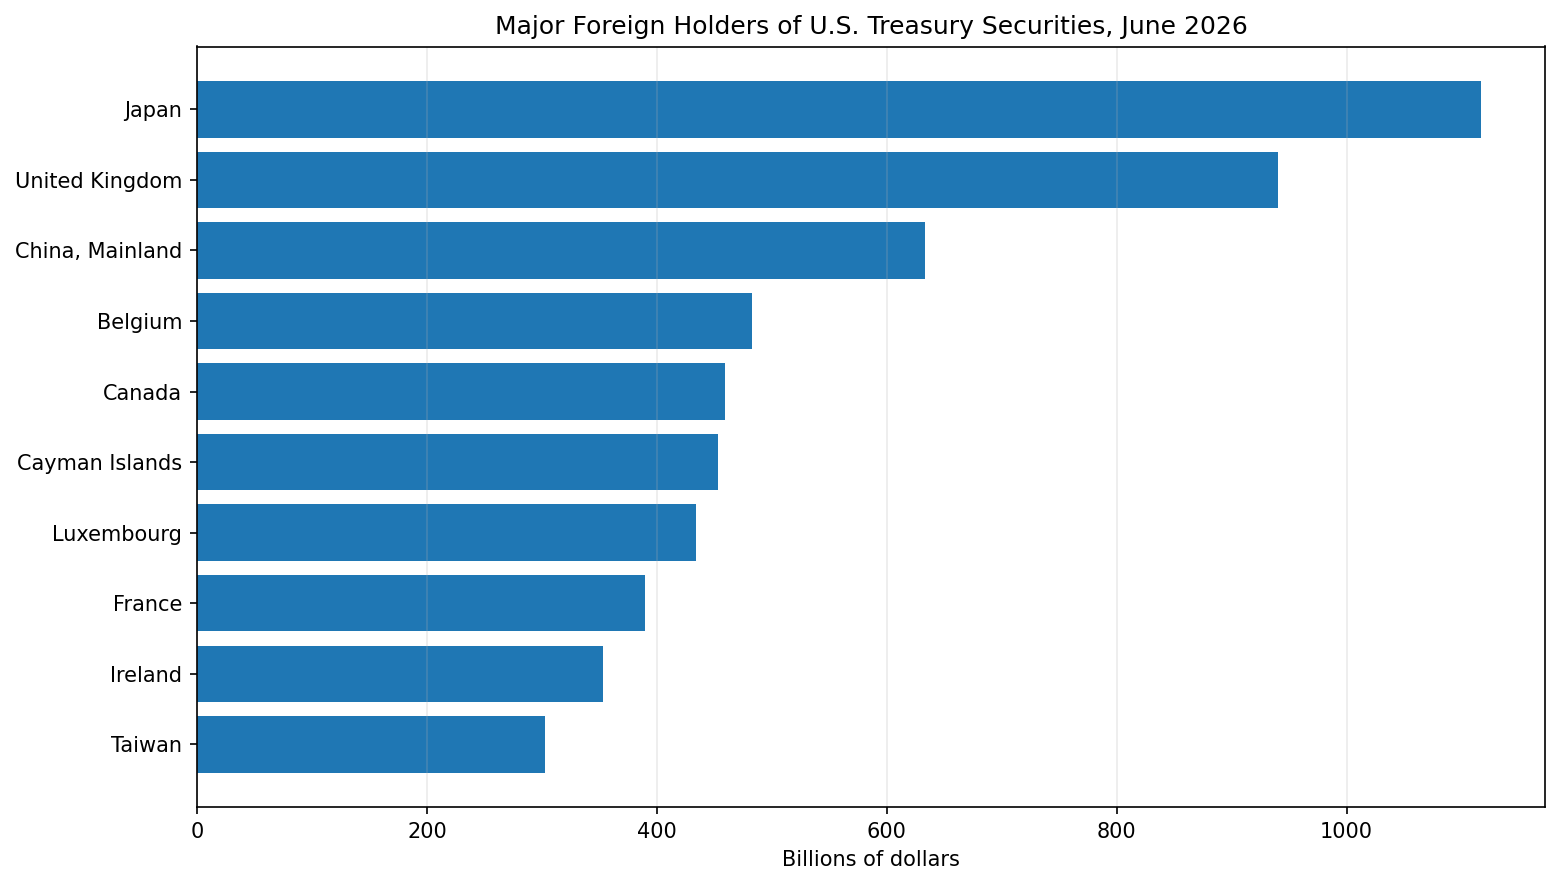
Foreign residents held about $9.299 trillion in Treasury securities in June 2026. Japan was the largest reported foreign holder at about $1.117 trillion, followed by the United Kingdom at about $939.9 billion and mainland China at about $633.4 billion. These country figures are useful, but Treasury warns that custody arrangements can make the reported country different from the final beneficial owner.
Interest cost is also moving higher. Gross interest on Treasury debt securities reached about $1.170 trillion during the first ten months of fiscal 2026. The average rate on total marketable Treasury debt was 3.443 percent in July 2026, compared with 3.399 percent one year earlier and 1.476 percent five years earlier.
U.S. Federal Debt Dashboard: Latest Data
The dashboard below keeps daily debt data separate from monthly budget and holder data. This is important. A June holder figure should not be presented as if it were measured on the same day as an August debt total.
| Metric | Latest value | Reference date or period | Source |
|---|---|---|---|
| Total Public Debt Outstanding | $40.03 trillion | August 21, 2026 | Debt to the Penny |
| Debt held by the public | $32.28 trillion | August 21, 2026 | Debt to the Penny |
| Intragovernmental holdings | about $7.73 trillion | August 21, 2026 | Debt to the Penny |
| Fiscal year receipts | $4.485 trillion | FY 2026 through July | Monthly Treasury Statement |
| Fiscal year outlays | $6.284 trillion | FY 2026 through July | Monthly Treasury Statement |
| Fiscal year deficit | $1.799 trillion | FY 2026 through July | Monthly Treasury Statement |
| Gross interest on Treasury debt securities | $1.170 trillion | FY 2026 through July | Monthly Treasury Statement |
| Average rate on marketable debt | 3.443 percent | July 2026 | Average Interest Rates |
| Foreign Treasury holdings | $9.299 trillion | June 2026 | Treasury International Capital |
Daily debt values, monthly budget values, monthly interest values, and monthly foreign holder values are intentionally shown with separate dates.
How Much Federal Debt Does the U.S. Have?
Treasury first reported total public debt above $40 trillion on August 18, 2026. The daily Debt to the Penny record was about $40.047 trillion that day. The total can move up or down from one business day to the next because Treasury cash management, redemptions, new borrowing, and federal account activity all affect the daily balance.
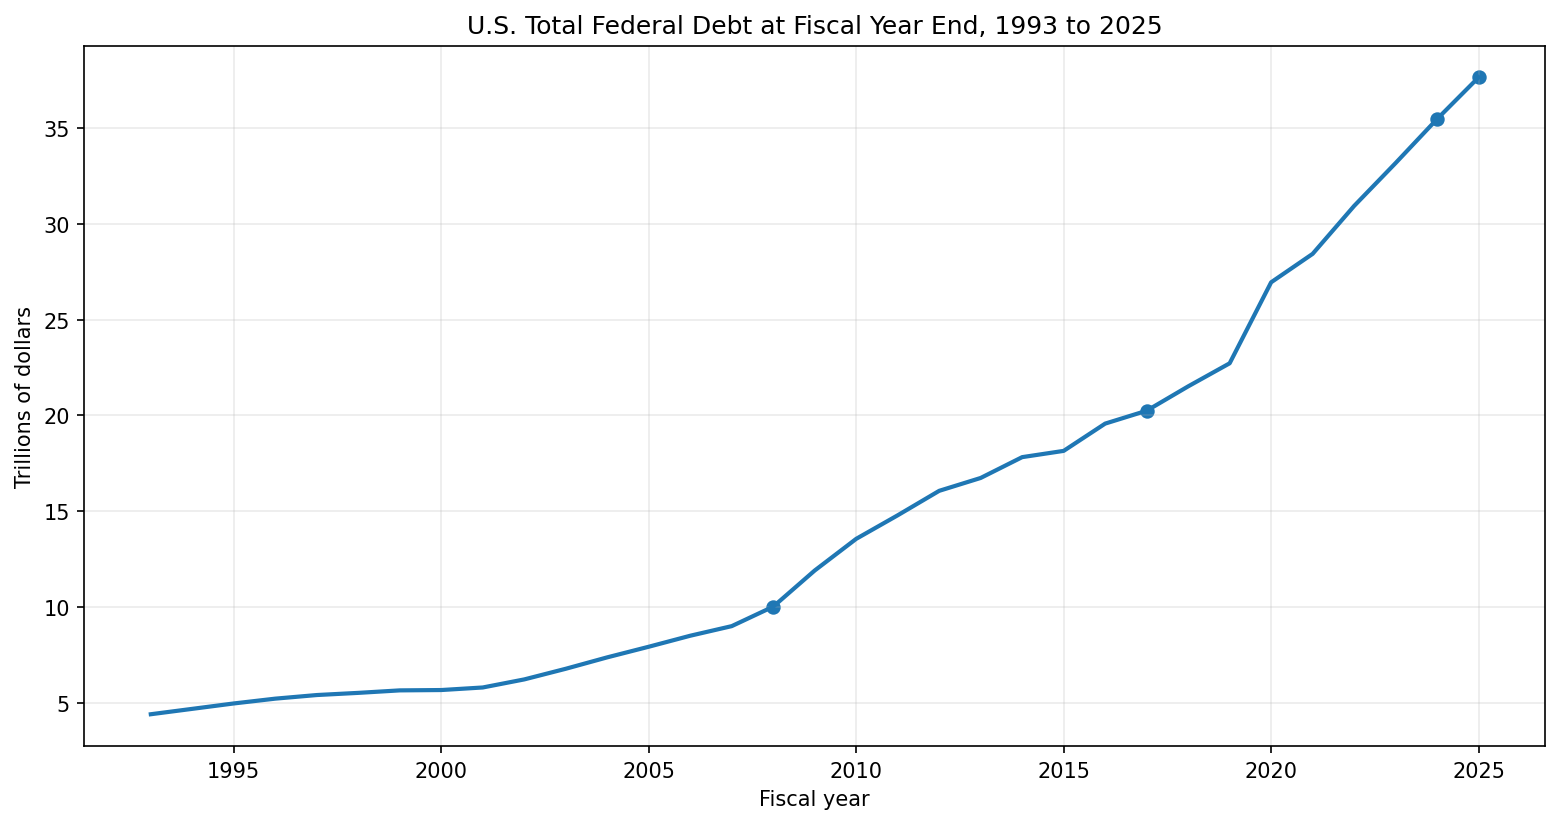
The longer trend is clearer than any one day. Federal debt at fiscal year end rose from about $4.41 trillion in 1993 to about $37.64 trillion in 2025. That is an increase of about $33.2 trillion. The 2025 level was about 8.5 times the 1993 level.
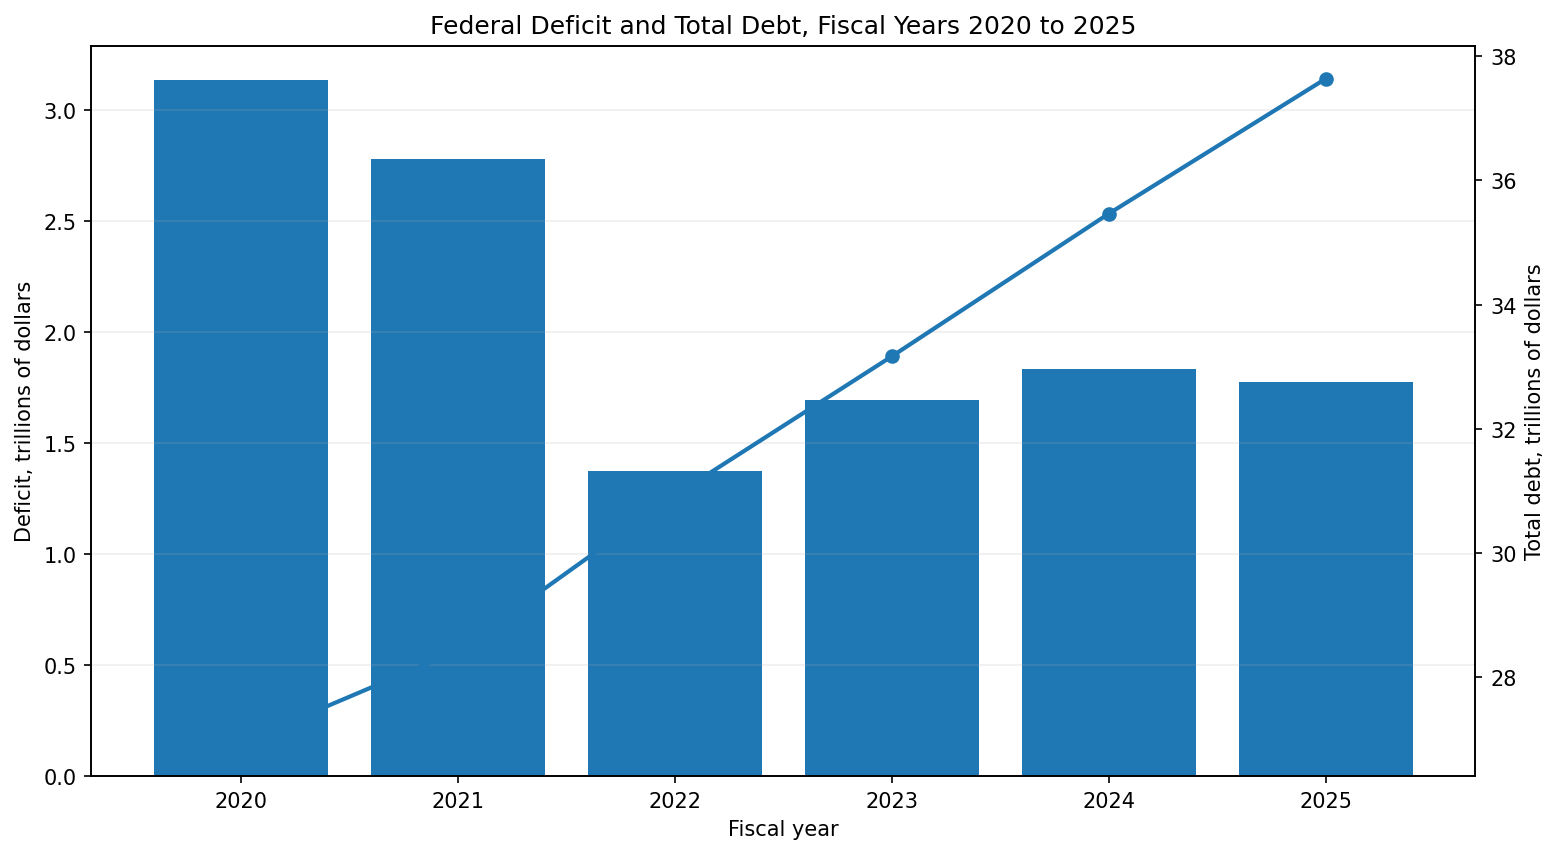
The pace also changed in recent years. Between fiscal 2020 and fiscal 2025, total debt rose by about $10.69 trillion, or roughly 39.7 percent. Large budget deficits were an important reason, though the change in debt does not match the deficit dollar for dollar on every date.
Debt Held by the Public Versus Intragovernmental Holdings
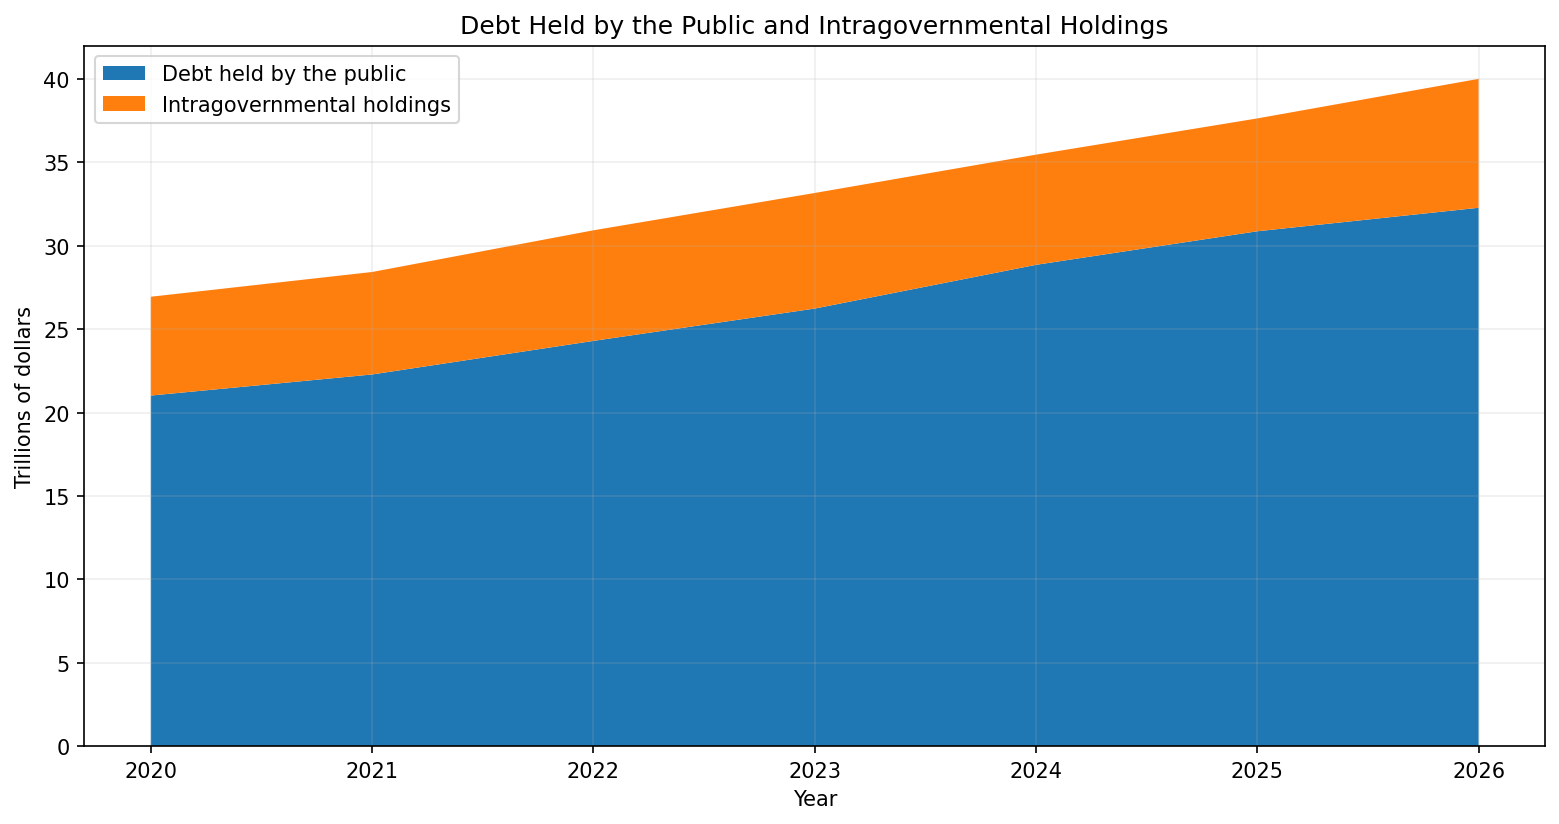
Total public debt outstanding has two main accounting parts. The first is debt held by the public. The second is intragovernmental holdings.
Debt held by the public is Treasury debt held outside federal government accounts. It includes securities held by households, banks, pension funds, mutual funds, state and local governments, the Federal Reserve, foreign governments, and other investors. This part matters directly to financial markets because Treasury must sell and refinance securities with outside holders.
Intragovernmental holdings are Treasury securities held by federal trust funds and other federal accounts. These balances are still part of the federal debt total. They are not the same as debt held by private investors or foreign governments.
This distinction is why a headline such as “foreign countries own the U.S. debt” is incorrect. Foreign holdings are only one part of debt held by the public, and debt held by the public is only one part of total public debt outstanding.
Why the $40 Trillion Milestone Needs Context
A round number can help readers understand scale, but it is not a full measure of fiscal health. Debt sustainability also depends on the size of the economy, the interest rate paid on the debt, the maturity structure of Treasury securities, tax receipts, federal spending, and the path of future deficits.
The milestone still matters because a larger debt stock means more securities must be serviced and refinanced. If the average interest rate rises while the debt stock also rises, interest expense can grow quickly. That is the link between the debt level and the budget pressure seen in 2026.
Who Holds U.S. Federal Debt?
There are several useful ways to answer this question, and they should not be mixed into one pie chart without care. Treasury accounting first separates debt held by the public from intragovernmental holdings. Other datasets then break parts of public debt into investor groups.
Federal Reserve Banks are included in debt held by the public for federal debt accounting. Foreign investors are also included in debt held by the public. Domestic banks, pension funds, mutual funds, insurance companies, households, state and local governments, and other investors also hold Treasury securities.
These categories come from different reports and can use different dates and definitions. A careful article should show them as separate lenses rather than force unmatched observations to add to one total.
| Holder lens | Amount | Reference date | How to read it |
|---|---|---|---|
| Debt held by the public | about $32.28T | August 21, 2026 | Main market liability |
| Intragovernmental holdings | about $7.73T | August 21, 2026 | Federal government accounts |
| Foreign Treasury holdings | $9.299T | June 2026 | Subset of public debt, separate monthly series |
| Federal Reserve Treasury holdings | about $4.694T | Q1 2026 | Subset of public debt, quarterly Treasury Bulletin series |
Do not add the rows in this table. Some rows are subsets of debt held by the public and the dates do not match.
How Much U.S. Debt Is Held Abroad?
Treasury International Capital reported $9.299 trillion in foreign holdings of Treasury securities in June 2026. That figure is substantial, but it is not the same thing as total federal debt. It is a subset of Treasury securities held by investors outside the United States.
Country rankings also need a warning label. Treasury says the monthly data are collected mainly through custodians and broker dealers. If a security owned by an investor in one country is held through a custodian in another country, the reported location may not identify the final owner. The table is best read as a picture of reported custody and investment positions, not a perfect map of final ownership.
Largest Foreign Holders of Treasury Securities
Japan was the largest reported foreign holder in June 2026, with about $1.117 trillion. The United Kingdom followed with about $939.9 billion, while mainland China held about $633.4 billion. Together, those three reporting locations represented about 28.9 percent of total reported foreign Treasury holdings.
The monthly changes also show why one observation should not be turned into a large story. Japan fell from May to June. Canada rose. China declined. These moves can reflect portfolio decisions, market valuation, maturity changes, custody shifts, and other factors.
| Rank | Holder | June 2026 | Monthly change | Annual change | Share of foreign total |
|---|---|---|---|---|---|
| 1 | Japan | $1,116.7B | -26.4B | -38.1B | 12.0% |
| 2 | United Kingdom | $939.9B | -8.7B | +84.3B | 10.1% |
| 3 | China, Mainland | $633.4B | -25.9B | -98.0B | 6.8% |
| 4 | Belgium | $482.5B | +10.5B | +52.2B | 5.2% |
| 5 | Canada | $459.6B | +23.8B | +20.7B | 4.9% |
| 6 | Cayman Islands | $453.1B | -18.2B | +12.2B | 4.9% |
| 7 | Luxembourg | $434.2B | -1.8B | +31.0B | 4.7% |
| 8 | France | $389.9B | -3.2B | +16.1B | 4.2% |
| 9 | Ireland | $353.5B | -3.7B | +43.3B | 3.8% |
| 10 | Taiwan | $302.5B | -3.5B | -4.7B | 3.3% |
How Much Interest Does the Federal Government Pay?
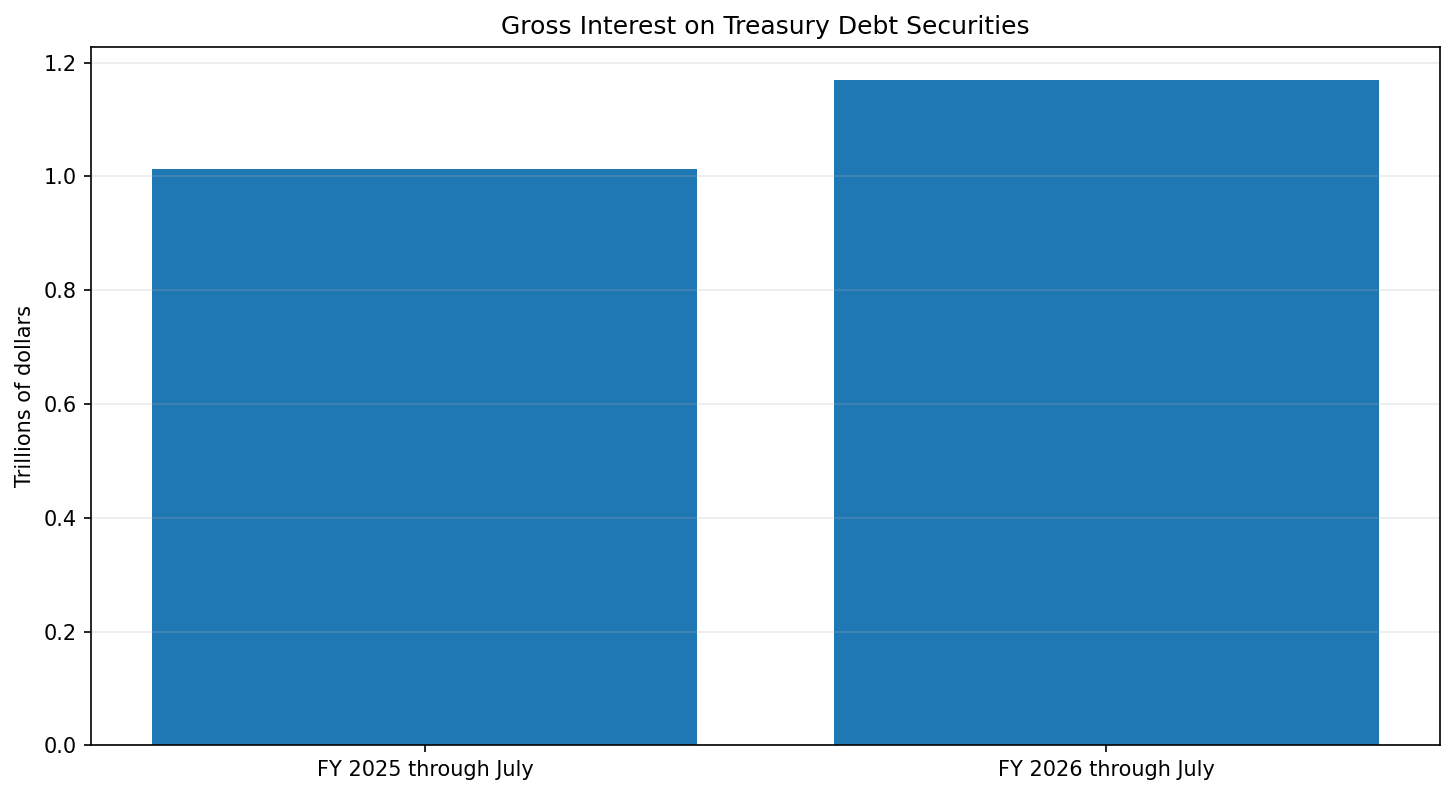
Gross interest on Treasury debt securities reached about $1.170 trillion from October 2025 through July 2026. July alone accounted for about $117.6 billion. The comparable first ten months of the prior fiscal year were about $1.01 trillion, so the current total was roughly 15.5 percent higher.
Gross interest and net interest are not the same measure. Gross interest covers interest paid on Treasury securities, including amounts connected with government accounts. Net interest in the federal budget subtracts some interest receipts and uses budget accounting rules. When comparing articles, always check which measure is being used.
| Period | Gross interest | Average marketable rate | Interpretation |
|---|---|---|---|
| FY 2026 through July | $1.170T | 3.443% | Current fiscal year to date |
| FY 2025 through July | about $1.01T | 3.399% in July 2025 | Comparable prior period |
| July 2026 | $117.6B | 3.443% | One month |
Why Interest Costs Are Rising
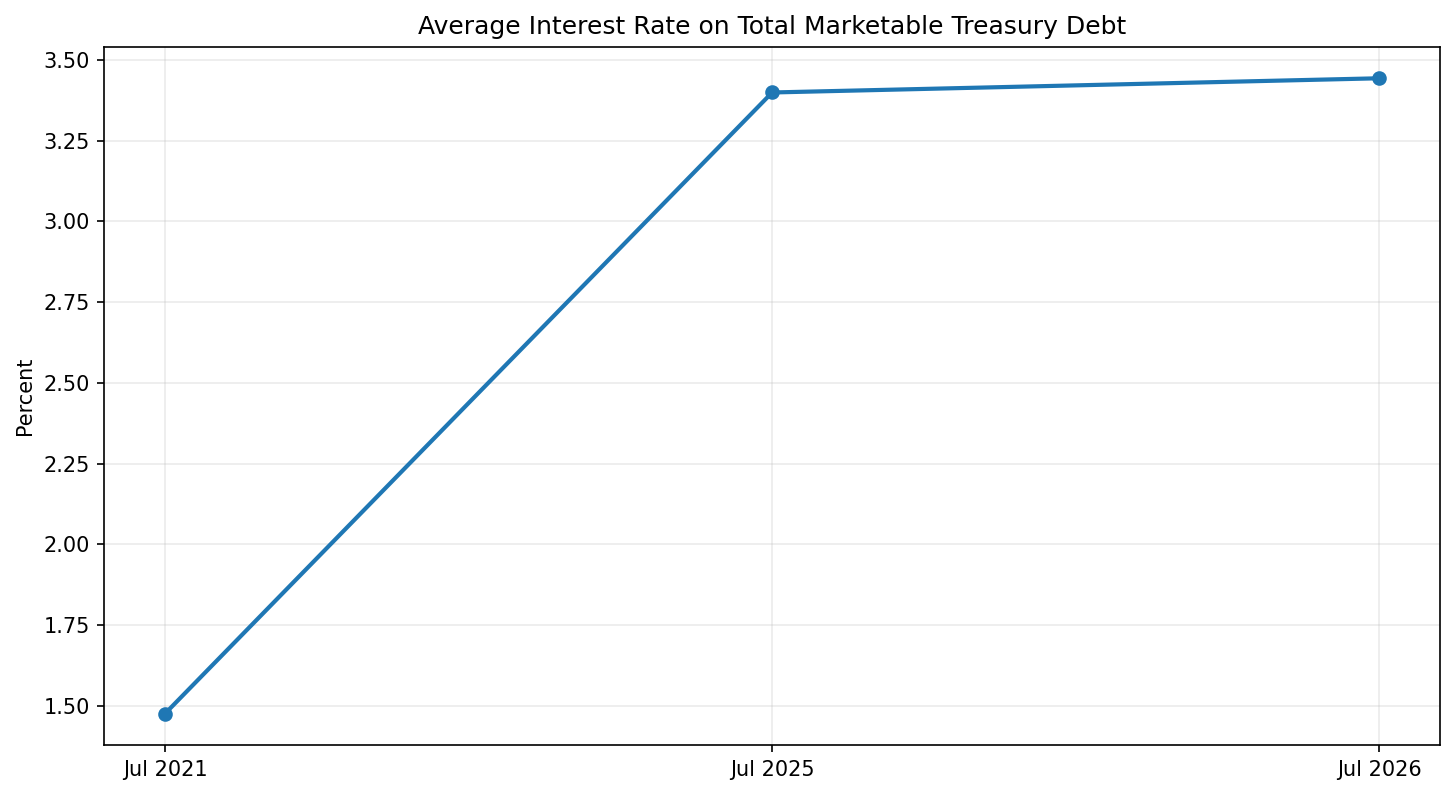
Two forces are working at the same time. First, the amount of debt is larger. Second, the average rate paid on the debt is higher than it was during the low rate period earlier in the decade.
The average rate on total marketable Treasury debt was 3.443 percent in July 2026. It was 3.399 percent in July 2025 and 1.476 percent in July 2021. The five year change is especially important because Treasury debt does not refinance all at once.
Bills mature quickly. Notes and bonds can remain outstanding for years. As older low rate securities mature, Treasury replaces them at the rates investors demand at that time. This means the blended average interest rate can keep rising even after some market rates begin to fall.
How Budget Deficits Add to Federal Debt
The federal government collected about $4.485 trillion in receipts during the first ten months of fiscal 2026 and spent about $6.284 trillion. The resulting deficit was about $1.799 trillion. July alone recorded a deficit of about $432.3 billion.
A deficit means federal outlays exceeded receipts during the period. Treasury generally finances that gap by borrowing. Over time, repeated deficits are a major reason the debt stock rises.
Still, the deficit and the change in daily debt are not a one to one identity. Treasury cash balances, timing differences, federal credit activity, intragovernmental transactions, and other financing items can make the numbers differ over short periods.
Treasury Bills, Notes, Bonds, TIPS, and Other Securities
Treasury finances the government through several types of securities. Bills usually mature within one year. Notes generally mature from two to ten years. Bonds have longer maturities. Treasury Inflation Protected Securities adjust principal for inflation, while Floating Rate Notes use a rate that resets over time.
The mix matters for interest cost. A larger share of short maturity debt can reprice more quickly when market rates change. Longer maturity securities lock in a rate for more time. Treasury debt management therefore affects how fast changes in market rates move into the federal interest bill.
How Federal Debt Changed Over Time
The long run chart shows a steady rise in nominal federal debt, with faster increases during periods of large deficits. The jump after 2020 is especially visible. Fiscal relief, weaker receipts during the pandemic period, later spending, and continued structural deficits all added to borrowing needs.
Nominal debt alone does not show the whole fiscal picture. Debt relative to GDP, interest cost relative to receipts, and interest cost relative to total outlays can add useful context. These ratios should use matched periods so the numerator and denominator refer to the same time frame.
How to Download Treasury Debt Data With Python
Treasury Fiscal Data provides an API that can be used without a commercial data vendor. The basic workflow is simple. Request the fields you need, filter by date, convert the numeric fields, and keep the original source date beside every result.
import requests
import pandas as pd

BASE = "https://api.fiscaldata.treasury.gov/services/api/fiscal_service"

def get_fiscal_data(endpoint, fields=None, filters=None, sort=None):
    params = {}
    if fields:
        params["fields"] = fields
    if filters:
        params["filter"] = filters
    if sort:
        params["sort"] = sort
    params["page[size]"] = 100
    response = requests.get(f"{BASE}/{endpoint}", params=params, timeout=30)
    response.raise_for_status()
    return pd.DataFrame(response.json()["data"])

debt = get_fiscal_data(
    "v2/accounting/od/debt_to_penny",
    fields="record_date,debt_held_public_amt,intragov_hold_amt,tot_pub_debt_out_amt",
    filters="record_date:gte:2026-01-01",
    sort="record_date"
)

for column in [
    "debt_held_public_amt",
    "intragov_hold_amt",
    "tot_pub_debt_out_amt",
]:
    debt[column] = pd.to_numeric(debt[column], errors="coerce")

debt["record_date"] = pd.to_datetime(debt["record_date"])
print(debt.tail())
How to Build the Interactive Debt Dashboard
The interactive chart in the HTML version uses a year slider and Play and Pause controls. It starts with the long run total debt series, then adds recent debt composition, gross interest, and the average marketable debt rate when those observations become available.
The scales stay fixed while the frames move. This makes the visual easier to compare over time. Important values are also written in normal HTML tables so the page remains useful even if a chart script does not load.
Interactive title: How U.S. Federal Debt and Interest Costs Changed Over Time. The long run debt series starts in 1993. Recent composition, interest, and rate series appear when their article observations become available.
Common Mistakes When Reading Federal Debt Data
The most common mistake is treating the federal debt and the annual deficit as the same number. Debt is a stock measured at a point in time. The deficit is a flow measured over a period.
Another mistake is saying that China or another foreign country owns most U.S. debt. Foreign investors as a group hold only part of debt held by the public, and the country level TIC data include custody limitations.
A third mistake is comparing observations from different months without saying so. June foreign holdings and August daily debt levels are both useful, but they are not a matched date comparison.
A fourth mistake is comparing the current average interest rate on outstanding debt with a single market yield. The average debt rate reflects many securities issued at different times and maturities.
Limits of Federal Debt Data
Treasury data are detailed, but each dataset answers a different question. Daily debt data are best for the current stock. The Monthly Treasury Statement is best for receipts, outlays, deficits, and budget flows. TIC data are best for reported foreign positions. Federal Reserve Financial Accounts can add sector detail, but their timing and definitions differ from Treasury accounting.
The article should therefore be refreshed with care. Update the debt number with the latest business day, then update monthly holder and interest tables only when those releases are available. Never make an older monthly series look current by attaching the newest page date to it.
Conclusion
The U.S. federal debt story is not one number. It is a set of connected measures. The total debt is above $40 trillion. Most of it is debt held by the public. Foreign investors are important holders, but they are only one part of the public market. Interest cost is rising because the debt stock is larger and the average rate on outstanding securities is much higher than it was five years ago.
A useful US federal debt data analysis should keep those measures separate, show the source date beside every figure, and explain the accounting in plain language. That approach gives readers more value than a dramatic debt clock headline by itself.
Frequently Asked Questions
How much U.S. federal debt is outstanding?
As of August 21, 2026, total public debt outstanding was about $40.03 trillion. Treasury updates the daily debt series on business days, so the value can change after this article is published.
What is debt held by the public?
Debt held by the public is federal debt held outside federal government accounts. It was about $32.28 trillion on August 21, 2026. It includes Treasury securities held by many U.S. and foreign investors, as well as the Federal Reserve.
What are intragovernmental holdings?
Intragovernmental holdings are Treasury securities held by federal trust funds and other federal accounts. They are part of total public debt outstanding, but they are separate from debt sold to outside investors.
Who owns the U.S. national debt?
Ownership is spread across many groups. These include U.S. households, banks, pension and investment funds, the Federal Reserve, state and local governments, foreign investors, and federal government accounts.
How much U.S. debt is held by foreign investors?
Treasury International Capital reported about $9.299 trillion in foreign Treasury holdings in June 2026. That is a separate monthly series and should not be treated as if it were measured on the same day as the August debt total.
Which country holds the most U.S. Treasury securities?
Japan was the largest reported foreign holder in June 2026, with about $1.117 trillion. Treasury warns that custodial reporting can make the country shown different from the final beneficial owner.
How much U.S. debt does China hold?
Mainland China held about $633.4 billion in Treasury securities in June 2026, according to Treasury International Capital. This is far less than the total federal debt and far less than total debt held by the public.
How much interest does the U.S. pay on the national debt?
Gross interest on Treasury debt securities was about $1.170 trillion during the first ten months of fiscal 2026. Gross interest is not the same as net interest in the federal budget.
Why are federal interest costs rising?
Interest costs are rising because the government is carrying more debt and because the average rate on outstanding marketable debt is higher than it was several years ago. Refinancing older low rate debt at higher rates also raises the blended cost over time.
What is the average interest rate on federal debt?
The average rate on total marketable Treasury debt was 3.443 percent in July 2026. It was 3.399 percent one year earlier and 1.476 percent five years earlier.
What is the difference between the federal debt and the federal deficit?
The debt is the accumulated stock of federal borrowing measured at a point in time. The deficit is the amount by which outlays exceed receipts during a month or fiscal year.
How often does Treasury update debt data?
Debt to the Penny is updated on business days. Interest, budget, and foreign holder datasets are generally updated monthly.
Can I download federal debt data with Python?
Yes. Treasury Fiscal Data provides public API endpoints that can be requested with Python. The article includes a reusable example using requests and pandas.
Methodology and Official Sources
Primary source: U.S. Department of the Treasury, Bureau of the Fiscal Service. Research date: August 24, 2026. The current debt observation is August 21, 2026. The foreign holder observation is June 2026, released August 17, 2026.
- Treasury Debt to the Penny
- Monthly Treasury Statement
- Monthly Statement of the Public Debt
- Treasury Fiscal Data API documentation
- Treasury International Capital
- Major Foreign Holders of Treasury Securities
Downloads
Files attached to this article for your reference.