
U.S. Recession Indicators: Data Dashboard and Signals
A data driven U.S. recession dashboard that tracks the monthly indicators NBER watches, plus the Sahm Rule and Treasury yield curve. See what the latest data say, how past recessions were dated, and how to rebuild the dashboard in Python.
U.S. Recession Indicators: A Data Driven Dashboard
A data driven U.S. recession dashboard that tracks the monthly indicators NBER watches, plus the Sahm Rule and Treasury yield curve. See what the latest data say, how past recessions were dated, and how to rebuild the dashboard in Python.
Recession indicators USA searches usually lead to one simple question: is the U.S. economy in a recession right now? The best answer cannot come from one chart. The National Bureau of Economic Research looks for a significant decline in activity that is broad across the economy, deep enough to matter, and persistent enough to count.
That is why this dashboard tracks several parts of the economy at the same time. It focuses on nonfarm payroll employment, real personal income excluding transfers, industrial production, real consumer spending, and real manufacturing and trade sales. It then adds unemployment, the Sahm Rule, and the Treasury yield curve as supporting signals.
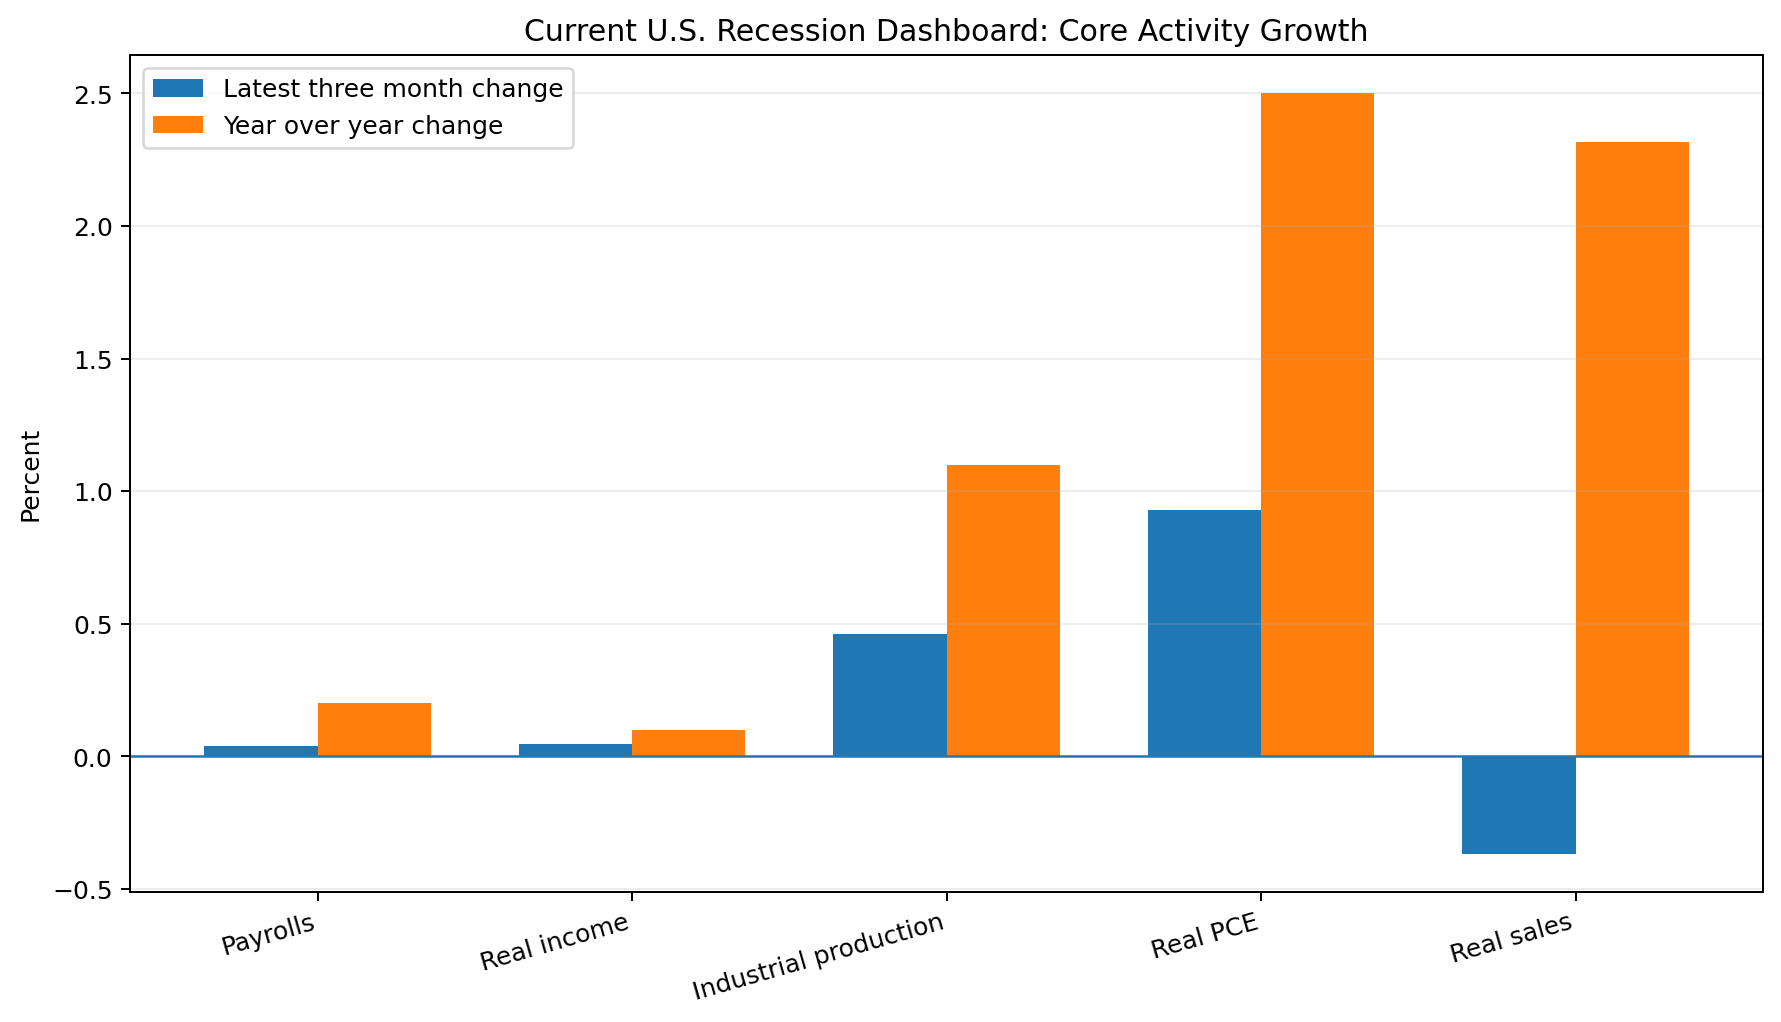
As of August 23, 2026, the latest data do not show the broad, simultaneous decline that normally defines a recession. Four of the five core monthly activity measures are higher over their latest three month windows. Real manufacturing and trade sales are lower over their latest three month window. Payroll growth is also soft, so the picture is better described as mixed and slow than strong.
Quick Answer
What Are Recession Indicators?
Recession indicators are economic measures that help show whether activity is expanding, slowing, or contracting. Some indicators move before the economy turns. Others move at about the same time. A few become clearest only after a downturn is already underway.
A useful dashboard does not mix these roles together. It should show the raw activity measures first, then add leading and labor market signals as context.
How NBER Actually Dates U.S. Recessions
The NBER Business Cycle Dating Committee maintains the official U.S. business cycle chronology. It defines a recession as a significant decline in economic activity that is spread across the economy and lasts more than a few months. The committee also says depth, diffusion, and duration can partly offset one another.
For monthly dating, NBER watches real personal income excluding transfers, nonfarm payroll employment, household employment, real personal consumption expenditures, real manufacturing and trade sales, and industrial production. It does not use a fixed formula. In recent decades, NBER says it has placed substantial weight on real personal income excluding transfers and payroll employment.
The process is retrospective. NBER waits until enough evidence is available before it dates a peak or trough. That is why the FRED recession series should be treated as official historical shading, not a live recession detector.
U.S. Recession Indicators Dashboard: Latest Data
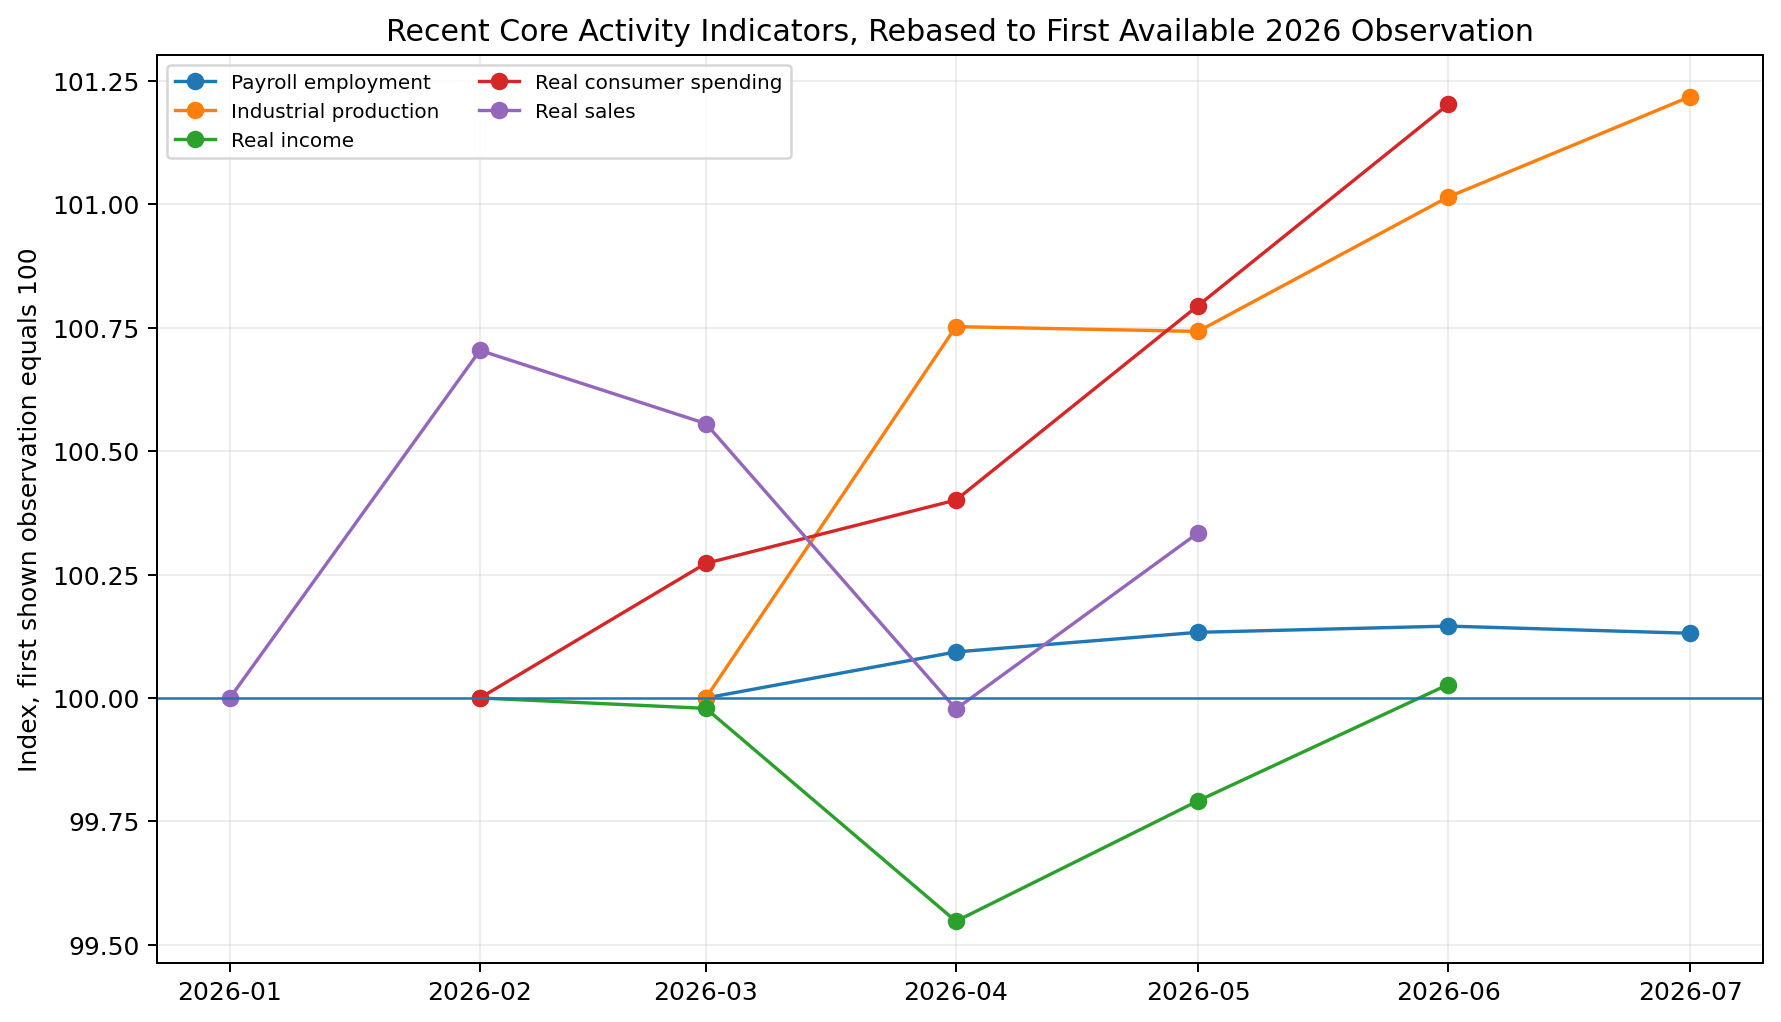
The latest dashboard has different observation months because the source releases arrive on different schedules. July 2026 is available for payrolls, unemployment, industrial production, and the Sahm Rule. June is the latest month for income and real consumer spending. May is the latest month for real manufacturing and trade sales.
This timing difference matters. A good dashboard should show the observation month beside every number instead of forcing older series to look as current as newer ones.
| Indicator | Period | Value | 1 month | 3 month | 12 month | Signal | Why it matters |
|---|---|---|---|---|---|---|---|
| Nonfarm payroll employment | Jul 2026 | 158.858 million | -23 thousand | 0.04% | 0.2% | Stable | Employment remains near its recent level, but July slipped and year over year growth is soft. |
| Real personal income excluding transfers | Jun 2026 | $16.606 trillion SAAR | +$39.1 billion | 0.05% | 0.1% | Stable | Real income is slightly higher over three months, but annual growth is close to flat. |
| Industrial production | Jul 2026 | 102.9939 | +0.2071 index point | 0.46% | 1.1% | Improving | Production has risen over the recent three month window and is above its year earlier level. |
| Real personal consumption expenditures | Jun 2026 | $16.885 trillion SAAR | +$68.0 billion | 0.93% | 2.5% | Improving | Real consumer spending is still expanding and is one of the firmer core activity measures. |
| Real manufacturing and trade sales | May 2026 | $1.586 trillion | +$5.637 billion | -0.37% | 2.3% | Caution | Sales rose in May but remain below their February level, making this the weakest core three month signal. |
Payroll Employment
Nonfarm payroll employment was 158.858 million in July 2026. That was 23,000 below revised June payrolls, but it was still 60,000 above April. FRED shows payroll employment only 0.2 percent above its year earlier level.
This is not a clean recession signal because the three month level is still slightly higher. It is a soft signal because annual job growth is weak and the latest monthly move was negative. NBER gives payroll employment substantial weight because it covers a large share of the economy.
Real Personal Income Excluding Transfers
Real personal income excluding current transfer receipts was 16.606 trillion dollars at a seasonally adjusted annual rate in June 2026. It rose from May and was slightly above March.
The three month increase is only about 0.05 percent, and FRED shows the series just 0.1 percent above a year earlier. That makes income stable rather than strong. This measure matters because it focuses on income tied more closely to production rather than government transfer payments.
Industrial Production
Industrial production reached 102.9939 in July 2026, using 2017 as the index base of 100. It rose from June and was about 0.46 percent above April.
The index was 1.1 percent above a year earlier. That is a firmer signal than payroll or income, although production covers a smaller share of the modern service based economy than it did decades ago.
Real Consumer Spending
Real personal consumption expenditures reached 16.885 trillion dollars at a seasonally adjusted annual rate in June 2026. Real spending was about 0.93 percent above March and 2.5 percent above a year earlier.
Consumer spending is one of the stronger current lines in the dashboard. NBER notes that PCE is a large share of GDP, although it is not always the most informative monthly indicator in every recession.
Real Manufacturing and Trade Sales
Real manufacturing and trade sales were 1.586 trillion dollars in May 2026. The level increased from April but remained about 0.37 percent below February.
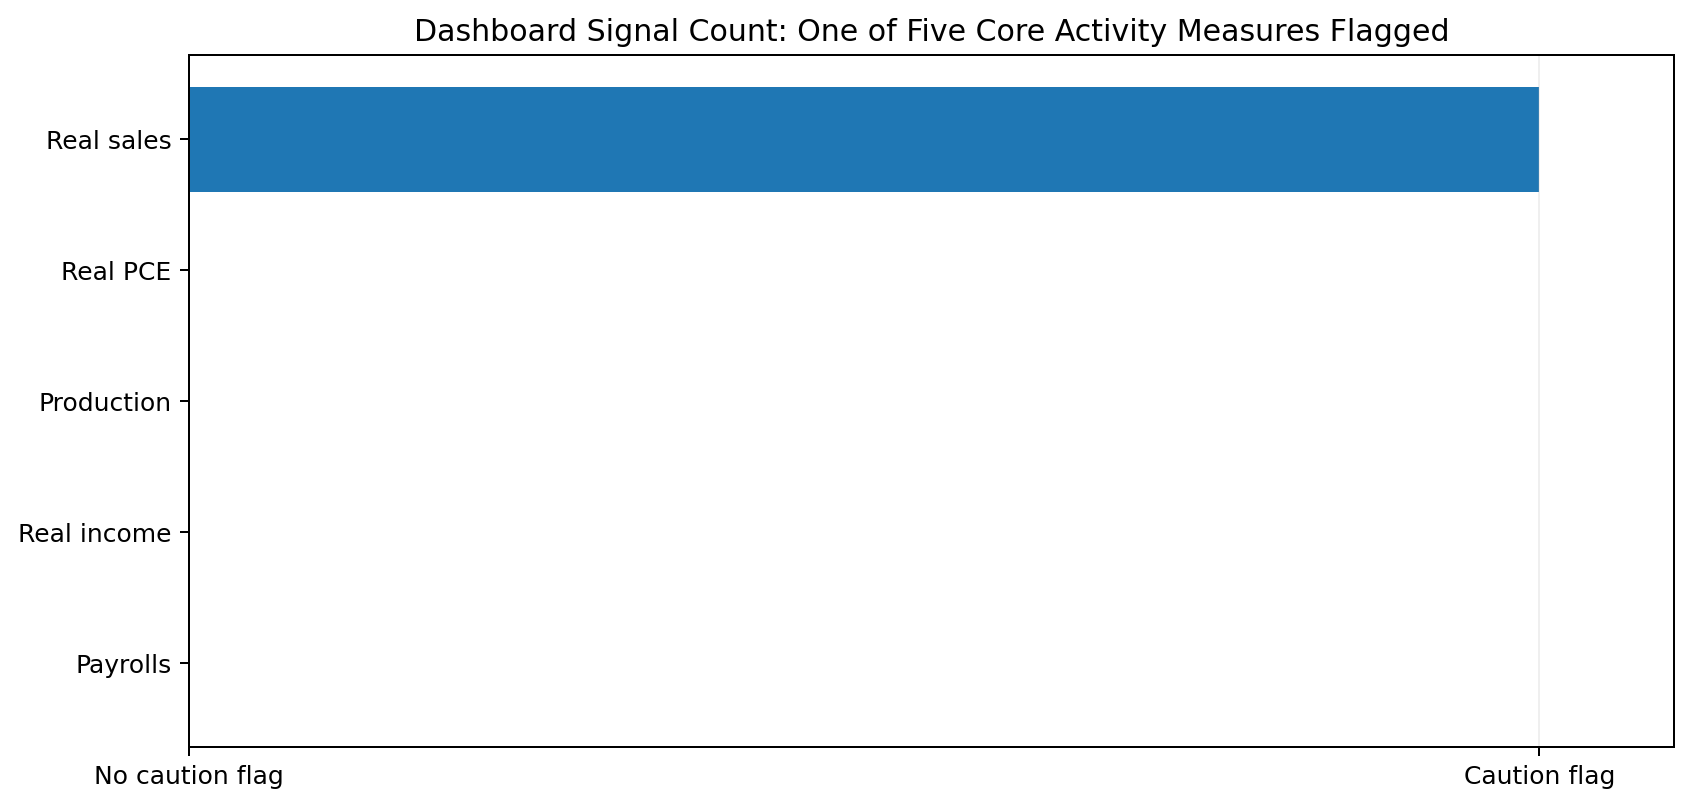
This is the only core monthly activity measure in this dashboard that receives a caution flag under the simple three month rule. The year over year level is still about 2.3 percent higher, so the signal is weakening rather than a clear contraction.
Unemployment and the Sahm Rule
The unemployment rate was 4.1 percent in July 2026, down from 4.2 percent in June and 4.3 percent in May. The level by itself does not date a recession. NBER notes that unemployment can rise before an economic peak and can continue rising after a trough.
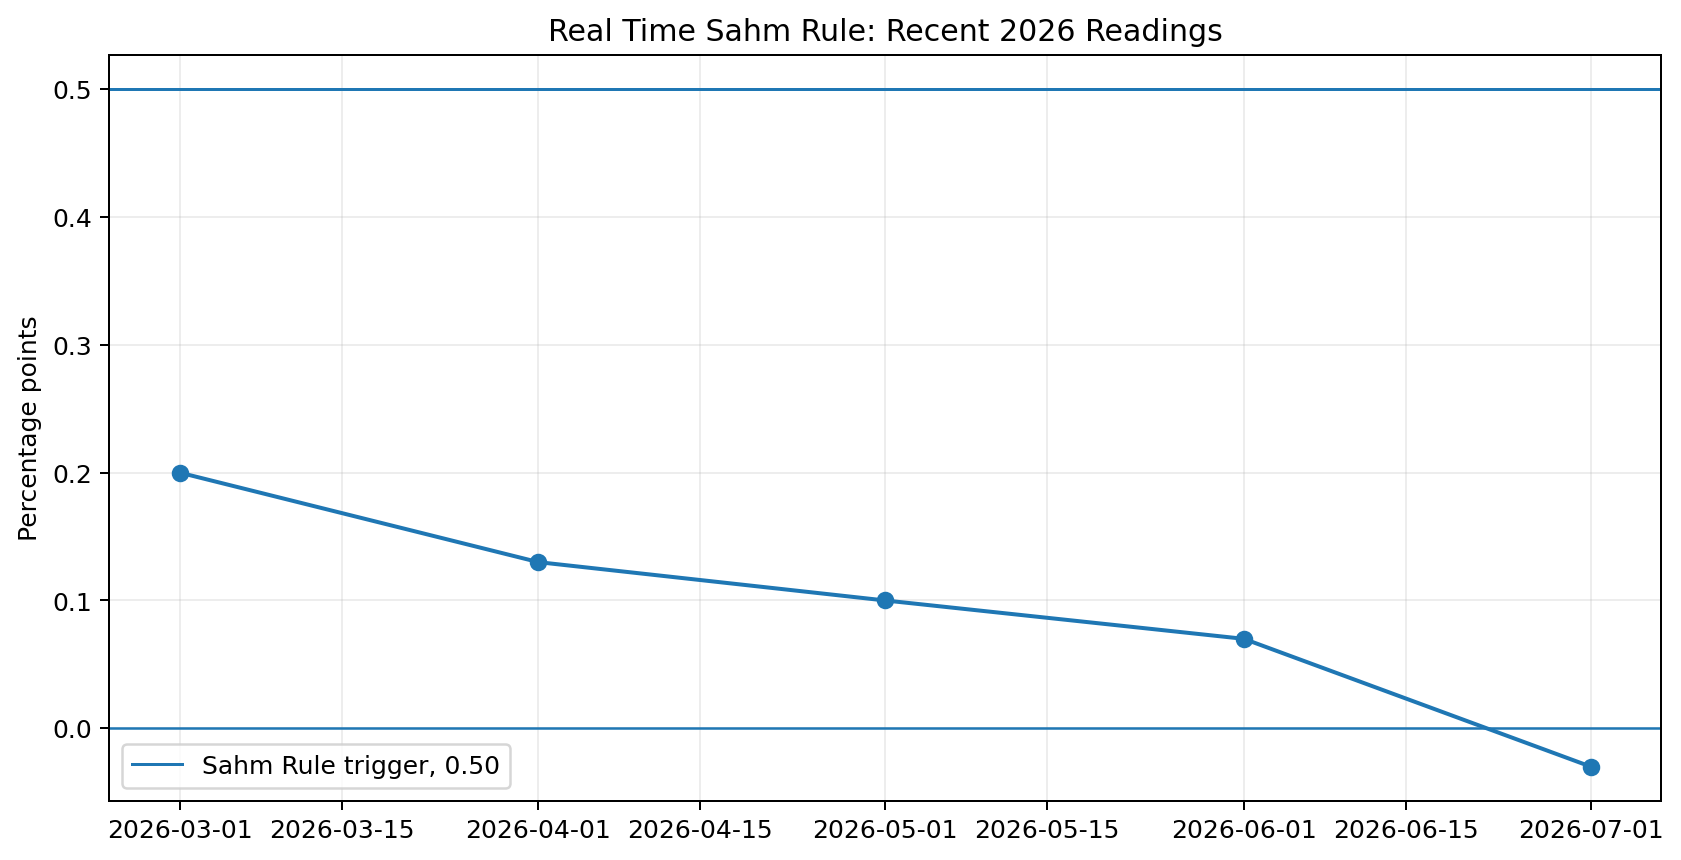
The real time Sahm Rule was minus 0.03 percentage point in July. The rule signals the start of a recession when the three month average unemployment rate rises by at least 0.50 percentage point above its minimum three month average from the prior 12 months. The current reading is well below that trigger.
The Sahm Rule is best treated as a real time labor market confirmation tool. It is not the NBER dating method, and the 2024 trigger showed why no rule should be treated as infallible.
| Supporting indicator | Period | Value | Recent context | Status |
|---|---|---|---|---|
| Unemployment rate | Jul 2026 | 4.1% | Down from 4.2% in June | Stable |
| Real time Sahm Rule | Jul 2026 | -0.03 pp | Below the 0.50 pp trigger | Below trigger |
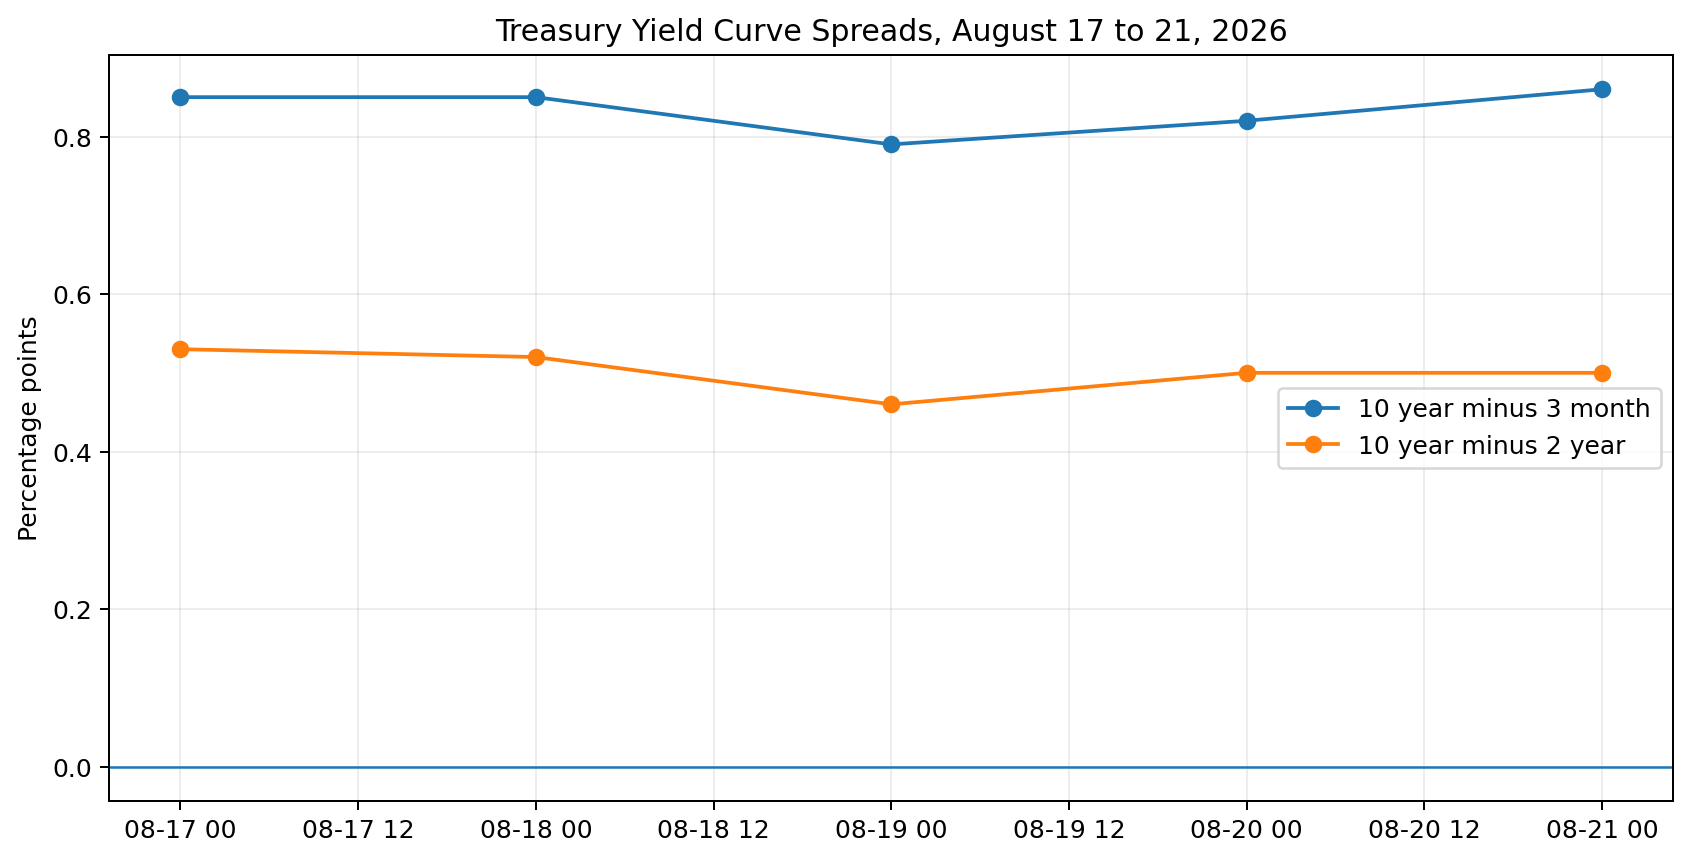
| 10 year minus 3 month Treasury spread | Aug 21 2026 | 0.86 pp | Positive slope | Positive |
| 10 year minus 2 year Treasury spread | Aug 21 2026 | 0.50 pp | Positive slope | Positive |
| NBER based recession indicator | Jul 2026 | 0 | No recession month currently dated | Retrospective |
Yield Curve Signals
The Treasury yield curve is a leading financial signal, not a recession dating rule. On August 21, 2026, the 10 year Treasury yield was 0.86 percentage point above the 3 month yield. The 10 year yield was 0.50 percentage point above the 2 year yield.
Both spreads were positive on that date. A positive curve can suggest that a past inversion has ended, but it does not prove that recession risk has disappeared. Yield curve signals often lead the real economy by a long and variable amount of time.
What the Indicators Show Together
The current signal count is simple and transparent. A core activity measure receives a caution flag when its latest three month change is negative. Under that rule, one of five core measures is flagged: real manufacturing and trade sales.
That does not mean recession risk is zero. Payroll growth is soft, real income growth is nearly flat, and the series do not all refer to the same month. The dashboard is more consistent with slow, uneven expansion than with a broad contraction.
How These Indicators Behaved Before Past Recessions
Past recessions show why a dashboard is better than one trigger. Around the July 1990 peak, payroll employment peaked in June, real personal income peaked in July, real sales peaked in August, and industrial production peaked in September. The major series did not turn on the same date.
The pattern was similar in later downturns. Payrolls, income, spending, production, and labor market rules moved with different timing. NBER therefore waits for enough evidence across the economy before it dates a turning point.
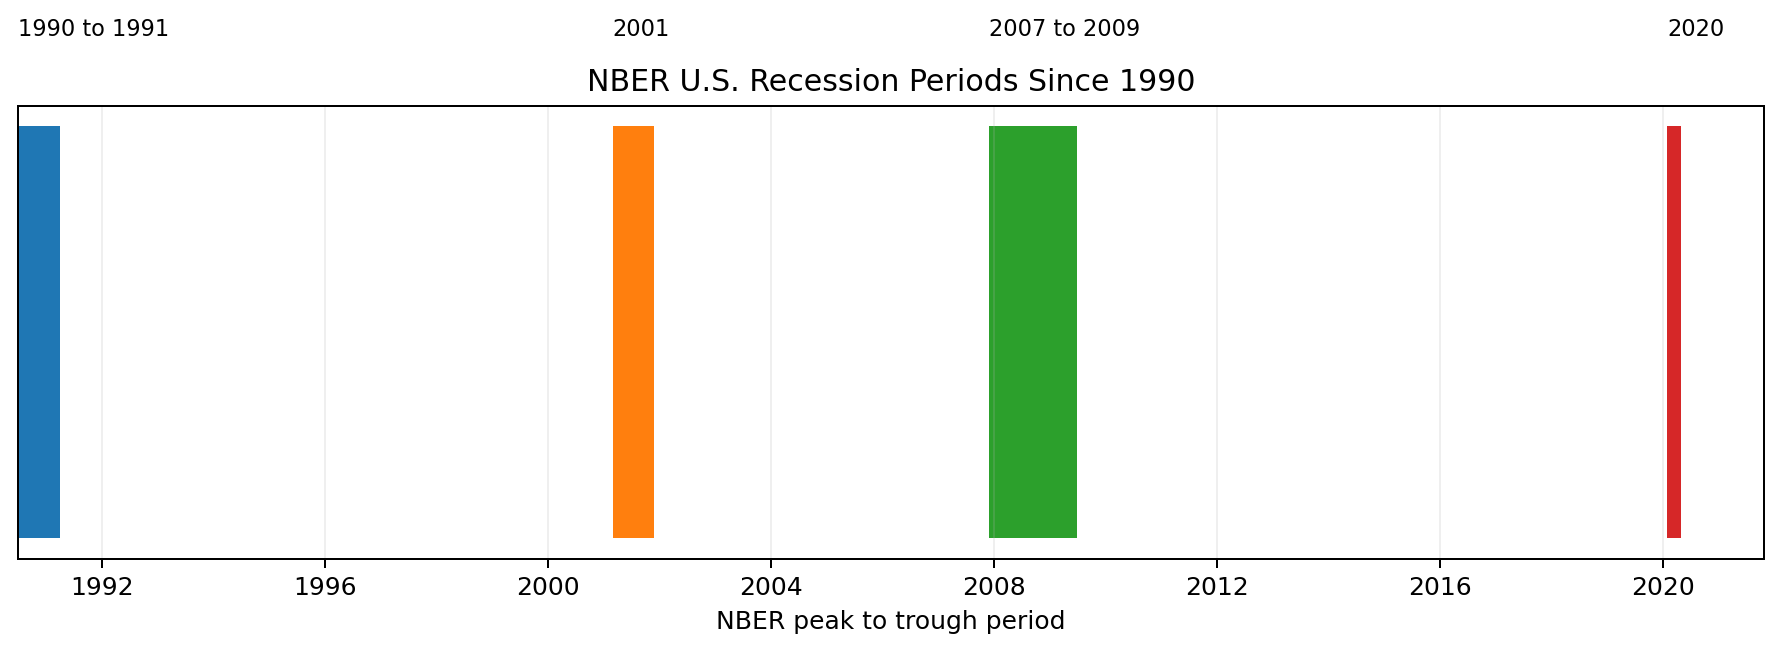
| Recession | NBER peak | NBER trough | Sahm trigger | What the episode shows |
|---|---|---|---|---|
| 1990 to 1991 | Jul 1990 | Mar 1991 | Oct 1990 | Major monthly indicators peaked in different months around the NBER peak. |
| 2001 | Mar 2001 | Nov 2001 | Jul 2001 | Employment and production weakened as the downturn spread through the economy. |
| 2007 to 2009 | Dec 2007 | Jun 2009 | Feb 2008 | Payroll employment peaked in December 2007 and later fell broadly. |
| 2020 | Feb 2020 | Apr 2020 | Apr 2020 | Payrolls, real income excluding transfers, and real PCE all reached clear peaks around February. |
U.S. Recession Signals Through Time: Labor, Income, Production, Spending, and Yield Curve
This episode animation uses qualitative historical status based on NBER chronology and published descriptions, then ends with the current 2026 dashboard. It is not an official recession probability.
Why Recession Indicators Can Disagree
Economic data arrive at different times and are revised at different speeds. A labor series may be current through July while a sales series is still available only through May.
The economy can also rotate between sectors. Services can remain firm while manufacturing weakens, or employment can stay stable while real income slows. Recession dating asks whether weakness is broad enough to represent the whole economy.
Leading, Coincident, and Lagging Indicators
The yield curve is a leading signal because it can change well before real activity turns. Payrolls, income, industrial production, spending, and real sales are closer to coincident activity measures because they describe what the economy is doing now or very recently.
Unemployment is often more lagging. It can keep rising after production and spending have already started to recover. The Sahm Rule uses unemployment changes to provide a timely recession signal, but it usually confirms a downturn after the economic peak.
Limits of a Recession Dashboard
This dashboard is not an official NBER recession probability. The signal count is an editorial summary of simple rules that are visible to the reader.
The analysis also uses the latest revised data. Historical data can look cleaner after revisions than they did in real time. A deeper backtest should use ALFRED vintages so every historical observation reflects what was actually known at the time.
No dashboard can remove uncertainty from a turning point. The useful goal is to make the evidence easier to inspect, not to turn a complex business cycle into one magic number.
How to Build the Dashboard in Python
FRED offers a direct CSV route that works well for a reproducible tutorial. The first block downloads the series and keeps dates and missing values clean.
import pandas as pd

def fred_csv(series_id):
    url = (
        "https://fred.stlouisfed.org/graph/"
        f"fredgraph.csv?id={series_id}"
    )
    data = pd.read_csv(url)
    data.columns = ["date", series_id]
    data["date"] = pd.to_datetime(data["date"])
    data[series_id] = pd.to_numeric(
        data[series_id],
        errors="coerce"
    )
    return data

series_ids = [
    "PAYEMS",
    "W875RX1",
    "INDPRO",
    "PCEC96",
    "CMRMTSPL",
    "UNRATE",
    "SAHMREALTIME",
    "USREC",
    "T10Y3M",
    "T10Y2Y",
]
Next, calculate the three month changes used by the transparent signal count.
def pct_change(series, periods):
    return series.pct_change(periods) * 100

dashboard["payroll_3m"] = pct_change(
    dashboard["PAYEMS"], 3
)
dashboard["income_3m"] = pct_change(
    dashboard["W875RX1"], 3
)
dashboard["production_3m"] = pct_change(
    dashboard["INDPRO"], 3
)
dashboard["pce_3m"] = pct_change(
    dashboard["PCEC96"], 3
)
dashboard["sales_3m"] = pct_change(
    dashboard["CMRMTSPL"], 3
)

dashboard["sahm_triggered"] = (
    dashboard["SAHMREALTIME"] >= 0.50
)
The signal count only asks how many of the five core activity changes are below zero. It is not an NBER probability.
core_cols = [
    "payroll_3m",
    "income_3m",
    "production_3m",
    "pce_3m",
    "sales_3m",
]

latest = dashboard[core_cols].ffill().iloc[-1]

signal_count = int(
    (latest < 0).sum()
)

print(
    "Core caution flags:",
    signal_count,
    "of",
    len(core_cols)
)
Conclusion
The latest recession indicators USA dashboard is mixed, but it does not show the broad contraction that NBER usually looks for. Four of five core monthly activity measures are above their levels from three months earlier. The Sahm Rule is below its trigger and the Treasury curve is positive. The main weak spot is real manufacturing and trade sales, while payroll and real income growth remain soft.
The next useful update will come as income, spending, sales, employment, and production data refresh. The goal is not to predict a recession from one number. It is to watch whether weakness becomes deeper, broader, and more persistent across the economy.
Frequently Asked Questions
What are the best recession indicators in the USA?
The most useful core measures are payroll employment, real personal income excluding transfers, industrial production, real consumer spending, and real manufacturing and trade sales. NBER also looks at household employment and quarterly GDP and GDI. The Sahm Rule and yield curve are useful supporting signals.
Is the U.S. in a recession right now?
NBER has not dated a new recession after the February to April 2020 downturn. Current monthly activity data also do not show a broad simultaneous decline. That does not prevent NBER from dating a recent peak later if future evidence changes the picture.
Who decides when a U.S. recession begins?
The NBER Business Cycle Dating Committee maintains the widely used official chronology of U.S. business cycle peaks and troughs.
What is the Sahm Rule?
The real time Sahm Rule compares the three month average unemployment rate with its lowest three month average from the prior 12 months. A rise of at least 0.50 percentage point is the trigger.
Does an inverted yield curve guarantee a recession?
No. Yield curve inversion has often appeared before recessions, but the timing varies. It is a leading financial signal, not an official recession dating rule.
Are two negative GDP quarters always a recession?
No. Two negative quarters are a useful rule of thumb, but NBER uses a broader set of monthly and quarterly evidence.
Why does NBER wait before announcing a recession?
NBER waits for enough data to be confident that a broad turning point occurred. Many economic series are revised, and different indicators can peak or trough in different months.
How often should this dashboard be updated?
Update it monthly after the main labor, income, spending, sales, and production releases. Keep the observation month visible because the series update on different schedules.
Can I download recession indicator data from FRED with Python?
Yes. FRED graph CSV links make it possible to download many public series directly with pandas. For real time historical backtests, ALFRED vintages are more appropriate.
Methodology
The core dashboard uses PAYEMS, W875RX1, INDPRO, PCEC96, and CMRMTSPL. A measure receives a caution flag when its latest three month level change is negative. The Sahm Rule threshold is 0.50 percentage point. Treasury spreads use daily readings through August 21, 2026. NBER recession dates are historical and retrospective.
The article uses the latest revised data available on August 23, 2026. Historical research can look cleaner after revisions than it did in real time, so ALFRED vintages are better for strict historical backtests.
Official Sources
Downloads
Files attached to this article for your reference.