
U.S. Treasury Fiscal Data API: Debt Analysis in Python
Download official Treasury debt and budget data with Python, clean it in pandas, and build clear fiscal tables, charts, and an interactive history.
U.S. Treasury Fiscal Data API: Debt and Deficit Analysis
Download official Treasury debt and budget data with Python, clean it in pandas, and build clear fiscal tables, charts, and an interactive history.
The US Treasury Fiscal Data API gives Python users direct access to official federal finance data without scraping reports by hand. In this tutorial, you will use Treasury data to study the national debt, debt held by the public, intragovernmental holdings, federal receipts, federal outlays, and the budget deficit. You will also build reusable pandas code, four clear charts, and an interactive fiscal history animation.
The latest figures used in this article come from official Treasury sources. The latest Debt to the Penny record verified for this tutorial is August 13, 2026. Total public debt outstanding was about $39.93 trillion. Of that amount, about $32.20 trillion was debt held by the public and about $7.73 trillion was intragovernmental holdings. Through July 2026, Treasury reported about $4.49 trillion in fiscal year receipts, $6.28 trillion in outlays, and a $1.80 trillion deficit.
Those figures describe different things. Debt is a stock measured at a date. A deficit is a flow measured over a period. Keeping that difference clear is one of the most important parts of federal debt analysis Python work.
Quick Answer
What Is the U.S. Treasury Fiscal Data API?
Fiscal Data is a public data service from the U.S. Department of the Treasury, Bureau of the Fiscal Service. It provides structured access to federal financial datasets through a REST API. For a Python user, that means you can request only the fields and dates you need instead of downloading and cleaning a large report by hand.
The API documentation supports field selection, filters, sorting, output formats, and pagination. A response includes a data section and metadata that can help you check record counts and pages. Treasury documents a total pages value in the metadata, which is useful when a request returns more records than one page can hold.
For this article, two datasets matter most. Debt to the Penny gives daily debt values. The Monthly Treasury Statement gives receipts, outlays, and budget results. Historical Debt Outstanding is also useful for a simple fiscal year debt trend.
Federal Debt vs. Federal Deficit
Federal debt and the federal deficit are related, but they are not the same measure.
Debt is the amount the federal government owes at a point in time. Treasury reports total public debt outstanding as the sum of debt held by the public and intragovernmental holdings. A deficit is the amount by which federal outlays are greater than federal receipts during a period. If receipts are greater than outlays, the government records a surplus.
A simple example helps. If the government collects $500 billion in a month and spends $650 billion, the monthly deficit is $150 billion. The existing debt is much larger because it reflects accumulated borrowing over many years. Treasury also explains that changes in debt do not always equal the budget deficit because cash balances and other financing activities can affect borrowing.
Set Up Python for Treasury Fiscal Data
You need only a few common Python libraries. requests handles the API call. pandas cleans and analyzes the response. matplotlib creates static charts. Plotly is useful when you want an interactive animation.
The code examples below use direct API requests first. That keeps the workflow easy to inspect and easy to reuse in a notebook, script, or data pipeline.
import requests
import pandas as pd
import matplotlib.pyplot as plt
import plotly.graph_objects as go

BASE_URL = (
    "https://api.fiscaldata.treasury.gov/"
    "services/api/fiscal_service/"
)
Make Your First Treasury Fiscal Data API Request
Start with Debt to the Penny. The endpoint is v2/accounting/od/debt_to_penny. The request below asks for the most recent rows and limits the fields to the date and three debt measures.
The Treasury endpoints used here are public. The example does not place a private credential in the URL. Always check the current official documentation before building a production system in case access rules change.
endpoint = "v2/accounting/od/debt_to_penny"

params = {
    "fields": (
        "record_date,debt_held_public_amt,"
        "intragov_hold_amt,tot_pub_debt_out_amt"
    ),
    "sort": "-record_date",
    "page[size]": 5,
}

response = requests.get(
    BASE_URL + endpoint,
    params=params,
    timeout=30,
)
response.raise_for_status()
payload = response.json()

print(payload["data"][0])
Understand Fields, Filters, Sorting, and Pagination
A good API request should be narrow enough to understand and broad enough to answer the question. The fields parameter keeps only the columns you need. Filters let you limit dates or other values. Sort controls order. Pagination lets you move through large responses.
Treasury documentation reports the number of total pages in the response metadata. When you need a long history, loop over page numbers until you reach that total. This is safer than assuming the first page contains every record.
def get_all_pages(endpoint, params=None, page_size=500):
    params = dict(params or {})
    params["page[size]"] = page_size
    page_number = 1
    rows = []

    while True:
        params["page[number]"] = page_number
        response = requests.get(
            BASE_URL + endpoint,
            params=params,
            timeout=30,
        )
        response.raise_for_status()
        payload = response.json()
        rows.extend(payload.get("data", []))

        meta = payload.get("meta", {})
        total_pages = int(meta.get("total-pages", 1))
        if page_number >= total_pages:
            break
        page_number += 1

    return pd.DataFrame(rows)
Download Debt to the Penny Data With Python
For a useful debt analysis, request a date range rather than only the latest row. The example below starts in 2020 and sorts forward through time. Keep the original dollar fields in the DataFrame. Create trillion dollar columns only for display and charts.
Debt to the Penny is a daily dataset. Treasury describes it as total outstanding public debt and breaks it into debt held by the public and intragovernmental holdings. The dataset is normally updated each business day with data from the previous business day.
debt = get_all_pages(
    "v2/accounting/od/debt_to_penny",
    params={
        "fields": (
            "record_date,debt_held_public_amt,"
            "intragov_hold_amt,tot_pub_debt_out_amt"
        ),
        "filter": "record_date:gte:2020-01-01",
        "sort": "record_date",
    },
)

debt["record_date"] = pd.to_datetime(debt["record_date"])

amount_cols = [
    "debt_held_public_amt",
    "intragov_hold_amt",
    "tot_pub_debt_out_amt",
]

for col in amount_cols:
    debt[col] = pd.to_numeric(debt[col], errors="coerce")

debt = debt.sort_values("record_date").reset_index(drop=True)
print(debt.tail())
Analyze Total Debt and Debt Components
The latest verified Debt to the Penny row used in this article is August 13, 2026. Total public debt outstanding was $39.9348 trillion. Debt held by the public was $32.2010 trillion and intragovernmental holdings were $7.7338 trillion.
That means debt held by the public represented about 80.6 percent of total public debt in this snapshot, while intragovernmental holdings represented about 19.4 percent. These shares help explain the composition of the total, but they do not tell you who caused the debt to rise or what future borrowing will be.
The September 30, 2025 Historical Debt Outstanding value was about $37.64 trillion. Compared with that fiscal year end level, the August 13, 2026 daily total was about $2.30 trillion higher. This is a period comparison, not a claim that one policy or one event caused the full change.
latest = debt.dropna(subset=["tot_pub_debt_out_amt"]).iloc[-1]

latest_total = latest["tot_pub_debt_out_amt"]
latest_public = latest["debt_held_public_amt"]
latest_intragov = latest["intragov_hold_amt"]

public_share = latest_public / latest_total * 100
intragov_share = latest_intragov / latest_total * 100

print(f"Total debt: ${latest_total / 1e12:.2f} trillion")
print(f"Debt held by public: {public_share:.1f}%")
print(f"Intragovernmental: {intragov_share:.1f}%")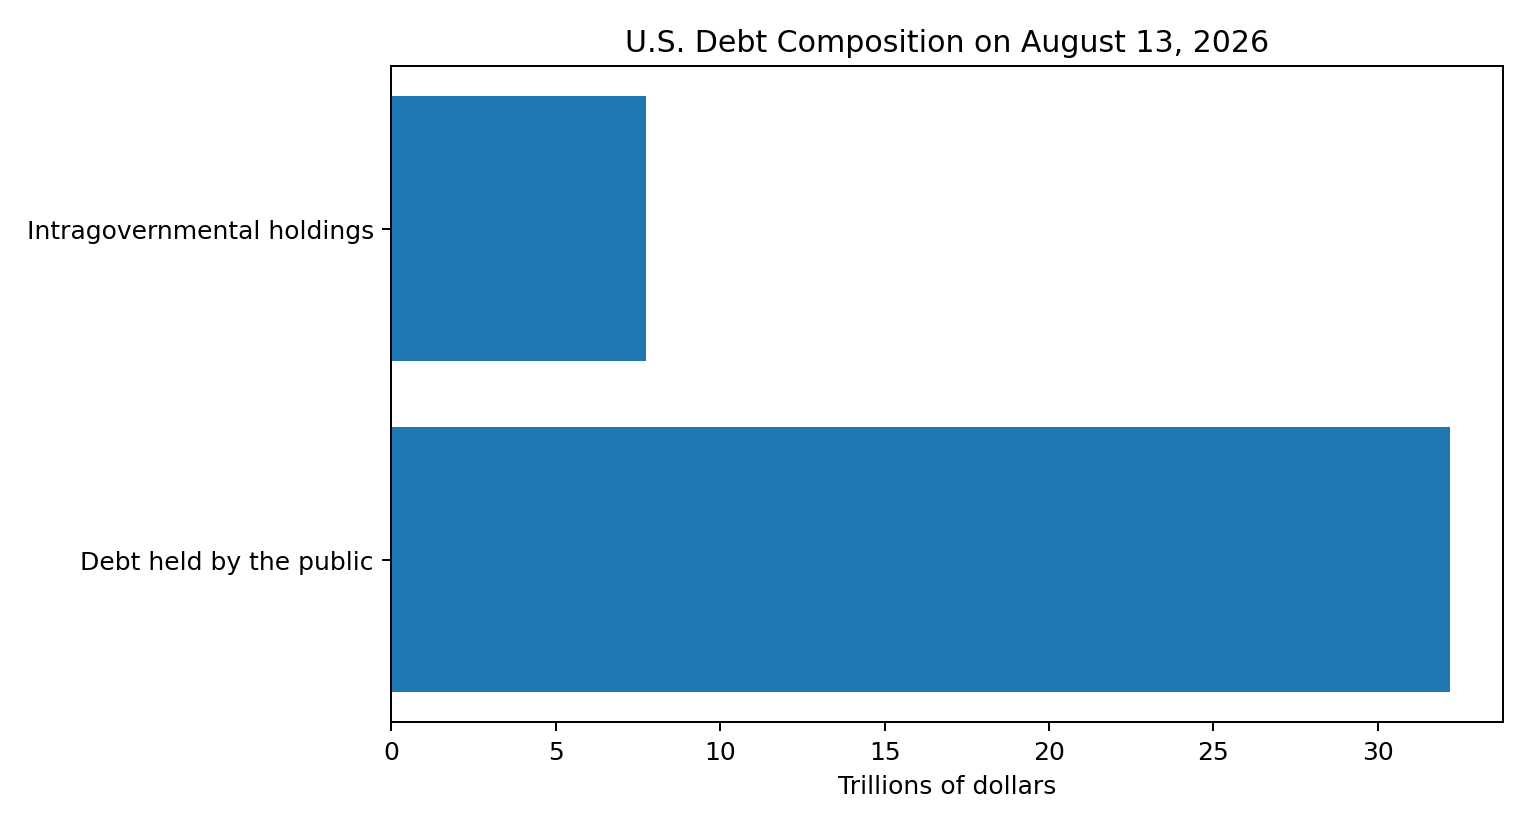
Download Monthly Treasury Statement Data
Debt data answers a point in time question. To study receipts, outlays, and the deficit, move to the Monthly Treasury Statement.
The summary table endpoint is v1/accounting/mts/mts_table_1. Treasury describes this table as a summary of receipts, outlays, and the budget surplus or deficit by month for the current and prior fiscal years. The MTS also has more detailed tables for receipts, outlays, financing, and other categories.
The exact field names can change as datasets evolve, so inspect the current data dictionary before you lock code into production. A strong tutorial should show readers how to inspect the response instead of hiding the structure.
mts = get_all_pages(
    "v1/accounting/mts/mts_table_1",
    params={
        "sort": "-record_date",
    },
    page_size=100,
)

print(mts.columns.tolist())
print(mts.head())
Calculate Receipts, Outlays, and the Federal Deficit
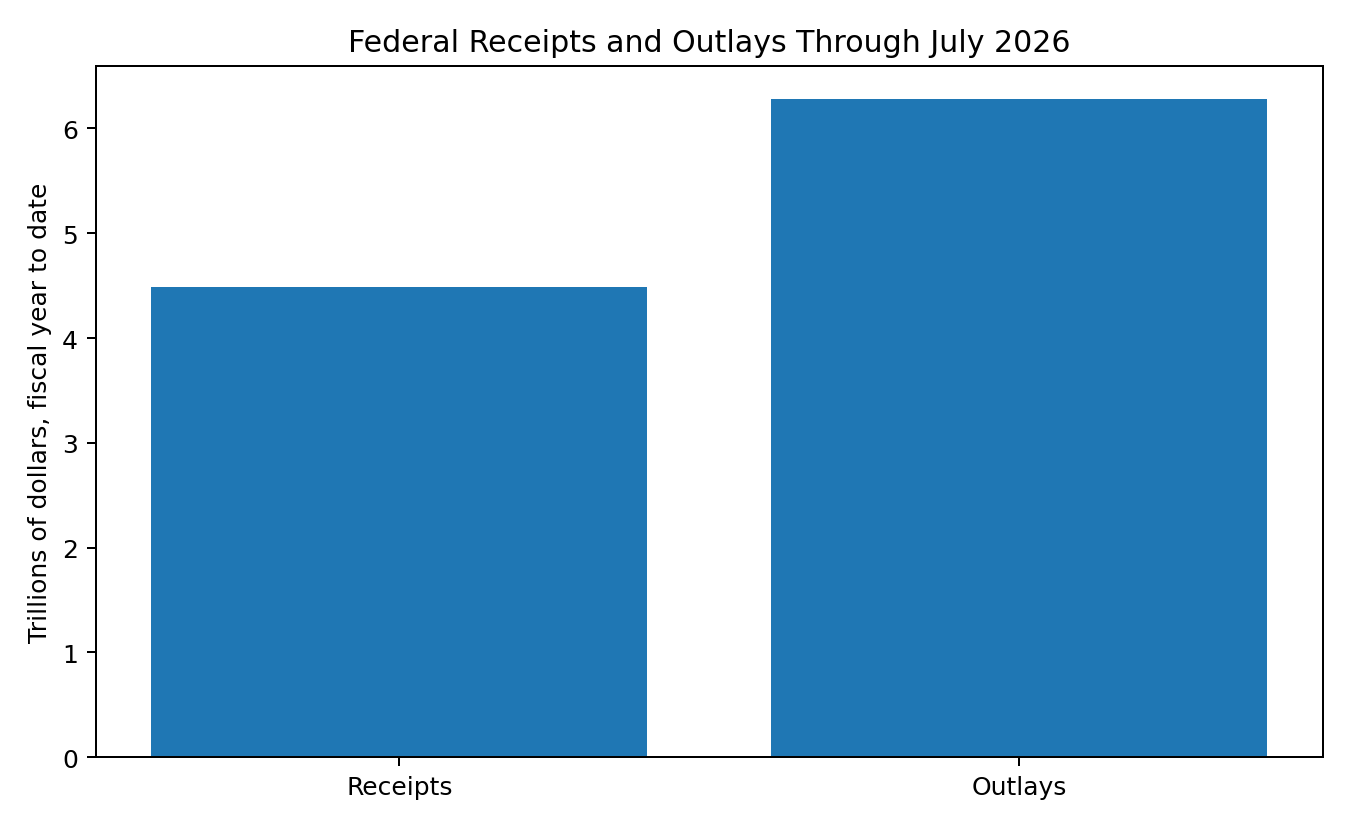
Through July 2026, Treasury reported about $4.49 trillion in fiscal year receipts and $6.28 trillion in outlays. The difference was a fiscal year to date deficit of about $1.80 trillion. Treasury also reported that the deficit for the same October through July period one year earlier was about $1.63 trillion, so the current fiscal year to date deficit was about $170 billion larger.
Do not add fiscal year to date rows across months. Each later fiscal year to date value already includes earlier months. If you want monthly flows, use monthly columns or a table that reports monthly receipts and outlays. If you want a fiscal year total, use the year end fiscal result or aggregate true monthly flows once.
# Simple fiscal balance formula when receipts and outlays
# are already for the same period and use the same units.

deficit = outlays - receipts

# Positive result here means outlays are greater than receipts.
print(deficit)
Build a Latest U.S. Fiscal Dashboard Table
A compact dashboard helps readers separate the daily debt snapshot from the fiscal year flow measures. The table below uses the latest periods verified for this article. Values are rounded for readability, while the API keeps the full reported precision.
| Metric | Latest value | Reference period | Treasury source |
|---|---|---|---|
| Total public debt outstanding | $39.93 trillion | August 13, 2026 | Debt to the Penny |
| Debt held by the public | $32.20 trillion | August 13, 2026 | Debt to the Penny |
| Intragovernmental holdings | $7.73 trillion | August 13, 2026 | Debt to the Penny |
| Fiscal year receipts | $4.49 trillion | Through July 2026 | Monthly Treasury Statement |
| Fiscal year outlays | $6.28 trillion | Through July 2026 | Monthly Treasury Statement |
| Fiscal year deficit | $1.80 trillion | Through July 2026 | Monthly Treasury Statement |
Plot U.S. Federal Debt Over Time
Historical Debt Outstanding is useful for a clean fiscal year view. Treasury reports total outstanding debt of about $26.95 trillion at the end of fiscal year 2020 and about $37.64 trillion at the end of fiscal year 2025. The line chart makes that change easy to see.
The chart is descriptive. It does not assign the increase to one president, Congress, tax change, spending program, recession, or emergency. Federal debt reflects many fiscal decisions and economic conditions over time.
history = get_all_pages(
    "v2/accounting/od/debt_outstanding",
    params={"sort": "record_date"},
)

history["record_date"] = pd.to_datetime(history["record_date"])
history["debt_outstanding_amt"] = pd.to_numeric(
    history["debt_outstanding_amt"],
    errors="coerce",
)

history["debt_trillions"] = history["debt_outstanding_amt"] / 1e12

ax = history.plot(
    x="record_date",
    y="debt_trillions",
    figsize=(10, 5),
    legend=False,
)
ax.set_title("U.S. Total Outstanding Debt at Fiscal Year End")
ax.set_xlabel("Fiscal year end")
ax.set_ylabel("Trillions of dollars")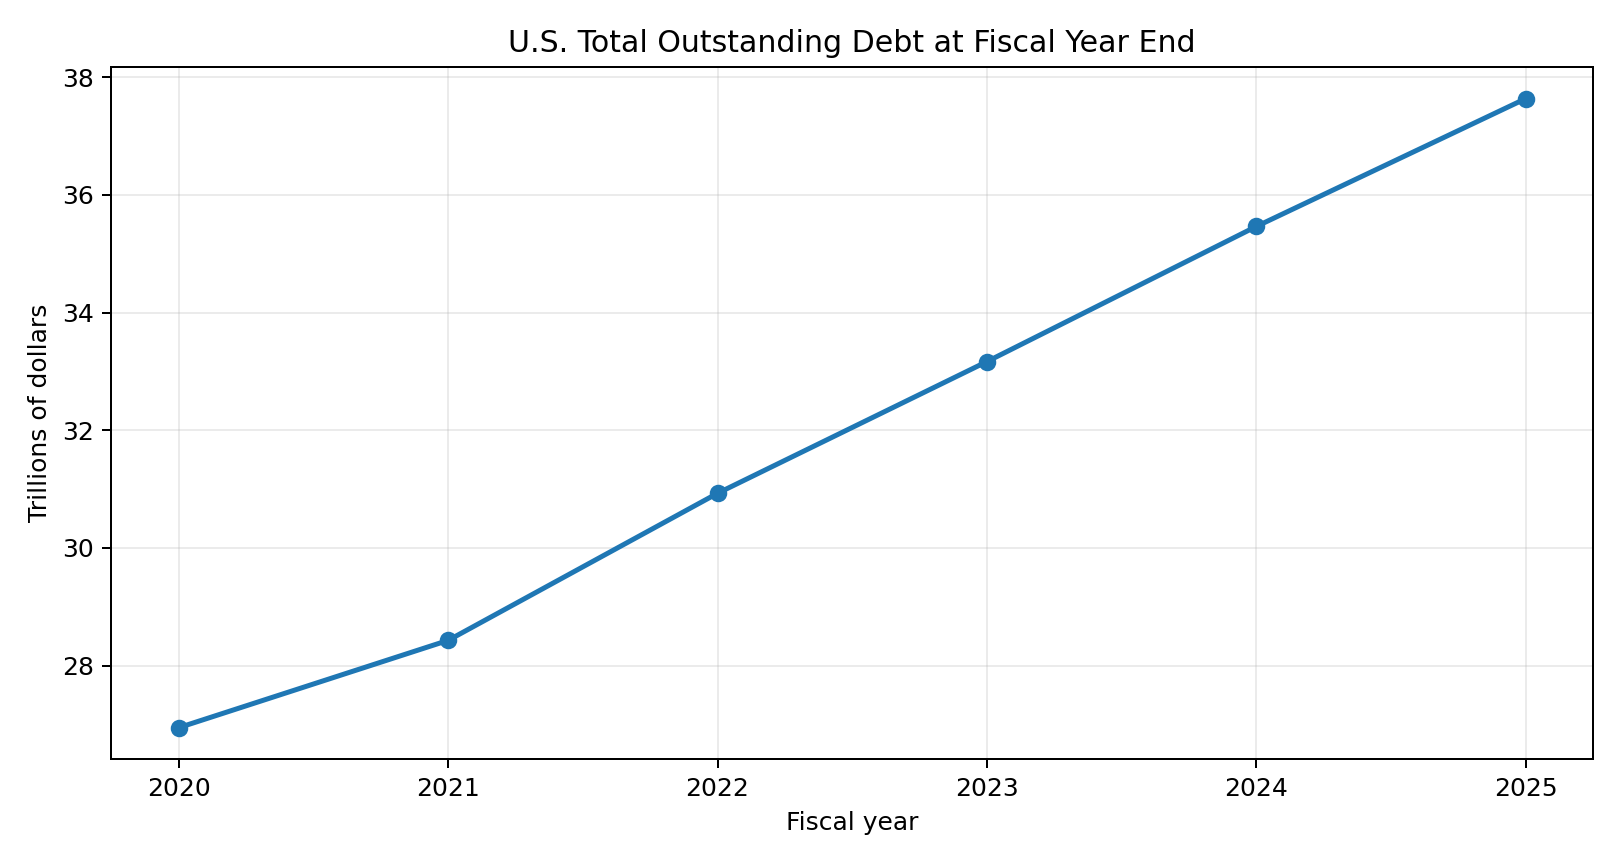
Compare Debt Held by the Public and Intragovernmental Holdings
The total debt line hides the two major components. Debt held by the public includes Treasury debt held outside the federal government. Intragovernmental holdings are mainly Treasury securities held by federal government accounts.
A component chart is useful because the two measures have different economic meanings. In the August 13, 2026 snapshot used here, debt held by the public was the larger component at about $32.20 trillion. Intragovernmental holdings were about $7.73 trillion.
Plot Federal Receipts, Outlays, and Deficits
Receipts and outlays should be compared over the same fiscal period. Through July 2026, outlays were about $6.28 trillion and receipts were about $4.49 trillion. That gap produced the roughly $1.80 trillion fiscal year to date deficit.
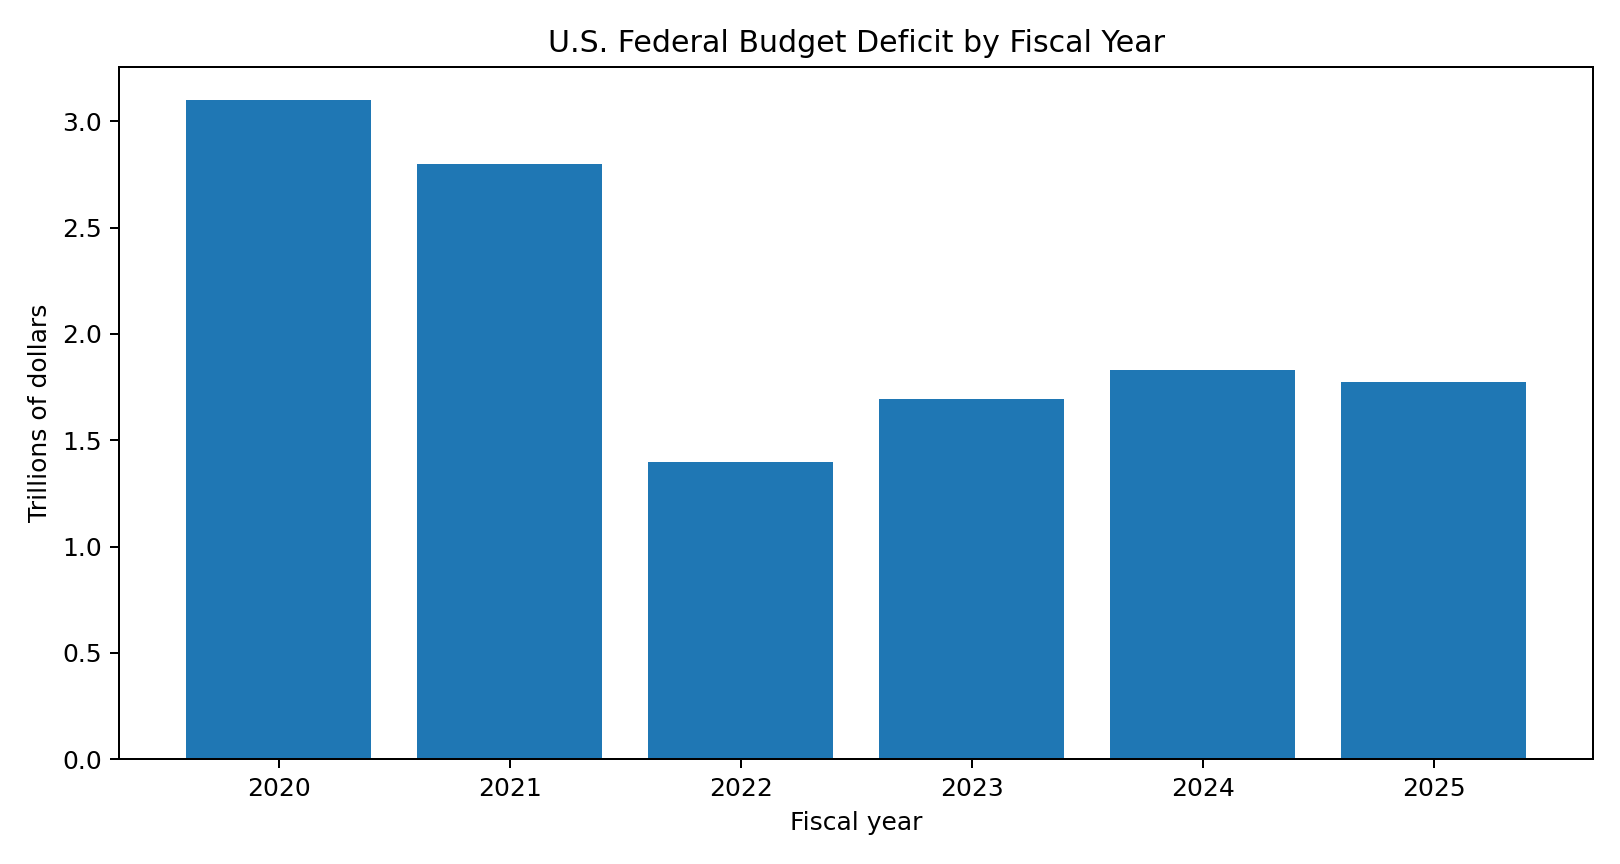
For a longer deficit trend, the annual federal budget deficit was about $3.1 trillion in fiscal year 2020, $2.8 trillion in 2021, $1.4 trillion in 2022, $1.70 trillion in 2023, $1.83 trillion in 2024, and $1.78 trillion in 2025. These are fiscal year measures, so they are directly more comparable with each other than the July 2026 year to date figure.
Animate U.S. Debt and Deficit History
Animation can help readers see the difference between debt and deficit over time. The recommended visual uses two panels. The left panel shows total outstanding debt at fiscal year end. The right panel shows the annual federal budget deficit.
The animation title is How U.S. Debt and the Federal Deficit Changed Over Time. Each frame reveals one additional fiscal year from 2020 through 2025. A Play button moves through the years, a Pause button stops the sequence, and a fiscal year slider lets the reader jump to a specific frame.
The two panels use separate scales. That matters because debt is a much larger stock measured in tens of trillions of dollars, while the deficit is an annual flow measured in trillions. Putting both on one shared scale would make the deficit look artificially small and would hide useful detail.
# After creating annual_debt and annual_deficit DataFrames,
# use Plotly frames to reveal one fiscal year at a time.
# Keep debt and deficit on separate subplot axes.

# The HTML version of this article includes a working example
# with Play, Pause, hover values, and a fiscal year slider.
Interactive fiscal history. Debt and deficit use separate panels and separate scales.
How to Interpret Debt and Deficit Data Carefully
The numbers are large, but a good analysis still starts with simple questions. What does the measure represent? What period does it cover? What are the units? Is it a daily stock, a monthly flow, or a fiscal year total?
The federal deficit is an important driver of borrowing, but Treasury explains that the change in debt does not always match the budget deficit one for one. Changes in cash balances and other financing activities can affect debt. This is why a chart should not present the annual deficit as the only source of every change in debt.
Political claims also need more care than a data tutorial can provide. A fiscal year can span two calendar years. Laws passed in earlier years can affect later receipts and outlays. Economic conditions can change tax collections and spending automatically. Keep the code tutorial neutral and let the official data answer the measurement questions first.
Common Treasury Fiscal Data API Errors and Fixes
The most common errors are easy to avoid once you know where they come from.
First, do not use the wrong dataset. Debt to the Penny is designed for daily debt, while the Monthly Treasury Statement is designed for budget flows. Second, do not mix fiscal year and calendar year dates without saying so. The federal fiscal year begins in October.
Third, handle pagination. A clean first page does not mean you have the full history. Fourth, convert numeric text fields before doing math. Fifth, check units. Some Treasury tables report dollars, while others use millions. Finally, never sum fiscal year to date rows across months because that double counts earlier activity.
Ideas for Extending the Analysis
Once the basic workflow works, you can extend it in several useful directions. Compare debt held by the public with GDP from another official source. Study Treasury interest expense. Break receipts into income taxes, payroll taxes, and other sources. Break outlays into major functions. Compare fiscal year deficits with changes in Treasury operating cash.
You can also schedule a monthly refresh. Debt to the Penny changes much more often, but a broad article about deficits only needs a major update when a new Monthly Treasury Statement changes the fiscal year picture.
Conclusion
The US Treasury Fiscal Data API gives Python users a direct path from official federal finance records to a reproducible analysis. Use Debt to the Penny when you need a daily debt snapshot. Use the Monthly Treasury Statement when you need receipts, outlays, and the budget deficit. Use Historical Debt Outstanding when you want a clean fiscal year debt trend.
The most useful habit is to keep stock and flow measures separate. Debt belongs to a date. A deficit belongs to a period. Once that foundation is clear, pandas, matplotlib, and Plotly can turn Treasury data into tables and visuals that are easy to update and easy to explain.
Frequently Asked Questions
How do I use the U.S. Treasury Fiscal Data API in Python?
Use requests to call an official Fiscal Data endpoint, pass fields and filters as query parameters, check the HTTP response, then load the JSON data array into pandas. Convert dates and numeric values before calculating or plotting the results.
Does the Treasury Fiscal Data API require an API key?
The public examples in this tutorial call the Fiscal Data endpoints without embedding a private credential. Check the current official API documentation before production use because access rules and platform features can change.
What is the Debt to the Penny API?
Debt to the Penny is Treasury's daily dataset for total public debt outstanding. It includes debt held by the public and intragovernmental holdings.
How do I get federal deficit data from Treasury?
Use the Monthly Treasury Statement dataset. Its summary and detailed tables report receipts, outlays, and budget surplus or deficit measures for current and prior fiscal periods.
What is the difference between federal debt and the deficit?
Debt is an amount outstanding at a point in time. A deficit is the amount by which outlays exceed receipts during a period. Deficits often lead to more borrowing, but changes in debt can also reflect other financing and cash activities.
How do I handle pagination with the Treasury API?
Read the metadata in each response, including the total pages value. Request the next page until the current page reaches the total page count, then combine the data rows in pandas.
How often is Debt to the Penny updated?
Treasury describes Debt to the Penny as a daily dataset and the federal data catalog says it is updated each business day with data from the previous business day. Always check the dataset page for the latest release status.
Methodology Note
Primary data source: U.S. Department of the Treasury, Bureau of the Fiscal Service. Debt snapshot date: August 13, 2026. Fiscal flow period: fiscal year 2026 through July. Historical debt chart period: fiscal years 2020 through 2025. Data access and verification date: August 19, 2026. Values shown in trillions are rounded for readability. Economic and fiscal data may be updated or revised.
Official Sources
Downloads
Files attached to this article for your reference.