
Welch ANOVA: When to Use It and How It Works
Welch ANOVA compares the means of independent groups when equal variances cannot be assumed. Learn when to use it, how it differs from standard one-way ANOVA, how to check assumptions, run the test in R, Python, SPSS, Minitab, and SAS, interpret the results, and choose an appropriate post-hoc test such as Games-Howell.
Welch ANOVA: When and How to Use It
Welch ANOVA compares the means of independent groups without requiring those groups to have the same population variance. It is especially useful when group variances differ, and the case for using it becomes stronger when unequal variances are combined with unequal sample sizes.
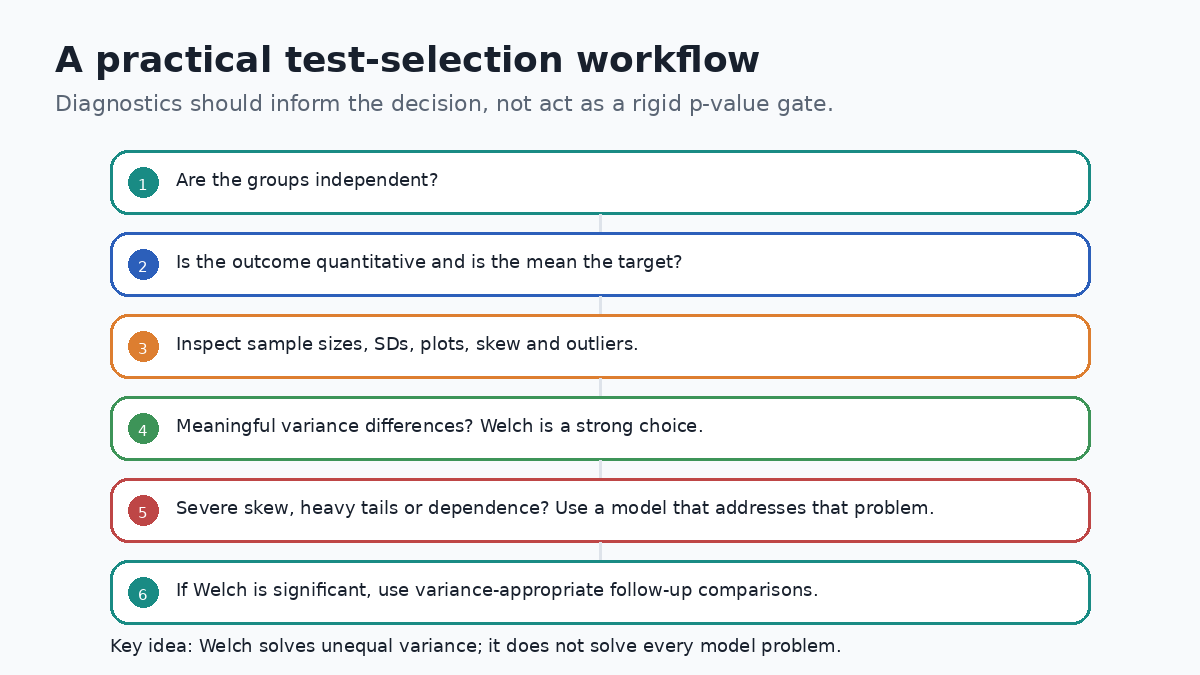
The practical decision is not simply whether Levene's test crosses a p-value threshold. A sound analysis starts with the study design and research question, then considers group sizes, variance patterns, distribution shape, and influential observations. Welch ANOVA solves the unequal-variance problem, but it does not solve dependence, extreme outliers, or every form of non-normality.
What Is Welch ANOVA?
Welch ANOVA in simple terms
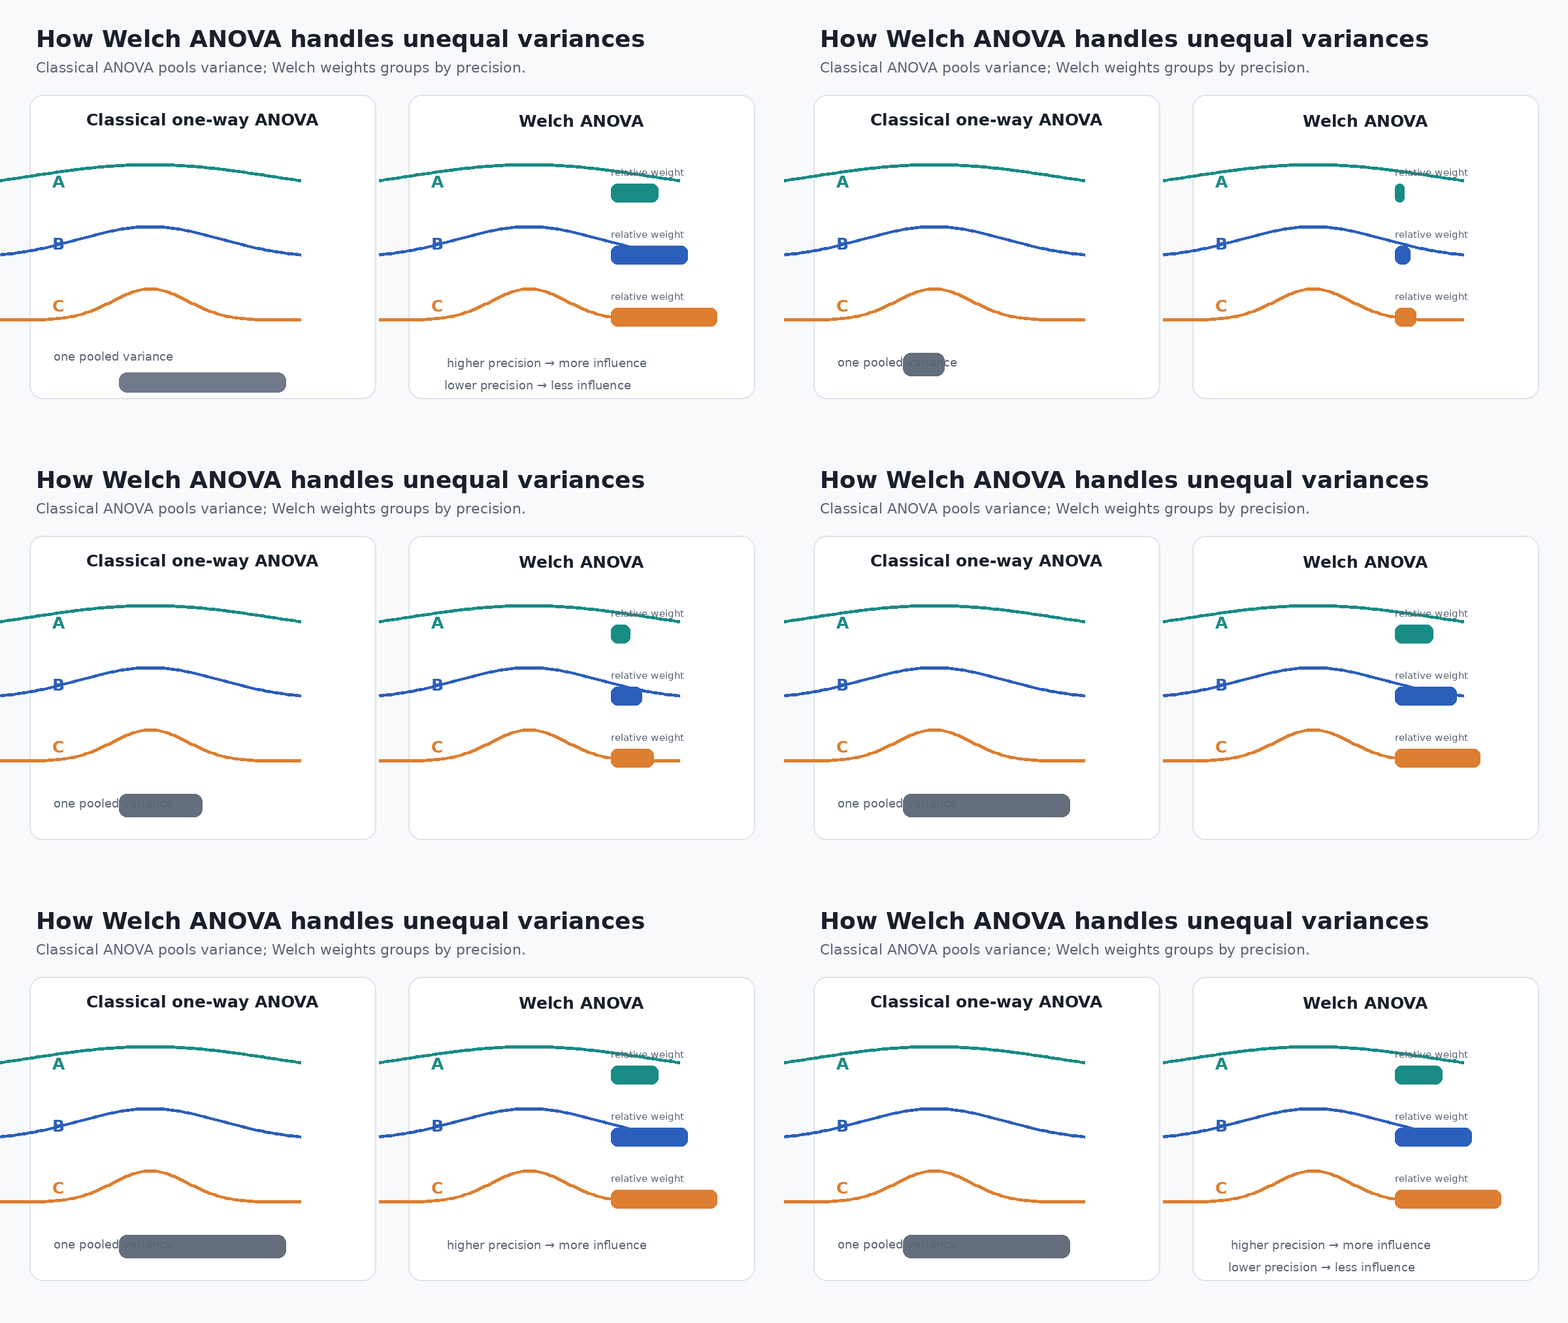
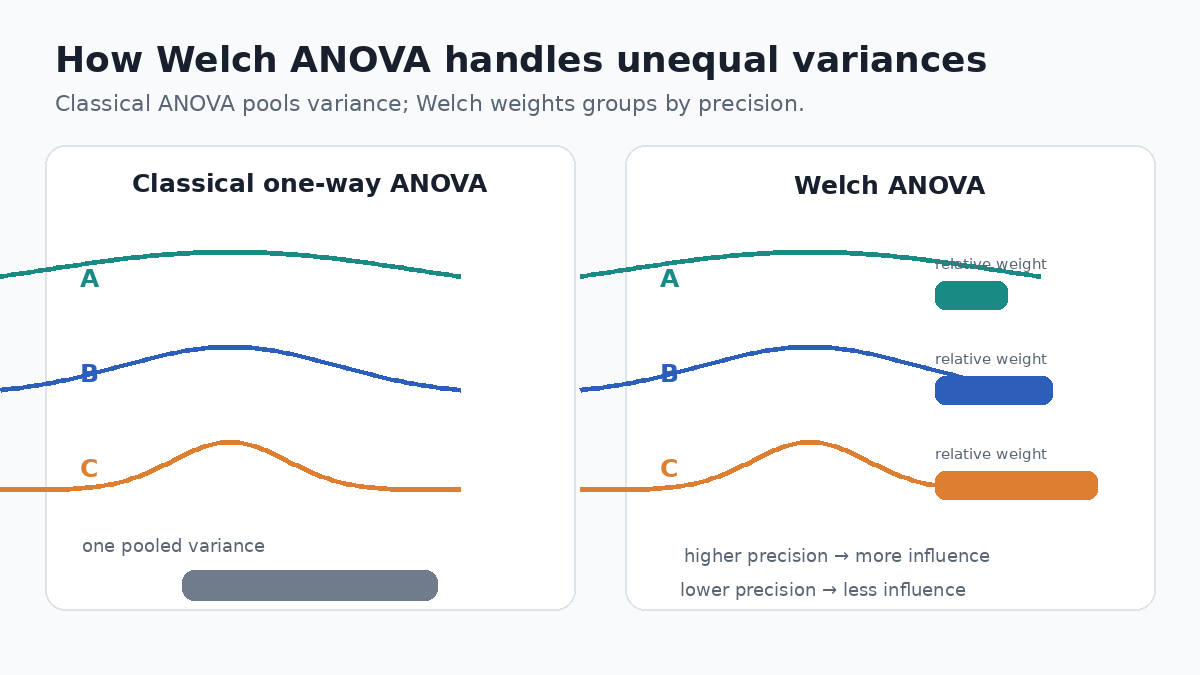
Suppose you want to compare average test scores across three teaching methods. One group has tightly clustered scores, another is much more variable, and the groups are not the same size. A classical one-way ANOVA normally works with a pooled within-group variance. Welch ANOVA instead allows each group to retain its own variance estimate and gives more influence to groups whose means are estimated more precisely.
B. L. Welch published the several-means procedure in 1951 as an alternative approach for comparing means when the equal-variance framework is not appropriate (Welch, 1951).
What question does Welch ANOVA answer?
The null hypothesis is that all population means are equal. The alternative is that at least one population mean differs. A significant omnibus result therefore tells you that a difference exists somewhere among the groups. It does not tell you which specific groups differ.
How Welch ANOVA differs from standard one-way ANOVA
The central difference is the treatment of within-group variability. Classical one-way ANOVA assumes a common population variance and pools within-group variation. Welch ANOVA does not impose that common-variance assumption.
Conceptually, each group receives a weight related to w = n / s², where n is the group's sample size and s² is its sample variance. Larger samples increase precision, while larger variances reduce it. Welch then adjusts the test statistic and denominator degrees of freedom to reflect that unequal precision.
Why Does Welch ANOVA Matter?
The problem with unequal variances
Equal population variance is called homoscedasticity; unequal variance is called heteroscedasticity. Sample standard deviations will rarely be exactly identical, so the issue is not whether the observed SDs differ at all. The issue is whether the variance pattern is large enough, in the context of the sample sizes and distributions, to make a pooled-variance analysis unreliable.
When variances differ substantially, the classical F test can become too liberal or too conservative depending on how the variance pattern aligns with the group sizes. Simulation research has found Welch's procedure to be more reliable across many realistic heteroscedastic conditions and has supported its use more broadly than a strict fallback strategy (Delacre et al., 2019).
Why unequal sample sizes can make the problem worse
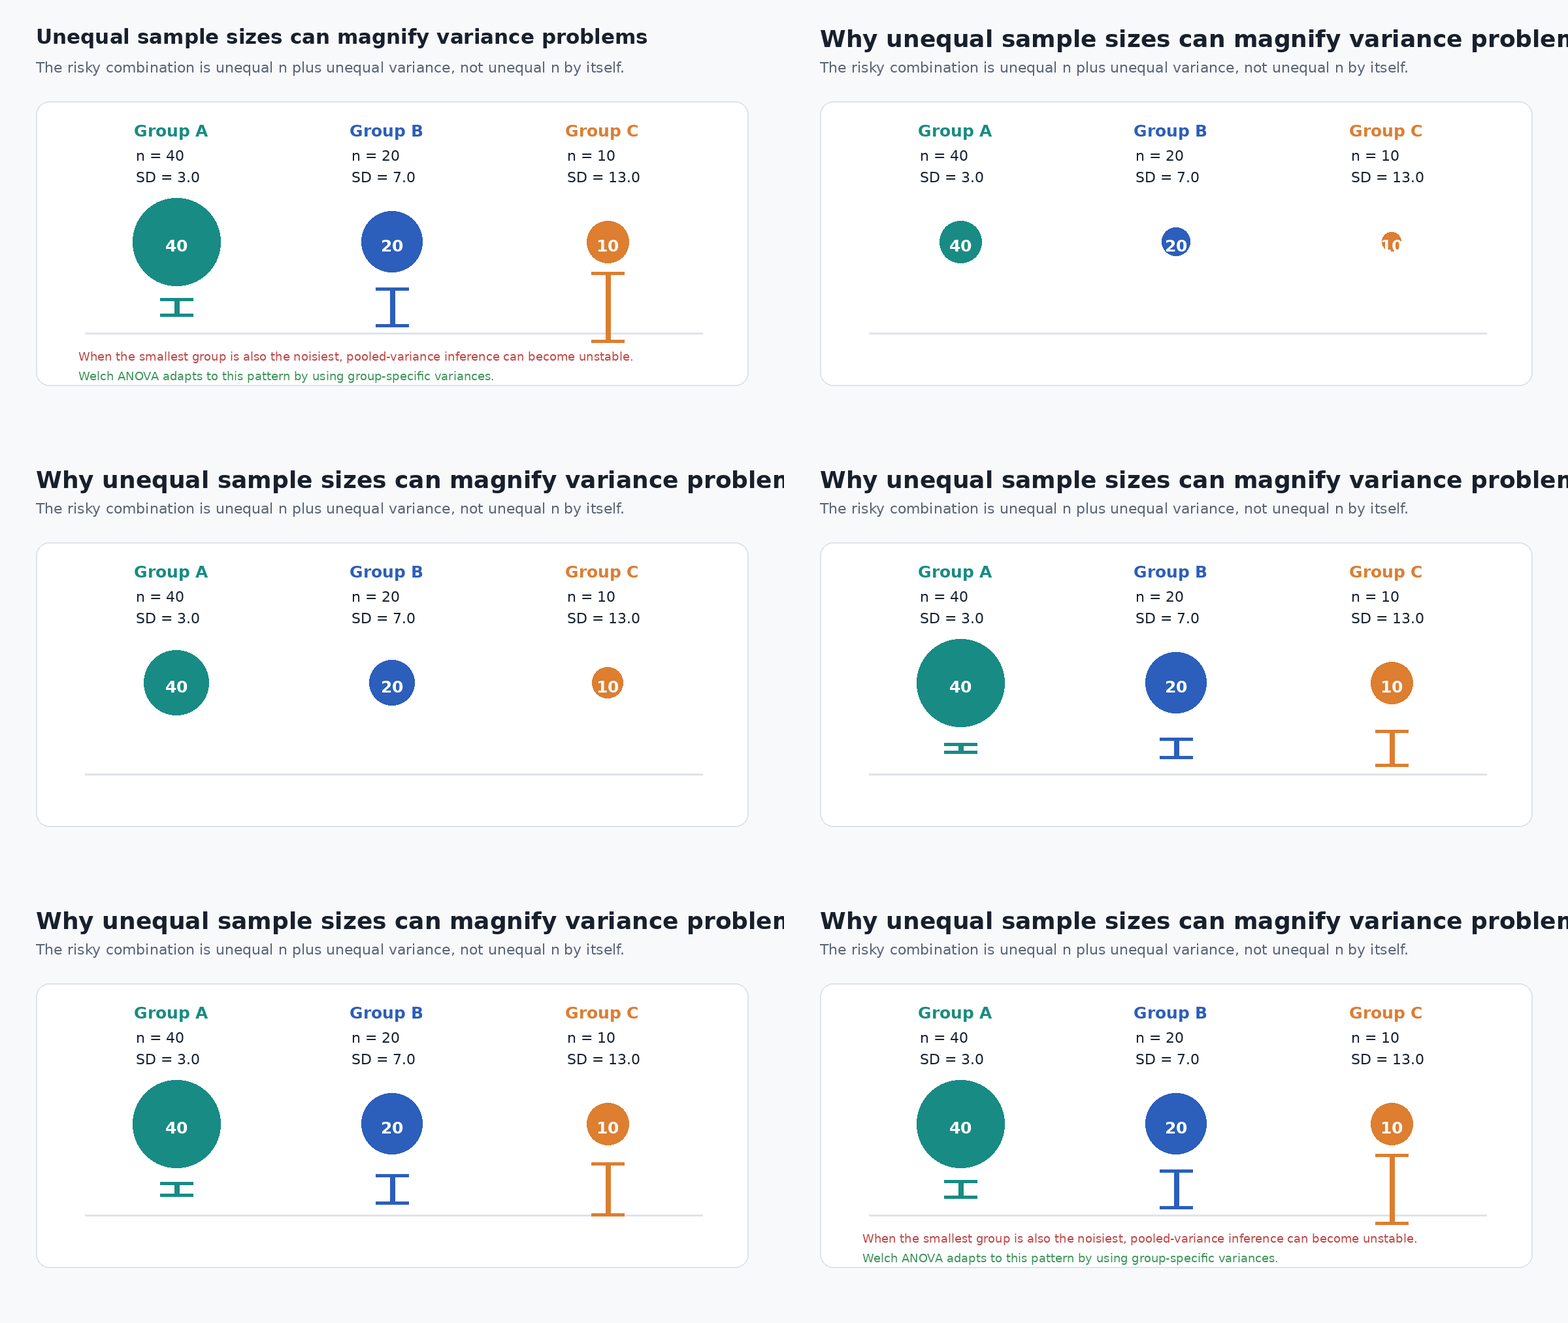
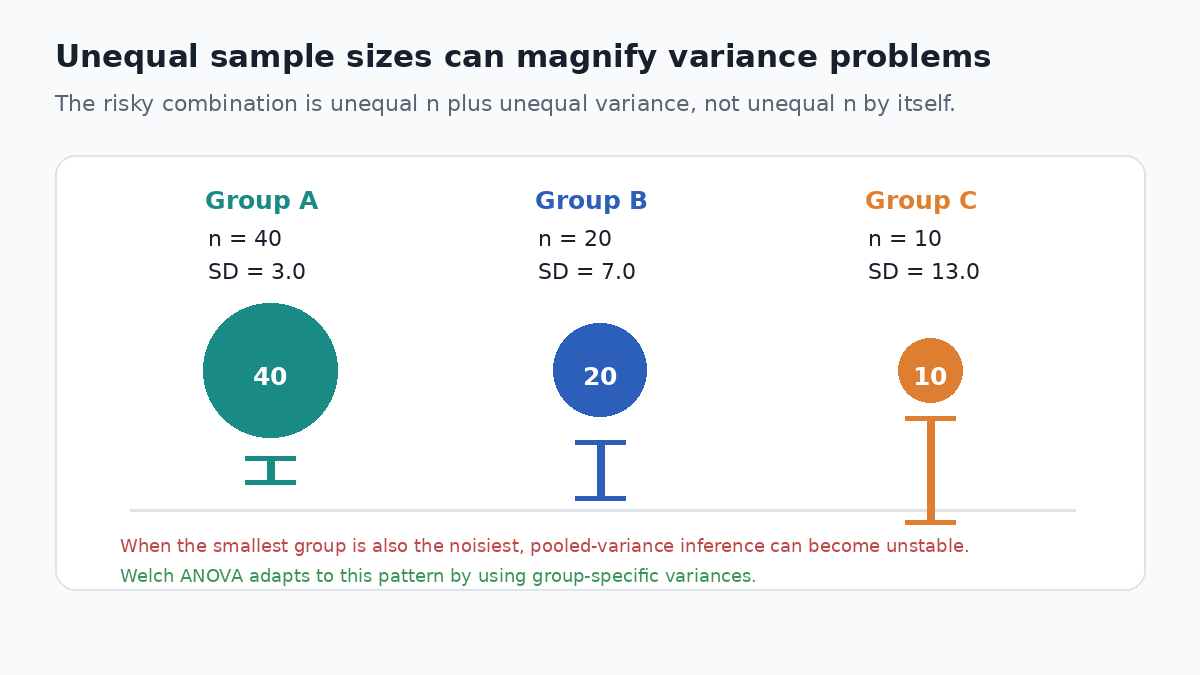
Unequal sample sizes alone do not automatically require Welch ANOVA. The more consequential situation is unequal sample size combined with unequal variance. For example, a very small group with a very large variance contributes a different level of information from a large, stable group. Treating those groups as though they share a single common variance can distort inference.
When Should You Use Welch ANOVA?
Welch ANOVA is a strong choice when the research question concerns differences in population means across independent groups and equal population variances are doubtful or implausible. In most teaching contexts it is discussed for three or more groups. With exactly two independent groups, the corresponding procedure is conventionally reported as Welch's t-test; R's documentation describes the two-sample case as the special case of the general Welch one-way procedure (R documentation).
The outcome should normally be quantitative and meaningful to analyze through group means. The groups must also be independent. Repeated observations from the same participant, longitudinal measurements, or data clustered within schools, hospitals, households, or other units require a model that accounts for that dependence. Welch's correction cannot repair a design that has been modeled as independent when it is not.
What Are the Assumptions of Welch ANOVA?
Independence is a design requirement
Independence is the highest-priority assumption because it comes from how the data were collected. A normality test or variance test cannot establish independence after the fact. If observations are paired, repeated, nested, or clustered, consider repeated-measures methods, mixed models, generalized estimating equations, or another method appropriate to the design.
The outcome should support a mean comparison
Welch ANOVA is built around means. That makes it natural for measurements such as scores, reaction times, blood pressure, yield, income, or other quantitative outcomes. If the variable is ordinal with only a few categories, or if the mean is not a scientifically meaningful summary, another analysis may better match the research question.
Approximate normality still matters, but not as a binary gate
The theoretical procedure is parametric and is commonly described under normal-population assumptions. In applied work, small departures from normality do not automatically invalidate an ANOVA-style analysis. More serious concerns are strong skew, heavy tails, very small groups, and influential outliers. Q-Q plots are useful because they show the pattern of departure rather than reducing distribution shape to one significance test (NIST normal probability plot guidance).
Current statsmodels documentation also notes that Welch ANOVA can become liberal when data are strongly skewed and provides trimmed variants for more robust analysis in such settings (statsmodels documentation). The practical lesson is simple: Welch corrects heteroscedasticity, not every possible distributional problem.
Outliers still matter
An extreme observation can materially change a group's mean and variance. Do not delete an observation simply because it looks unusual. First determine whether it is a data error, a legitimate extreme value, or evidence that the model does not describe the data well. Sensitivity analysis can be useful when one or two observations strongly influence the conclusion.
How Do You Check for Unequal Variances?
Start with group summaries and plots
Compare each group's sample size, mean, SD or variance, and distribution. Boxplots can show spread and unusual values, while raw-data or density plots provide more detail when sample sizes allow. The goal is not to obtain a single pass/fail result. It is to understand the pattern that the inferential method must handle.
How to interpret Levene's test
Levene's test evaluates the null hypothesis that the population variances are equal. A small p-value provides evidence against equal variances. A non-significant p-value does not prove that the variances are equal, particularly when samples are too small for the test to detect moderate differences.
NIST describes Levene's test as less sensitive to departures from normality than Bartlett's test and discusses median- and trimmed-mean-centered variants (NIST Levene guidance).
Brown-Forsythe and the terminology trap
The phrase Brown-Forsythe test is used for related but distinct procedures. In variance diagnostics, it often refers to the median-centered modification of Levene's test. In heteroscedastic mean comparison, Brown-Forsythe can also refer to a robust alternative procedure for testing equality of means. The article or software output should make clear which use is intended.
Why Levene's test should not be a strict switch
A common teaching rule is: if Levene is significant, use Welch; otherwise use classical ANOVA. That is easy to remember but incomplete. A Levene p-value of .049 and one of .051 do not describe fundamentally different variance structures. The underlying variance pattern is continuous even though the decision threshold is not.
A more defensible workflow is to choose the inferential method based on the design, research target, variance pattern, and robustness you need, while using Levene-type tests and plots to understand the data. Simulation evidence has specifically challenged making Welch conditional on a preliminary variance test (Delacre et al., 2019).
How Does Welch ANOVA Work?
Classical ANOVA estimates a common within-group variance. Welch instead uses group-specific variance information. Groups with more precise mean estimates receive greater weight, and groups with less precise estimates receive less.
The procedure then adjusts the F-type statistic and uses a Welch-Satterthwaite approximation for the denominator degrees of freedom. That is why software may report a result such as F(2, 22.99) = 5.93. Fractional denominator degrees of freedom are expected and are not a software error.
Welch ANOVA vs One-Way ANOVA: Which Should You Use?
| Situation | More defensible starting point | Why |
|---|---|---|
| Independent groups, variances reasonably similar | Classical one-way ANOVA or Welch ANOVA | Pooling is efficient when the common-variance model is credible; Welch remains a reasonable robust choice. |
| Meaningfully unequal variances | Welch ANOVA | It does not impose one pooled population variance. |
| Unequal sample sizes but similar variances | Classical ANOVA can still be appropriate | Unequal n alone is not the defining heteroscedasticity problem. |
| Unequal variances plus unequal sample sizes | Welch ANOVA is generally preferable | The interaction can distort the classical F test. |
| Strong skew, heavy tails, or highly influential outliers | Investigate robust or trimmed methods | Welch does not automatically solve severe distributional problems. |
| Repeated, paired, or clustered observations | Use a dependence-aware model | Neither simple one-way ANOVA nor Welch ANOVA models within-unit dependence. |
Should Welch ANOVA be the default?
There is a defensible research-supported argument for using Welch routinely rather than reserving it for datasets that first fail a variance test. Delacre and colleagues found strong performance for Welch across realistic variance violations and recommended it as a default procedure for comparing independent means (Delacre et al., 2019).
That recommendation is not a universal law. Classical ANOVA remains efficient when its assumptions are appropriate. The useful change in perspective is that Welch is not an inferior emergency substitute. It is a legitimate primary method when you do not want to impose a common population variance.
Welch ANOVA vs Kruskal-Wallis: What's the Difference?
Kruskal-Wallis is often described as the automatic alternative whenever ANOVA data are non-normal. That shortcut can be misleading. Welch ANOVA targets differences in means while allowing unequal variances. Kruskal-Wallis works with ranks and addresses a different distributional hypothesis.
When group distributions differ in spread or shape, a significant Kruskal-Wallis result cannot automatically be interpreted as a median difference. Research examining heteroscedastic group comparisons has specifically warned against using Kruskal-Wallis simply as a fix for unequal variances (review and simulation evidence).
| Research situation | Method to consider |
|---|---|
| The mean is the target and variances are similar | Classical one-way ANOVA |
| The mean is the target and variances differ | Welch ANOVA |
| The mean is still the target, but severe skew or heavy tails make ordinary mean inference fragile | Robust or trimmed-mean methods |
| Rank or distribution differences are the intended target and assumptions fit | Kruskal-Wallis or another rank-based method |
| The outcome is ordinal and mean comparison is not meaningful | An ordinal or rank-based method matched to the design |
How to Run Welch ANOVA Step by Step
Check the study design first
Confirm that the groups are independent and that a mean comparison answers the scientific question. This comes before normality or variance testing because a design mismatch is more fundamental than a distributional diagnostic.
Inspect the data
Review group n, means, SDs, boxplots, and Q-Q plots. Pay particular attention to a pattern in which a small group is also much more variable than the others, because this is one of the settings where a pooled-variance analysis can be especially vulnerable.
Assess variance and distribution concerns
Use Levene or median-centered Brown-Forsythe when a formal variance diagnostic is useful, but interpret it alongside the actual SDs and plots. If the data are severely skewed or heavy-tailed, investigate robust approaches rather than assuming Welch is enough.
Run the Welch omnibus test
The output normally reports an F-type statistic, numerator degrees of freedom, adjusted denominator degrees of freedom, and p-value. If the p-value is below your pre-specified significance level, the data provide evidence that the population means are not all equal.
Follow the omnibus result with comparisons that answer the research question
If every pair of groups is scientifically relevant, Games-Howell is a common heteroscedastic post-hoc procedure. If the study was designed around only a few planned contrasts, those targeted comparisons may be more informative than testing every possible pair.
How to Run Welch ANOVA in R, Python, SPSS, Minitab, and SAS
R
Base R provides Welch directly through oneway.test(), and var.equal = FALSE is the default (R documentation).
oneway.test(score ~ group, data = my_data, var.equal = FALSE)Python with SciPy
Older tutorials often say that scipy.stats.f_oneway() cannot run Welch ANOVA. That advice is now outdated. Current SciPy supports Welch directly with equal_var=False; the parameter was added in SciPy 1.16.0 (SciPy f_oneway documentation).
from scipy.stats import f_oneway

result = f_oneway(group_a, group_b, group_c, equal_var=False)
print(result.statistic, result.pvalue)
Current SciPy also performs Games-Howell pairwise comparisons when tukey_hsd(..., equal_var=False) is used (SciPy tukey_hsd documentation).
from scipy.stats import tukey_hsd

posthoc = tukey_hsd(group_a, group_b, group_c, equal_var=False)
print(posthoc)
statsmodels is another useful Python option. Its one-way implementation supports classical, Welch, Brown-Forsythe, and trimmed variants, with unequal variance as the current default (statsmodels documentation).
SPSS
In IBM SPSS Statistics, open Analyze > Compare Means > One-Way ANOVA and request the Welch robust test. IBM's documentation also lists Games-Howell among post-hoc procedures that do not assume equal variances (IBM SPSS documentation).
Minitab
In Minitab, use Stat > ANOVA > One-Way > Options and clear Assume equal variances to request the unequal-variance procedure (Minitab documentation).
SAS
SAS supports Welch for one-way models through the WELCH option in the MEANS statement (SAS documentation).
proc glm data=my_data;
   class group;
   model score = group;
   means group / welch;
run;
How Do You Interpret Welch ANOVA Results?
Suppose the output is F(2, 22.99) = 5.93, p = .008. Because the p-value is below .05, the data provide evidence against the null hypothesis that all population means are equal. The correct conclusion is that at least one mean differs.
The result does not mean every group differs from every other group. It also does not tell you which group pairs differ, which is why post-hoc comparisons or planned contrasts are needed when those questions matter.
A non-significant result also needs careful wording. If p >= .05, the analysis has not provided sufficient evidence to reject the equal-means null hypothesis at that threshold. That is not proof that the means are equivalent. Demonstrating equivalence requires an equivalence design with a meaningful equivalence margin.
What Post-Hoc Test Should You Use After Welch ANOVA?
Games-Howell is usually the most straightforward all-pairs companion because it allows unequal variances and unequal sample sizes. Current SciPy explicitly switches to Games-Howell when equal_var=False in its pairwise function (SciPy Games-Howell implementation).
Games-Howell is not mandatory in every study. If the only scientific question is whether each treatment differs from a control, or if a small number of contrasts were specified in advance, a targeted unequal-variance comparison strategy may be preferable to testing every pair.
The governing principle is consistency: if unequal variance motivated the omnibus method, the follow-up method should not quietly reintroduce a pooled-variance assumption without justification.
Practical Welch ANOVA Example
Consider a synthetic teaching example with three independent groups. The data were constructed only for illustration; they are not observations from a real study.
| Group | n | Mean | SD |
|---|---|---|---|
| A | 18 | 69.82 | 2.84 |
| B | 24 | 73.04 | 6.65 |
| C | 12 | 79.14 | 10.66 |
The group SDs and sample sizes are clearly different. Group C is both the smallest and the most variable. A classical one-way ANOVA for these illustrative data gives approximately F(2, 51) = 6.67, p = .0027. Welch ANOVA gives F(2, 22.99) = 5.93, p = .0084.
Both methods happen to cross the .05 threshold here, but they do not quantify uncertainty in the same way. Welch uses the unequal group variances rather than treating the within-group variation as one common population variance.
| Games-Howell comparison | Mean difference | Adjusted p | 95% CI |
|---|---|---|---|
| A vs B | -3.22 | .100 | [-6.93, 0.49] |
| A vs C | -9.32 | .030 | [-17.72, -0.92] |
| B vs C | -6.10 | .198 | [-14.81, 2.61] |
The omnibus result says that a difference exists somewhere. Games-Howell then identifies A versus C as the clearest pairwise difference at the .05 level in this example. The other comparisons are not statistically significant.
How to Report Welch ANOVA in APA Style
A useful report includes the group descriptive statistics, Welch F statistic, both degrees of freedom, p-value, and the relevant follow-up comparisons. Confidence intervals help communicate the uncertainty around pairwise differences.
Example: Welch's ANOVA indicated that mean scores differed across the three groups, F(2, 22.99) = 5.93, p = .008. Games-Howell comparisons indicated that Group C (M = 79.14, SD = 10.66) scored higher than Group A (M = 69.82, SD = 2.84), mean difference = 9.32, 95% CI [0.92, 17.72], p = .030. The remaining pairwise comparisons were not statistically significant.
Effect-size reporting under heteroscedasticity requires more care than simply copying a formula from classical ANOVA. Report the group means, SDs, n values, and confidence intervals at minimum. If you use a standardized effect size, name the estimator and make clear how unequal variances were handled.
Common Mistakes When Using Welch ANOVA
Treating Levene's test as a pass/fail gate
Use Levene or Brown-Forsythe to understand variance structure, not as the only permission switch for the inferential method. Welch can be chosen in advance because unequal variances are plausible or because a heteroscedastic analysis is preferred.
Switching automatically to Kruskal-Wallis
Unequal variance does not make Kruskal-Wallis an automatic remedy. Decide first whether the research target is a mean difference, a rank/distribution difference, or something else. Severe skew may call for a robust method, but the word “non-normal” is not enough to select a test.
Using standard Tukey HSD after Welch
Standard Tukey HSD belongs to an equal-variance framework. When unequal variance matters, Games-Howell or another variance-appropriate follow-up is usually more coherent.
Ignoring outliers or dependence
Welch does not protect a study from data errors, highly influential observations, repeated measurements treated as independent, or clustering that the model ignores.
Confusing unequal n with unequal variance
Groups can have unequal n and similar variances, or equal n and very different variances. Welch's defining feature is that it does not require a common population variance.
Welch ANOVA Frequently Asked Questions
Can Welch ANOVA be used for two groups?
Yes mathematically, but the conventional two-group procedure is Welch's t-test. Welch ANOVA is the natural extension to several independent groups.
Does Welch ANOVA require equal sample sizes?
No. Unequal sample sizes are allowed. The important issue is that sample-size imbalance can interact with unequal variances, which is one reason Welch is valuable.
Does Welch ANOVA require normal data?
It is a parametric procedure and normal-population assumptions underlie the standard derivation. Minor departures are not automatically fatal, but strong skew, heavy tails, small groups, and influential outliers deserve additional attention.
Can I use Welch ANOVA when Levene's test is not significant?
Yes. A significant Levene result is not a prerequisite. A non-significant Levene result also does not prove equal variances.
Is Welch ANOVA always more powerful than standard ANOVA?
No. Neither method is uniformly most powerful in every possible condition. Classical ANOVA gains efficiency when the common-variance model is genuinely appropriate. Welch is attractive because it often gives up little under similar variances while being more reliable under important heteroscedastic patterns.
What is the best post-hoc test after Welch ANOVA?
Games-Howell is a common choice for all pairwise comparisons. Planned unequal-variance contrasts may be better when only specific comparisons answer the research question.
Is Welch ANOVA nonparametric?
No. It is a parametric method for comparing population means without assuming equal population variances.
Can Welch ANOVA handle outliers?
Not specifically. Outliers can still affect both the mean and variance. Inspect unusual observations and consider robust methods when they materially influence the conclusion.
Welch ANOVA Quick Decision Guide
| Question | Practical answer |
|---|---|
| Comparing means of independent groups? | Welch ANOVA may be appropriate. |
| Exactly two independent groups? | Usually report Welch's t-test. |
| Variances meaningfully unequal? | Welch is usually preferable to pooled one-way ANOVA. |
| Sample sizes unequal? | Welch accommodates this, but unequal n alone does not prove Welch is necessary. |
| Levene p < .05? | This supports heteroscedasticity, but inspect the actual variance pattern too. |
| Levene p >= .05? | This does not prove equal variances and does not prohibit Welch. |
| Strong skew or influential outliers? | Investigate robust methods rather than assuming Welch solves everything. |
| Repeated or clustered observations? | Use a model that accounts for dependence. |
| Significant Welch result? | Use scientifically relevant, variance-appropriate follow-up comparisons. |
Conclusion
Welch ANOVA is best understood as a general method for comparing independent group means without forcing those groups to share one population variance. It is especially useful when variances differ and when that heteroscedasticity is combined with unequal sample sizes.
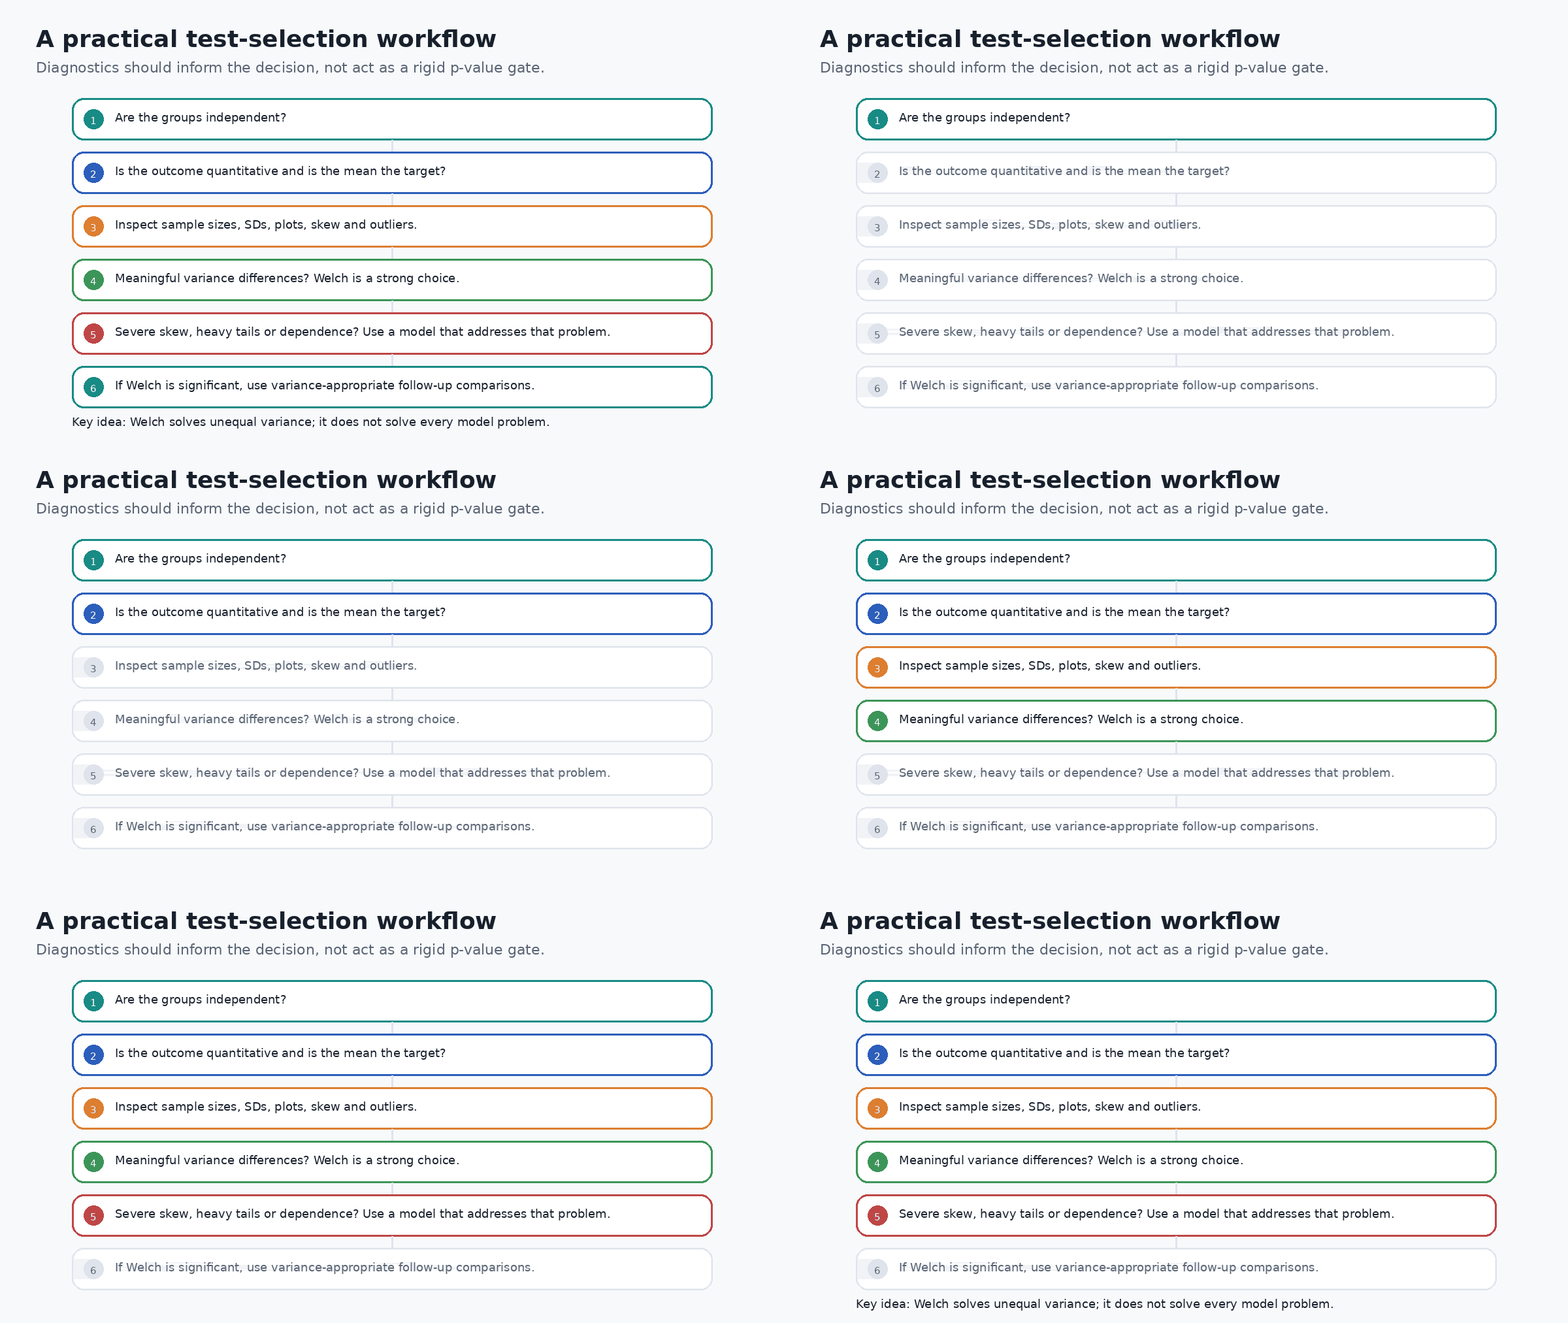
The most important practical insight is to avoid turning assumption checks into a rigid decision tree. Confirm independence first, decide whether means are the scientific target, inspect the group sizes and distributions, and then choose a method that addresses the problem actually present. Levene's test can inform that decision, but it should not make the entire decision for you.
If the main problem is unequal variance, Welch is often a strong choice. If the main problem is dependence, severe skew, heavy tails, or influential observations, choose a model that addresses that problem directly. After a significant Welch result, use Games-Howell or another variance-appropriate comparison strategy that matches the research question.
Sources and Further Reading
Welch, B. L. (1951). On the Comparison of Several Mean Values: An Alternative Approach. Biometrika.
NIST/SEMATECH e-Handbook: Levene Test for Equality of Variances.
SciPy documentation: scipy.stats.f_oneway. SciPy documentation: scipy.stats.tukey_hsd.
R documentation: stats::oneway.test. statsmodels documentation: anova_oneway.