
welch's t-test : calculator, formula and examples
Welch’s t-test compares the means of two independent groups without requiring equal population variances. Use the calculator below to find the t-statistic, Welch–Satterthwaite degrees of freedom, p-value, critical value…
Welch’s t-Test: Calculator, Formula and Examples
Welch’s t-test compares the means of two independent groups without requiring equal population variances. Use the calculator below to find the t-statistic, Welch–Satterthwaite degrees of freedom, p-value, critical value and confidence interval from summary statistics or raw data. Then use the guide to decide whether Welch is appropriate and interpret the result correctly.
Key point: Welch’s t-test does not require you to prove that the variances are unequal. It simply avoids assuming that they are equal. This is one reason methodological work has recommended Welch as a strong default for many two-independent-group mean comparisons.[4][5]
Welch’s t-Test Calculator
| Input | Sample 1 | Sample 2 | Setting |
|---|---|---|---|
| Mean | 82 | 76 | Alternative: two-tailed |
| Standard deviation | 8.5 | 9.2 | α = 0.05 |
| Sample size | 20 | 18 | Input type: summary or raw |
Interactive version: The companion HTML file contains a working summary-data/raw-data calculator that returns the mean difference, SE, t, Welch df, p-value, critical value and confidence interval.
Verified example output: t(34.7849) = 2.0808, p = 0.044883, critical t = ±2.0306, 95% CI [0.145, 11.855].
Article path: definition → use case → formula → worked example → interpretation → assumptions → comparison → reporting → FAQs
What Is Welch’s t-Test?
Welch’s t-test is an independent-samples hypothesis test for a difference between two population means. It is also called the unequal variance t-test or Welch–Satterthwaite t-test. For a standard two-sided analysis, the null hypothesis is that the population mean difference is zero, while the alternative is that the difference is not zero.
H₀: μ₁ − μ₂ = 0 H₁: μ₁ − μ₂ ≠ 0
The defining feature is how the test handles variability. A pooled Student’s two-sample t-test combines the two sample variances under a common-variance assumption. Welch keeps the two variance contributions separate and modifies the reference degrees of freedom. NIST presents this unequal-variance form explicitly and describes the Welch–Satterthwaite degrees of freedom as robust to unequal sample sizes and/or variances.[1]
This means Welch is still a test about means. The variance adjustment changes how uncertainty is estimated; it does not change the target from a mean difference to some other parameter.
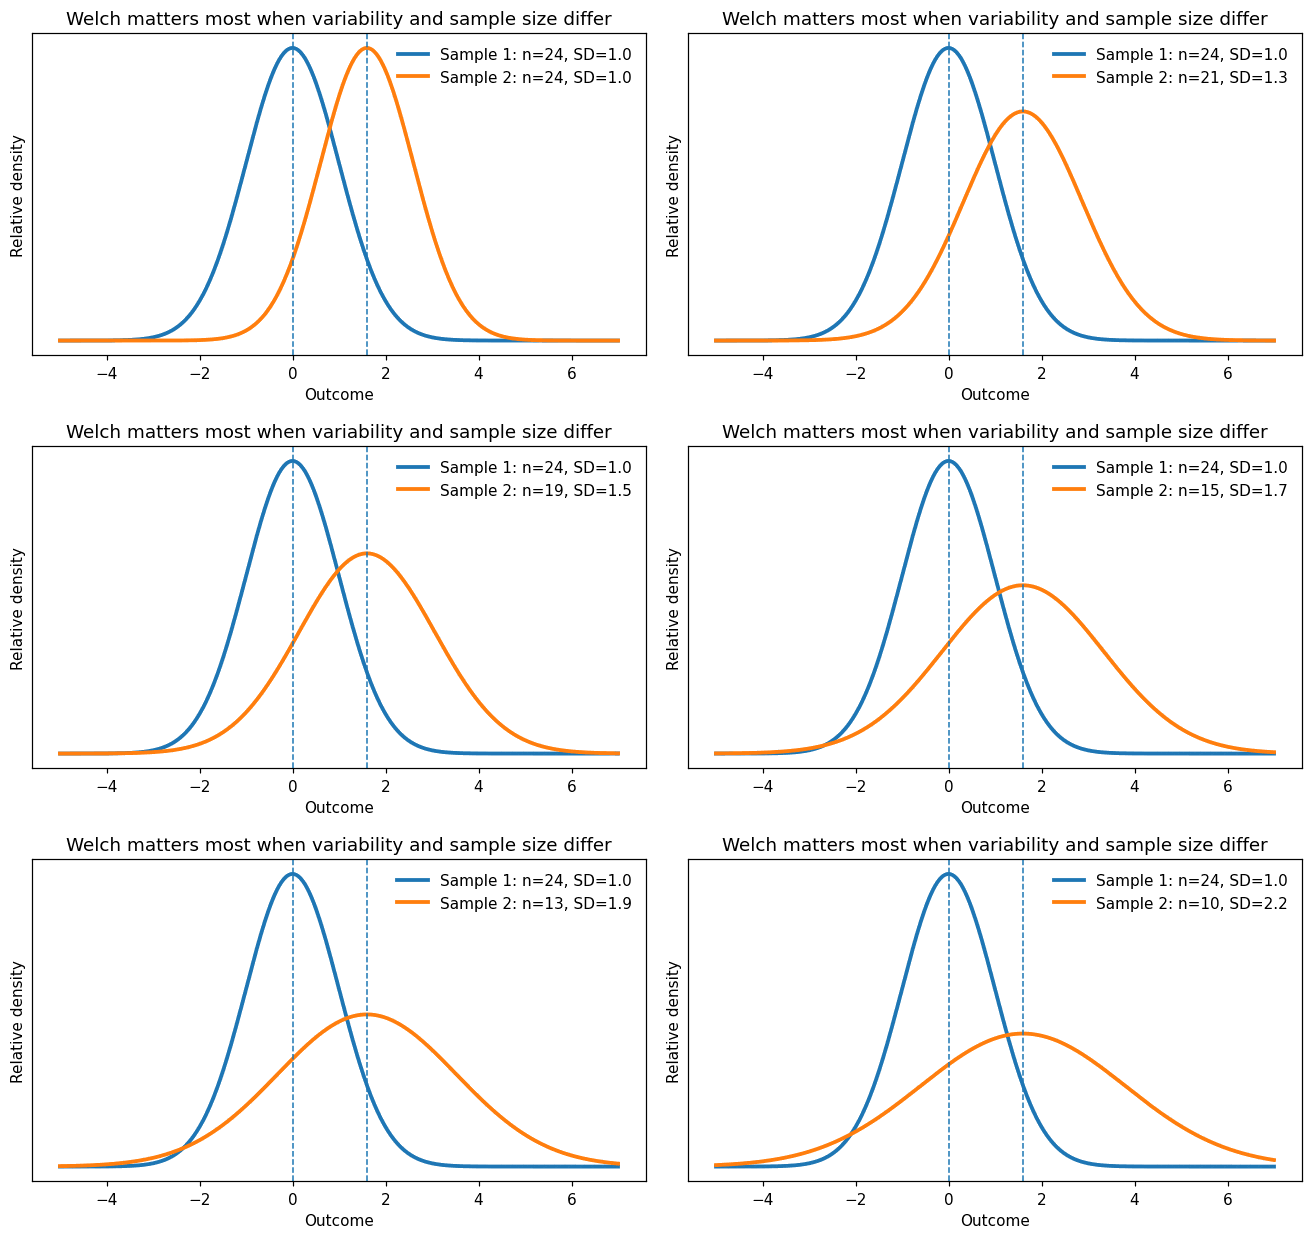
When variance and sample-size imbalance occur together, the pooled and Welch procedures can diverge most sharply. Welch keeps the variance contributions separate.
When Should You Use Welch’s t-Test?
Use Welch’s t-test when you have two genuinely independent groups, the outcome is quantitative, and your question concerns a difference in population means. It is especially useful when sample sizes differ, standard deviations differ, or you do not have a substantive reason to impose equal population variances.
You can also use Welch when the variances happen to be similar. “Unequal variances” describes what the procedure can accommodate, not an assumption that must first be proven. R reflects this approach in its base t.test() function: unless var.equal = TRUE is requested, separate variance estimates and the Welch degrees-of-freedom modification are used for two independent samples.[2]
Do you need an F-test or Levene test first?
Variance tests are legitimate tools when variance equality is itself the research question. They are less useful as an automatic gatekeeper that decides between Student and Welch. Delacre, Lakens and Leys argued that choosing the t-test from a preliminary equality-of-variance test can fail to provide an appropriate decision, and they recommended Welch as a default strategy in the independent-groups setting they studied.[4]
Practically, this means you do not need a sequence of “test the variances, then choose the t-test.” Decide from the study design, the estimand and whether a common population variance is genuinely part of the model.
When Welch is not the right test
Welch is not appropriate merely because there are two columns of numbers. If the same people or units are measured twice, the observations are paired and a paired t-test is usually the relevant classical procedure. If the target is not a mean difference, another method may better match the question. And if the data contain severe skewness, influential outliers or a very small group paired with a much larger one, robust or resampling methods may deserve consideration rather than treating Welch as an automatic cure-all.
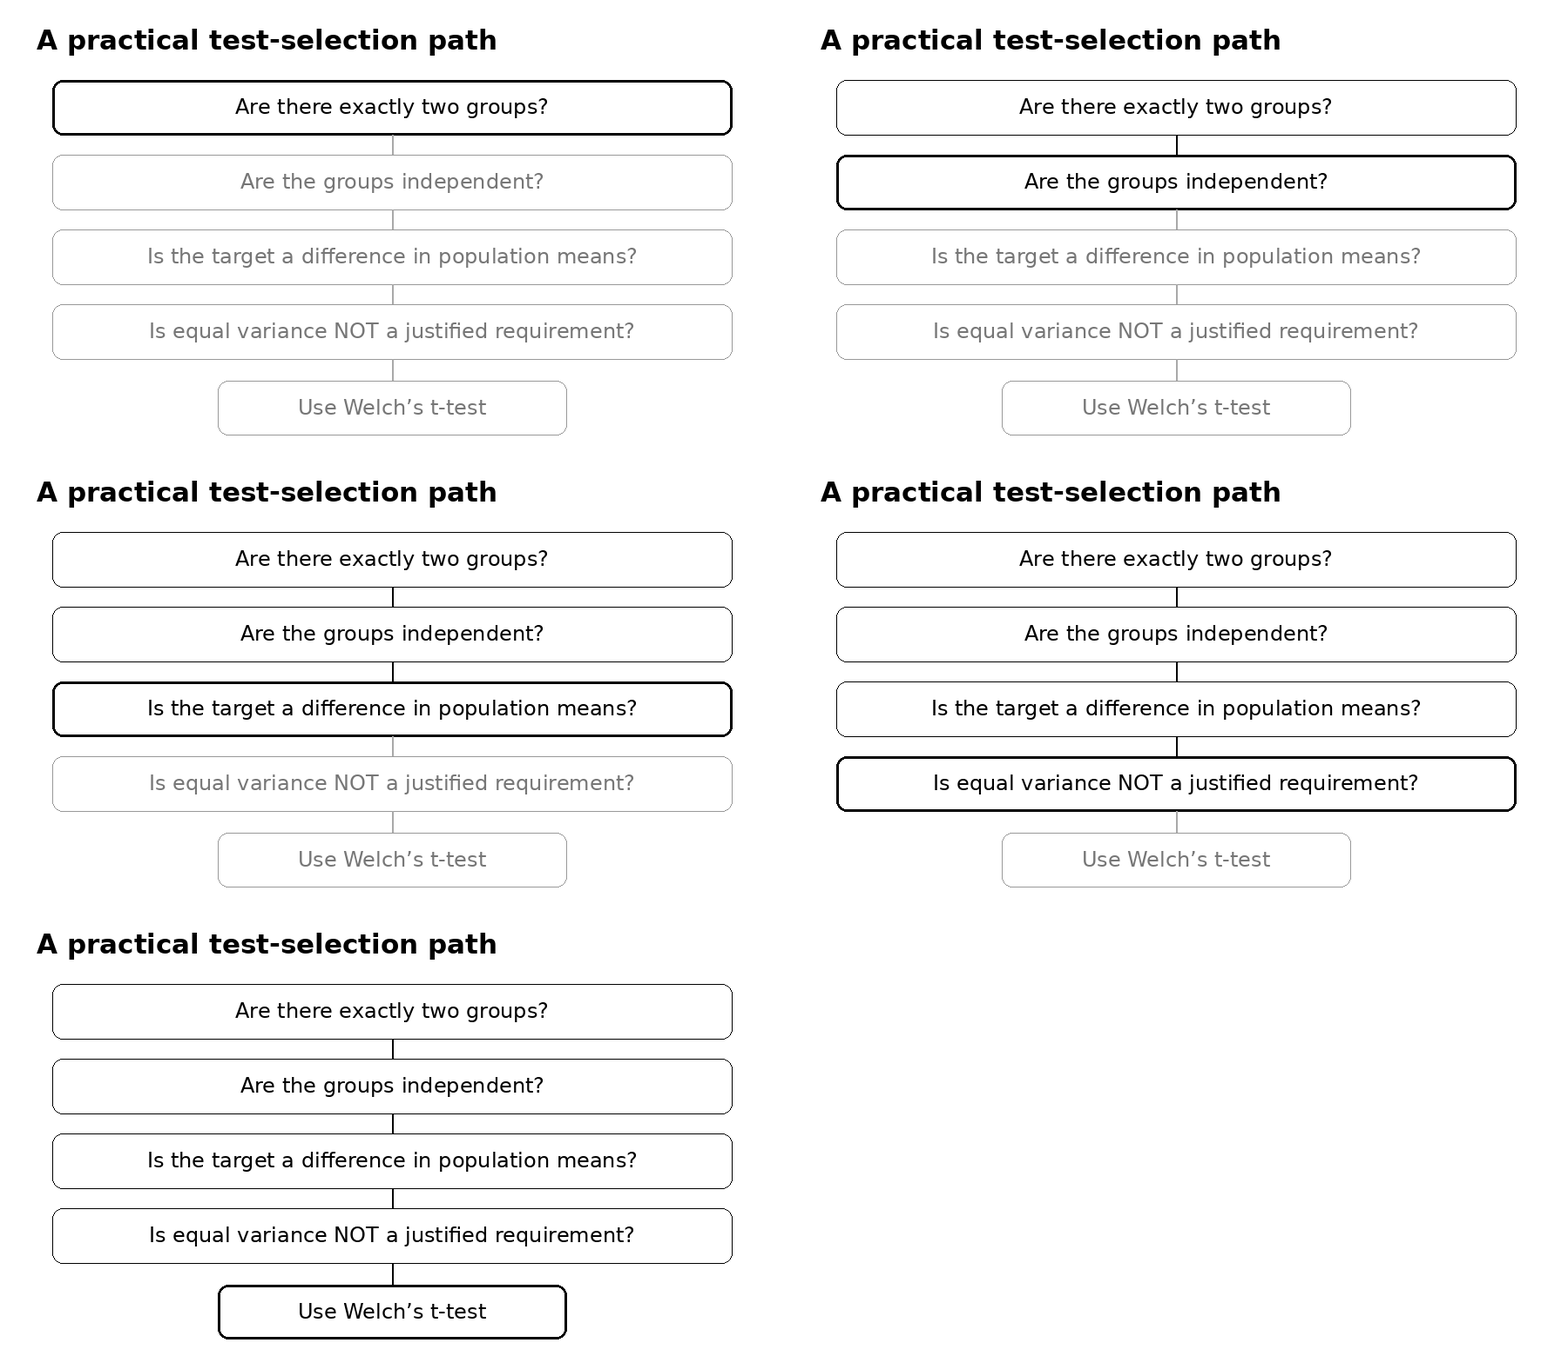
A useful test-selection order is design first, estimand second, variance model third. Do not start by running a variance test.
Welch’s t-Test Formula
The test statistic is the estimated difference between the two sample means divided by the estimated standard error of that difference:
t = (x̄₁ − x̄₂) / √(s₁²/n₁ + s₂²/n₂)
Here, x̄₁ and x̄₂ are the sample means, s₁ and s₂ are the sample standard deviations, and n₁ and n₂ are the sample sizes. The denominator is the standard error:
SE = √(s₁²/n₁ + s₂²/n₂)
The t-statistic therefore answers a useful scale-free question: how large is the observed mean difference relative to the sampling uncertainty estimated from the two groups?
Welch–Satterthwaite Degrees of Freedom
Welch does not normally use the pooled-test degrees of freedom, n₁ + n₂ − 2. Instead, it estimates the degrees of freedom from the two variance contributions:
df ≈ (s₁²/n₁ + s₂²/n₂)² / [ (s₁²/n₁)²/(n₁−1) + (s₂²/n₂)²/(n₂−1) ]
This is the Welch–Satterthwaite approximation used in the NIST unequal-variance two-sample procedure.[1] Because it is an approximation based on continuous quantities, the result can be fractional. A value such as df = 34.785 is normal and should not be forced to a whole number when software can evaluate the t-distribution directly.
How to Perform Welch’s t-Test
Start by stating the research hypothesis and selecting the alternative before looking at the result. For a two-sided question, test whether μ₁ − μ₂ differs from zero. For a directional question, specify whether the difference is greater than or less than zero. Then choose the significance level, calculate the mean difference and standard error, form the t-statistic, calculate the Welch–Satterthwaite degrees of freedom, and use the corresponding t-distribution to obtain the p-value and critical value.
The final step is interpretation, not just calculation. Report the direction and size of the mean difference, its confidence interval, the t-statistic, degrees of freedom and p-value. This prevents the result from collapsing into a binary “significant/not significant” label.
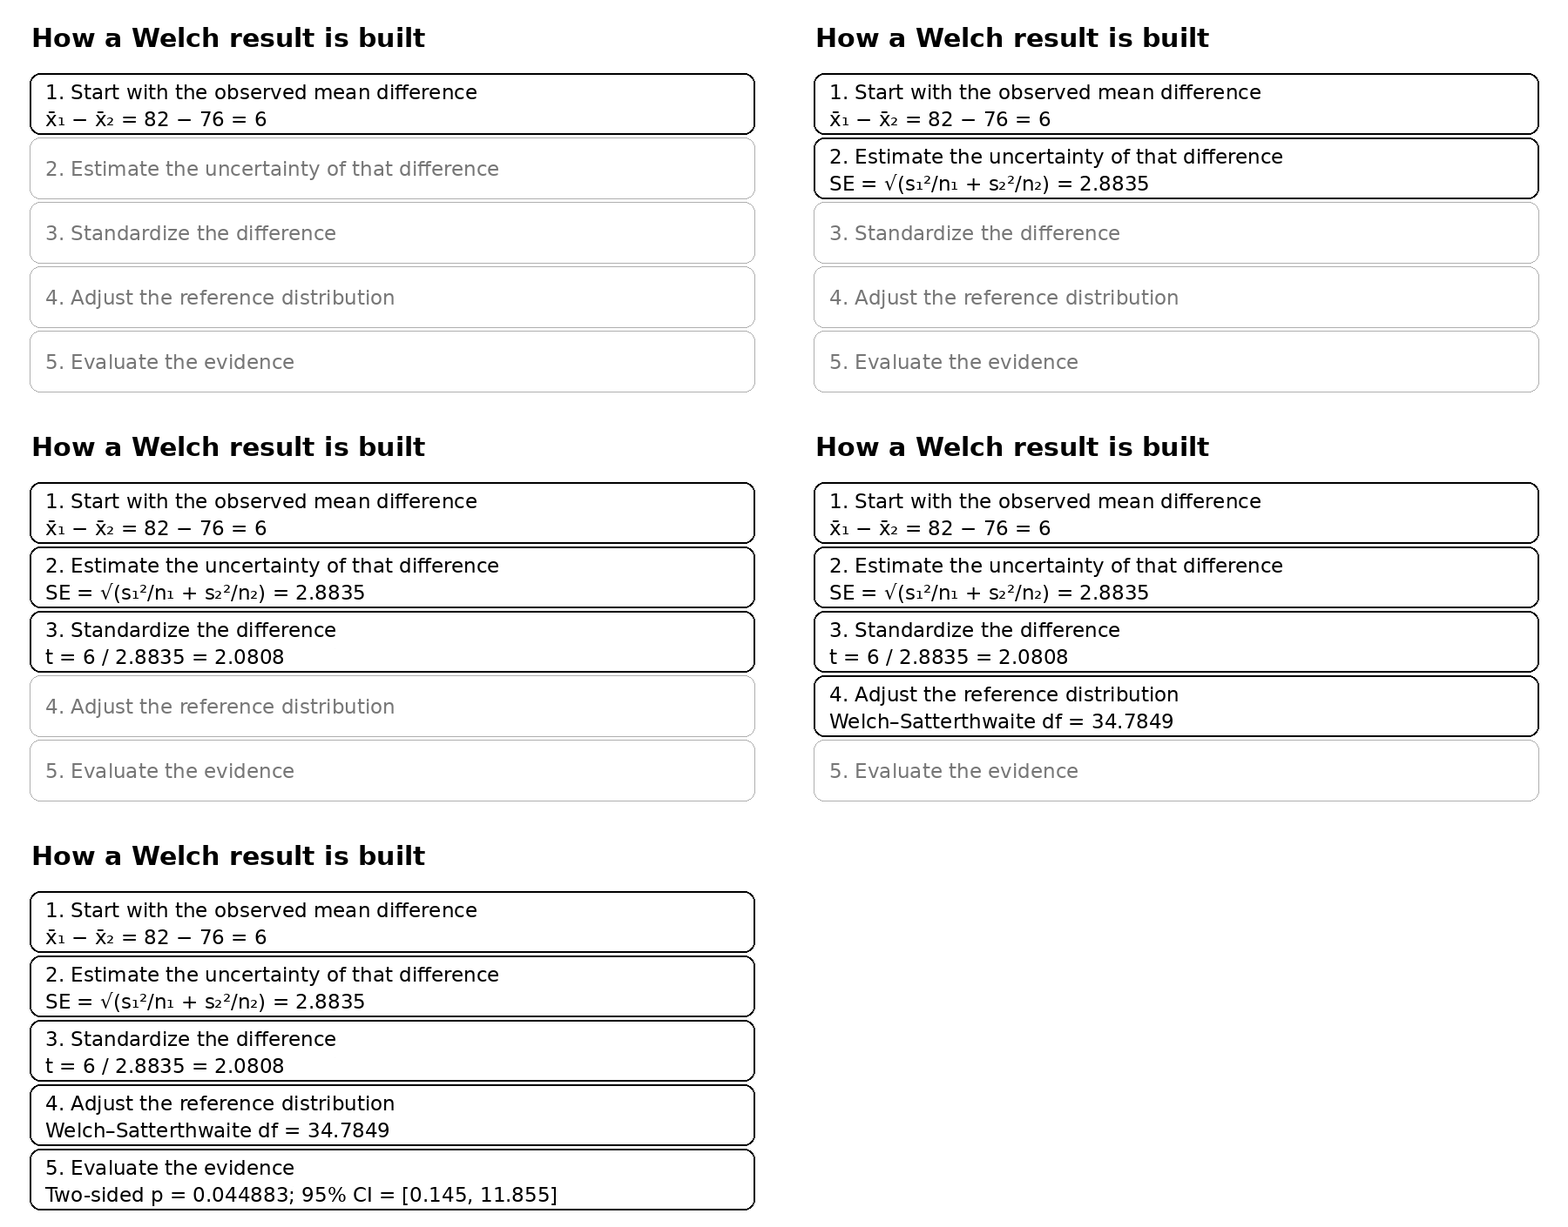
The test result is a chain: estimated difference → standard error → t-statistic → adjusted df → p-value and confidence interval.
Worked Welch’s t-Test Example
Suppose Sample 1 has a mean of 82, standard deviation 8.5 and n = 20, while Sample 2 has a mean of 76, standard deviation 9.2 and n = 18. We will use a two-sided test at α = 0.05.
| Statistic | Sample 1 | Sample 2 |
|---|---|---|
| Mean | 82 | 76 |
| Standard deviation | 8.5 | 9.2 |
| Sample size | 20 | 18 |
Calculate the standard error
SE = √(8.5²/20 + 9.2²/18) = √(3.6125 + 4.7022) = 2.8835
Calculate the t-statistic
t = (82 − 76) / 2.8835 = 2.0808
Calculate the degrees of freedom
Substitution into the Welch–Satterthwaite equation gives df ≈ 34.7849.
Find the p-value, critical value and confidence interval
For t = 2.0808 with df = 34.7849, the two-tailed p-value is approximately 0.044883. At α = 0.05, the critical values are approximately ±2.0306. The estimated mean difference is 6, and the 95% confidence interval is approximately 0.145 to 11.855.
Because p < 0.05, the null hypothesis is rejected at the selected significance level. A better conclusion than “the result is significant” is: the data provide evidence of a population mean difference, estimated at 6 points, with a 95% confidence interval from about 0.15 to 11.86 points.
Two-Tailed, Right-Tailed and Left-Tailed Tests
A two-tailed test uses H₁: μ₁ − μ₂ ≠ 0 and asks whether the means differ in either direction. A right-tailed test uses H₁: μ₁ − μ₂ > 0 and asks whether Population 1 has the larger mean. A left-tailed test uses H₁: μ₁ − μ₂ < 0 and asks whether Population 1 has the smaller mean.
The t-statistic formula itself does not change. What changes is the tail area used for the p-value and the corresponding critical value. The direction should be chosen from the research question, ideally before examining the data. Switching to a one-sided test after seeing a borderline two-sided result changes the inferential question after the evidence is known.
How to Interpret Welch’s t-Test Results
What does the t-statistic mean?
The t-statistic is the estimated mean difference expressed in standard-error units. Its sign follows the order of subtraction. If the statistic is defined as x̄₁ − x̄₂, a negative t simply indicates that Sample 1 has the smaller mean. A negative sign is not evidence for or against statistical significance by itself.
What does the p-value mean?
The p-value measures how extreme the observed test statistic is relative to the null model. It does not tell you the probability that the null hypothesis is true, nor does p = 0.04 mean there is a 96% probability that the alternative is correct.
What does “fail to reject” mean?
If p is greater than α, the data do not provide sufficient evidence to reject the null hypothesis at that threshold. That is not the same as proving that the population means are equal. If the scientific objective is to demonstrate that any difference is small enough to be practically unimportant, an equivalence-testing framework directly addresses that question.[7]
Statistical significance vs practical significance
The p-value answers an evidence question, not a usefulness question. A difference of 0.2 seconds, 2 test points or $3 can be statistically detectable without being important in context. This is why the calculator reports the raw mean difference and confidence interval in addition to t and p.
Assumptions and Real-World Limitations
Welch solves a specific problem: it avoids imposing equal population variances in a two-independent-sample mean comparison. It does not repair a poor study design. Observations should be independent within and between groups under the intended sampling model. Repeated measurements treated as independent, clustered observations, pseudo-replication or biased sampling can invalidate the interpretation even if the formula is calculated perfectly.
Normality, skewness and small samples
Under normal population models, the classical t framework has its cleanest theoretical justification. In practice, t procedures often tolerate moderate non-normality, but the amount of robustness depends on sample size, distribution shape and outliers. Welch should not be translated into the stronger claim that “normality never matters.”
A 2026 simulation study by de Winter examined combinations of variance inequality, sample-size imbalance and skewness. In the settings studied, ordinary Welch controlled Type I error well under normal populations with unequal variances, but its false-positive rate could become inflated as skewness increased under strong imbalance. The study found permutation-based and trimmed alternatives useful in those non-ideal conditions.[6] This is developing evidence from a particular simulation framework, not a reason to discard Welch for routine applications.
Outliers and heavy tails
Extreme values affect both the mean and the sample standard deviation, so they can influence the numerator and denominator of the test at the same time. If a few observations dominate the result, investigate data quality and the measurement process before choosing a statistical workaround. Where heavy tails or contamination are genuine features of the population, robust procedures such as Yuen’s trimmed-mean test may be relevant; SciPy exposes a trimmed t-test option in ttest_ind.[3]
Welch’s t-Test vs Student’s t-Test and Other Alternatives
| Question | Welch | Pooled Student | Paired t-test |
|---|---|---|---|
| Two groups? | Yes | Yes | Yes |
| Groups independent? | Yes | Yes | No; observations are matched or repeated |
| Equal population variances required? | No | Yes | Not the same assumption |
| Uses pooled variance? | No | Yes | No |
| Fractional df possible? | Yes | No under the standard formula | Usually no under the standard formula |
| Main target | Difference in independent population means | Difference in independent population means | Mean paired difference |
Welch vs pooled Student’s t-test
The pooled Student procedure is appropriate when a common population variance is part of the model. Welch is preferable when that equality is not assumed. The distinction becomes especially important when the larger variance is paired with a smaller or larger sample size in a way that makes pooling distort the standard error. SciPy’s documentation gives simulation examples in which the pooled and Welch procedures return materially different p-values under unequal variances and unequal sample sizes.[3]
Welch vs Mann–Whitney U
Mann–Whitney U is often described casually as a “nonparametric alternative to the t-test,” but that shorthand can hide a change in the null hypothesis. SciPy describes Mann–Whitney as testing equality of the underlying distributions, with a location interpretation requiring more restrictive assumptions.[8] If your scientific target is specifically the population mean difference, replacing Welch with a rank test can change what is being tested.
Welch vs a two-sample z-test
A two-sample z procedure for means is relevant when the population standard deviations are treated as known. When they are unknown and estimated from samples, a t-based procedure is generally the natural family. If the population standard deviations are known, use the instead.
More than two groups
Welch’s t-test is a two-group procedure. For three or more independent group means with unequal variances, Welch’s ANOVA is the corresponding extension rather than performing many pairwise t-tests without a multiple-comparison plan.
Common Mistakes to Avoid
Using Welch for paired data. The unequal-variance correction does not make independent-samples mathematics appropriate for repeated or matched observations.
Requiring a significant variance test first. Welch does not require proof of unequal variance. A separate F-test or Levene test is relevant when variance equality is itself of interest, not as a compulsory switch.
Reading p > 0.05 as “the means are equal.” Failure to reject is not proof of equivalence.
Ignoring the size of the effect. A p-value cannot tell you whether the estimated difference is substantively important.
Choosing the tail after seeing the data. The alternative hypothesis should follow the research question, not the desired p-value.
Ignoring influential observations. Outliers can strongly affect the means and variance estimates used by Welch.
How to Report Welch’s t-Test Results
A useful report identifies Welch’s procedure, gives descriptive statistics for both samples, reports the estimated mean difference and confidence interval, and then gives t, df and p. For the worked example, an appropriate concise result is:
A two-sided Welch’s t-test indicated a difference between the population means, t(34.78) = 2.08, p = .045. Sample 1 had M = 82, SD = 8.5, n = 20, and Sample 2 had M = 76, SD = 9.2, n = 18. The estimated mean difference was 6.00 points, 95% CI [0.15, 11.86].
If a standardized effect size is also required, state how it was standardized. When population variances differ substantially, a pooled-standard-deviation effect size deserves additional interpretation because the common-variance scale may not match the statistical model. The raw mean difference and its confidence interval remain directly interpretable in the measurement units.
Verify the calculation in software
R uses the Welch modification by default in the ordinary two-sample t.test() unless var.equal = TRUE is specified.[2] In Python, SciPy performs Welch with scipy.stats.ttest_ind(a, b, equal_var=False); current documentation also exposes the degrees of freedom and a confidence interval method on the returned result.[3]
Frequently Asked Questions About Welch’s t-Test
What is Welch’s t-test used for?
It tests a difference between the means of two independent populations without requiring equal population variances.
Does Welch’s t-test require unequal variances?
No. It allows the variances to differ; it does not require them to be different.
Can Welch’s t-test be used with unequal sample sizes?
Yes. Unequal sample sizes are allowed, and the Welch adjustment is particularly valuable when sample-size imbalance occurs together with unequal variability.[1]
Why are Welch degrees of freedom decimal?
Because the Welch–Satterthwaite equation estimates the reference degrees of freedom from the two sample variances and sizes rather than using the integer formula n₁ + n₂ − 2.
Do I need an F-test before Welch’s t-test?
No. Do not use a preliminary variance test as a compulsory gatekeeper. Use an F-test when your actual inferential question concerns variances; if you want to compare variances directly, see the .
What does a negative t-statistic mean?
With the statistic defined as x̄₁ − x̄₂, it means the first sample mean is lower than the second. Significance depends on the magnitude, df and alternative hypothesis, not on the negative sign itself.
Is Welch one-tailed or two-tailed?
It can be either. Choose a two-sided, right-sided or left-sided alternative according to the research question before interpreting the result.
What if the result is not significant?
State that the data do not provide sufficient evidence of a mean difference at the selected α. Do not claim that the means have been proven equal. If demonstrating negligible difference is the goal, consider equivalence testing.[7]
What if the data are strongly skewed or contain outliers?
Welch is not a universal robustness correction. Severe skewness, strong sample-size imbalance and influential outliers warrant closer diagnostics and may justify a robust or resampling-based alternative.[6]
Welch’s t-Test Calculator: Quick Decision
For two genuinely independent groups and a research question about their population means, Welch’s t-test is a strong classical choice when equal population variances are not part of the model. You do not need to prove unequal variance first. Enter raw data or each group’s mean, sample standard deviation and sample size, choose the correct alternative hypothesis, and interpret the mean difference and confidence interval alongside t, df and p.
The most important limitation is scope: Welch handles unequal variances, not every problem a dataset can contain. Paired observations require a paired analysis, severe skewness or influential outliers may call for robust methods, and a non-significant result does not establish equality. The next sensible action is to calculate the test, inspect the magnitude and precision of the estimated difference, and confirm that the study design actually supports an independent-samples interpretation.
For related calculations, you can verify the resulting p-value with the , check a rejection boundary with the , or use the only when an equal-variance model is justified.