
Which Statistical Test Should I Use? Decision Guide
Direct answer:choose a statistical test by matching the question you want to answer to the type of outcome you measured, the predictors or groups in the design, and the way observations are related. Then check the…
Choose a statistical test by matching the question you want to answer to the type of outcome you measured, the predictors or groups in the design, and the way observations are related. Then check the assumptions of that candidate method. Normality matters for some analyses, but it should not be the first or only decision rule.
If you are searching “which statistical test should I use?”, the most useful approach is not to memorize a list of tests. Build the decision in the same order that the study itself is built: research question → outcome → study design → observation structure → candidate method → assumptions → reporting. Choosing the wrong method can change standard errors, p-values, confidence intervals, and the scientific question being answered.
How to Choose the Right Statistical Test in Five Questions
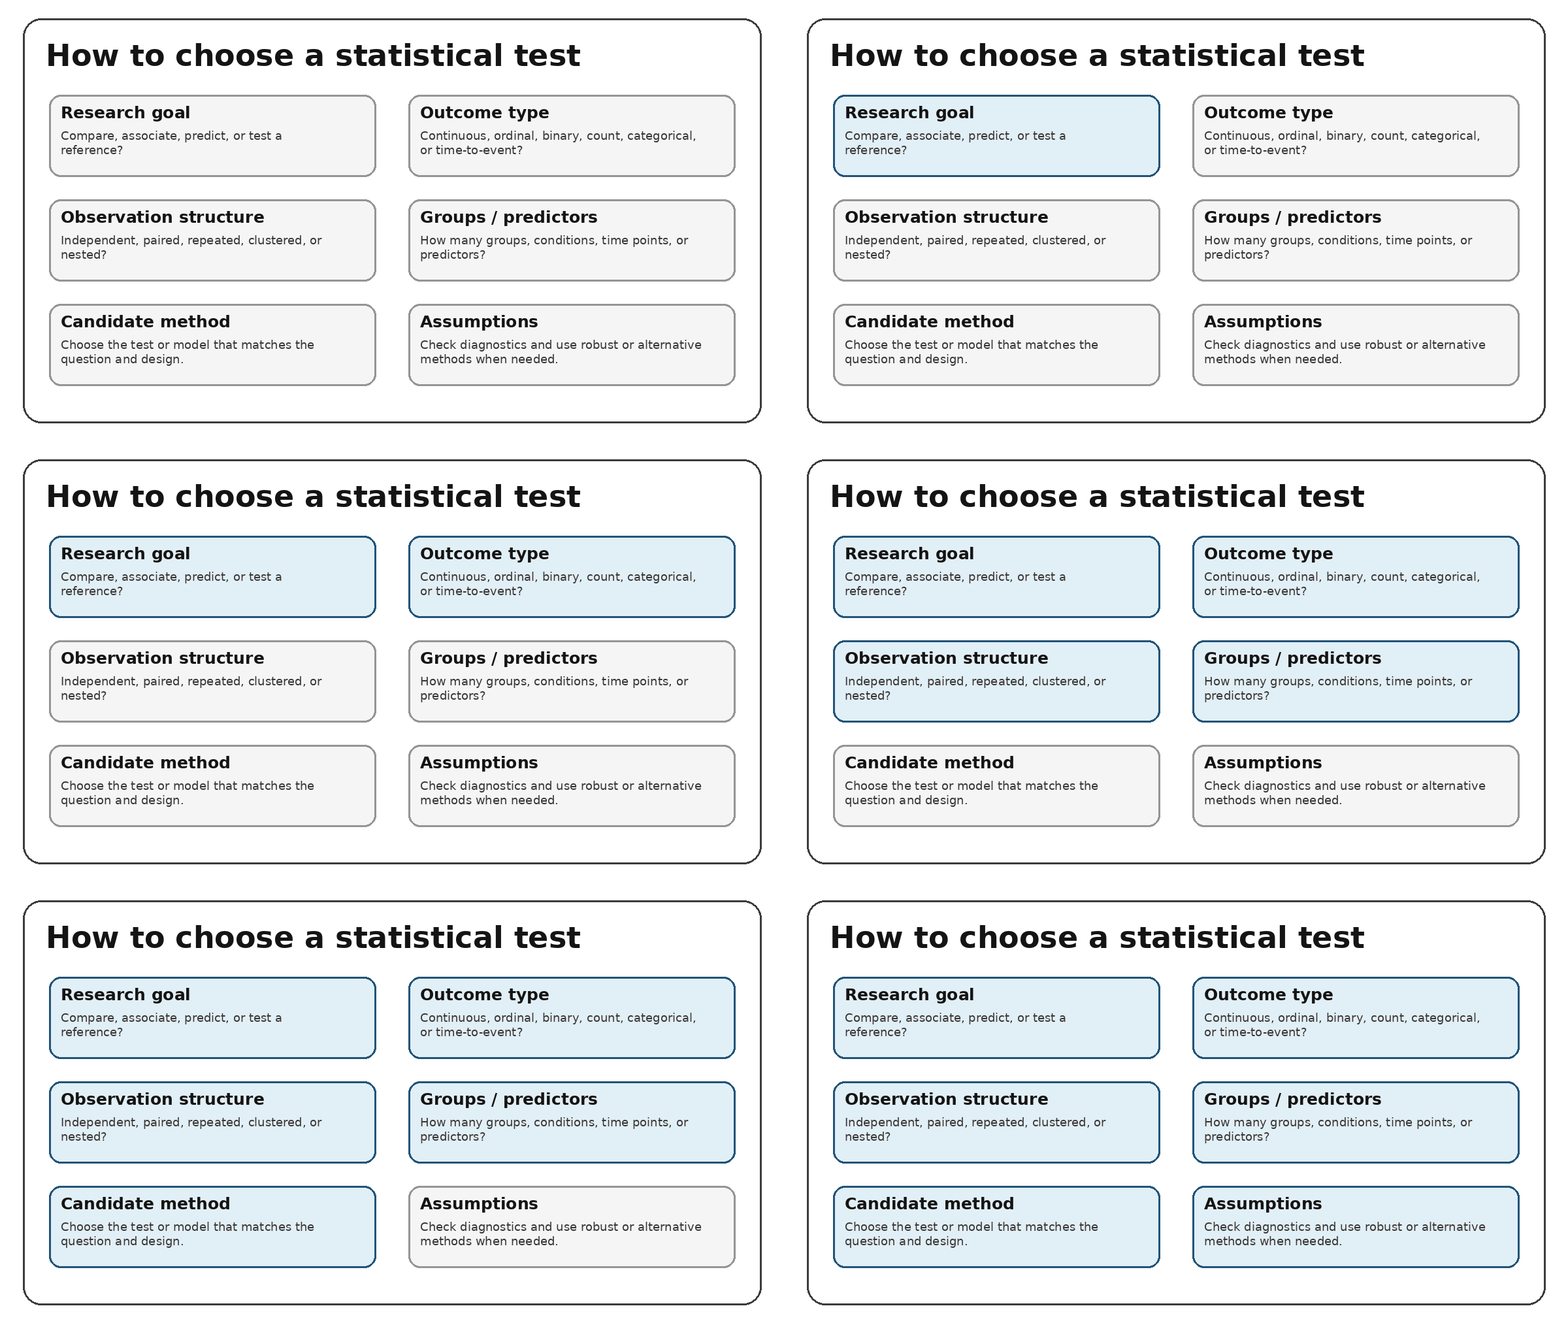
The fastest reliable selector starts with five questions. They are deliberately ordered so that study design comes before assumption testing.
What are you trying to determine?
Decide whether the goal is to compare groups, test an association, predict an outcome, compare an observed result with a reference value, or model a more complex process. A group comparison, a correlation, and a prediction model can involve the same variables but answer different questions.
What type of outcome do you have?
A continuous outcome such as blood pressure or exam score often leads toward t-tests, ANOVA, correlation, or linear regression. A binary outcome such as recovered/not recovered may lead to proportion tests, contingency-table methods, or logistic regression. Ordinal outcomes, counts, rates, and time-to-event outcomes each have their own considerations. Quantitative is not the same as continuous: a count is quantitative but discrete.
How are observations related?
Independent groups contain different observational units with no natural one-to-one link. Paired data arise when the same participant is measured twice or deliberately matched observations are compared. Repeated measurements, students nested within classrooms, and patients nested within hospitals introduce broader dependence. NIST distinguishes paired and unpaired two-sample designs because the calculation and inferential structure change when observations correspond to one another. [1]
How many groups, conditions, time points, or predictors are involved?
Two independent groups point to a different family of methods than three or more groups. Two repeated measurements differ from three or more repeated time points. Prediction with several predictors differs from a simple two-variable association. Count the design features that are relevant to the question, not just the number of columns in the spreadsheet.
Do the assumptions reasonably support the candidate method?
Only now should you examine normality, variance structure, linearity, expected frequencies, outliers, or model fit. For regression and ANOVA, the important diagnostic target is often the residual or error structure rather than whether every raw variable is normally distributed. A formal normality test can help, but it should not function as an automatic test-selection switch. [2]
Statistical Test Selector: Match the Design to a Candidate Method
| Research situation | Common candidate method | Key decision point |
|---|---|---|
| One continuous sample vs. a reference mean | One-sample t-test | Is inference about a mean appropriate? |
| Two independent groups, continuous outcome | Welch two-sample t-test or Student t-test | Are observations independent? Is equal variance defensible if using pooled Student t? |
| Same participants measured twice | Paired t-test | Analyze within-pair differences, not two independent samples |
| Three or more independent groups | One-way ANOVA or Welch ANOVA | Independent groups; consider variance structure |
| Same participants at three or more times | Repeated-measures ANOVA | Within-person dependence and repeated-measures assumptions |
| Two independent ordinal/rank-focused groups | Mann-Whitney U | Ranks/distributions, not automatically medians |
| Two paired ordinal/rank-focused measurements | Wilcoxon signed-rank | Paired differences and rank-based inference |
| Three or more independent ordinal/rank-focused groups | Kruskal-Wallis | Independent groups; rank/distribution interpretation |
| Three or more related ordinal/rank-focused measurements | Friedman test | Related observations |
| Two continuous variables, linear association | Pearson correlation | Linearity, outliers, independence |
| Ordinal variables or monotonic association | Spearman correlation | Monotonic relationship |
| Two categorical variables | Chi-square test of independence | Expected frequencies and independence |
| Sparse 2×2 categorical table | Fisher exact test | Expected frequencies, not merely observed cells |
| Continuous outcome predicted by predictors | Linear regression | Residual diagnostics and model specification |
| Binary outcome predicted by predictors | Logistic regression | Binary response and appropriate model specification |
| Count outcome | Poisson or negative binomial regression | Dispersion, exposure, and count process |
| Time to an event | Survival methods such as log-rank or Cox regression | Censoring and survival assumptions |
This table gives a candidate family, not a permission slip. The final method depends on the exact estimand, sampling process, dependence structure, distribution, and model assumptions.
How Data Types Affect Statistical Test Selection
Continuous and quantitative outcomes
Continuous variables can take values across a measurement scale, such as height, reaction time, or serum concentration. Means, mean differences, linear associations, and regression coefficients are common targets. t-tests, ANOVA, Pearson correlation, and linear regression belong here when the study design and assumptions fit.
Discrete counts and rates
Counts such as number of admissions, defects, or events are numerical but discrete. Their variance often changes with the mean, and zeros can be common. For simple descriptive work this may not matter, but predictive or inferential analyses often require a count model such as Poisson or negative binomial regression rather than ordinary linear regression. Rates may also require an exposure term, such as person-time.
Nominal, binary, and ordinal variables
Nominal categories have labels without an inherent order. Binary outcomes have two states. Ordinal outcomes have an order but not necessarily equal spacing. These distinctions determine whether a contingency-table method, logistic model, ordinal method, or rank-based procedure is more appropriate.
Likert items and scales
A single Likert item is ordinal. A multi-item scale created by summing or averaging validated items may be treated differently depending on its construction, measurement properties, distribution, and research objective. “Likert data” therefore does not identify one universal statistical test.
Which Test Should You Use to Compare Groups?
One-sample t-test
Use a one-sample t-test when the target is a population mean and you want to compare the sample mean with a specified reference value. A long-standing teaching shortcut says to use a z-test when n is at least 30, but modern computational practice commonly uses the t-distribution whenever the population standard deviation is unknown and the sample standard deviation estimates it. OpenStax explicitly notes that the old n = 30 switch is largely historical. [5]
Independent-samples t-test and Welch t-test
For two independent groups and a continuous outcome, a two-sample t procedure is appropriate when the target is a difference in population means. The pooled Student t-test assumes equal population variances. Welch t-test does not require that equality assumption and adjusts the standard error and degrees of freedom. NIST documents both equal- and unequal-variance versions of the two-sample t procedure. [1]
A practical default for many independent two-group mean comparisons is to consider Welch first, especially when group sizes or variances differ. That is a recommendation about the variance assumption, not a claim that Welch solves skewness, dependence, outliers, or other design problems.
Paired t-test
Use a paired t-test when each observation in one condition has a natural partner in the other, such as before and after measurements from the same patient. The relevant variable is the within-pair difference. Testing the before and after columns as if they came from unrelated people discards the pairing and changes the estimated uncertainty.
One-way ANOVA and Welch ANOVA
One-way ANOVA is an omnibus test for mean differences across three or more independent groups defined by one factor. A significant result tells you that the group means are not all compatible with equality; it does not identify which pairs differ. Planned contrasts or post-hoc comparisons are needed for that second question. Welch ANOVA provides an alternative when equal variances are not a reasonable assumption.
Repeated-measures ANOVA
Repeated-measures ANOVA is designed for the same observational units measured across several conditions or times. It explicitly recognizes within-person dependence. When follow-up times are irregular, data are substantially incomplete, or the repeated structure is more complex, a mixed-effects model may represent the design better than a traditional repeated-measures ANOVA.
When Should You Use a Non-Parametric Test?
Non-parametric methods are useful when rank-based inference better matches the measurement scale or when a distributional model needed for a parametric procedure is not defensible. They are not assumption-free repair buttons. Independence, pairing, and the interpretation of the rank distributions still matter.
Mann-Whitney U
Mann-Whitney U compares two independent samples using ranks. It is often described as a test of medians, but that description is only justified under additional conditions, such as similarly shaped distributions that differ mainly by location. The BMJ has highlighted that Mann-Whitney can also respond to differences in spread and shape. [6]
Wilcoxon signed-rank
Wilcoxon signed-rank is a rank-based method for paired observations. It is not the same as pretending two paired samples are independent. The analysis is built from within-pair differences and has its own symmetry-related interpretation.
Kruskal-Wallis and Friedman
Kruskal-Wallis extends independent-sample rank comparisons to three or more groups. Friedman handles three or more related conditions. Neither should be described simply as “ANOVA for non-normal data,” because the quantity being compared and the interpretation differ from ordinary mean-based ANOVA.
Parametric vs. Non-Parametric Tests: Normality Is Not the Whole Decision
A common statistical test flowchart says: run Shapiro-Wilk; if p > .05, use a parametric test; if p < .05, switch to a non-parametric test. That rule is too mechanical.
The Shapiro-Wilk procedure tests whether a random sample is compatible with a normal distribution. NIST describes small values of the W statistic as evidence of departure from normality. Failing to reject the normality hypothesis is therefore not proof that the population is normal, and rejecting it does not automatically invalidate every parametric procedure. [2]
Sample size, balance, the severity of skewness, tail behavior, influential outliers, the parameter being estimated, and the robustness of the candidate method all affect the practical decision. A Q-Q plot is especially useful because it shows the form of the departure rather than reducing the issue to one p-value.
The better question is: “Are the assumptions that matter for this analysis sufficiently reasonable for the inference I want to make?”
Statistical Assumptions to Check Before Running a Test
Independence of observations
Independence is primarily a design property. If one participant contributes several rows, if measurements are repeated over time, or if observations are clustered within sites, ordinary independent-sample standard errors may be too small. Identify the observational unit before treating the number of spreadsheet rows as the sample size.
Normality of errors, residuals, or paired differences
The relevant normality target depends on the analysis. A paired t-test focuses on the distribution of within-pair differences. Regression and ANOVA assumptions are typically expressed in terms of model errors or residuals. Do not automatically run a normality test on every raw variable and assume that answers the model question.
Homogeneity of variance
Some mean-comparison methods assume equal variances across groups. Levene test evaluates that hypothesis and is less sensitive to departures from normality than Bartlett test. [3] But a Levene p-value should not become another automatic switch: examine the actual group spreads, sample-size imbalance, and whether an unequal-variance method already addresses the issue.
Linearity and monotonicity
Pearson correlation and ordinary linear regression describe linear relationships. Spearman correlation describes monotonic rank association. A scatterplot should normally be inspected before either coefficient is interpreted because a single number can hide curvature, clusters, and influential points.
Expected frequencies in contingency tables
For chi-square approximations, expected frequencies matter. The simplistic rule “if any observed cell is below five, use Fisher exact” is not the correct criterion. NIST describes Cochran-style guidance based on expected counts, including whether at least 80% exceed five and none fall below one. [4]
Multicollinearity and model specification
Multiple regression also requires attention to predictor redundancy, influential observations, functional form, and whether important structure is missing from the model. Variance inflation factors can help diagnose multicollinearity, but no single cutoff substitutes for understanding why the predictors are in the model.
Correlation or Regression: Which Should You Use?
Pearson and Spearman correlation
Use correlation when the scientific target is the strength and direction of association between two variables rather than a predictive equation. Pearson focuses on linear association between quantitative variables. Spearman uses ranks and targets monotonic association, making it useful for ordinal variables or non-linear monotonic relationships. Correlation alone does not establish causation.
Linear regression
Use linear regression when the outcome is continuous and the objective is to estimate how it changes with one or more predictors. Regression supports adjustment for multiple predictors, confidence intervals for coefficients, prediction, and model diagnostics. The assumption is not that every predictor is normally distributed.
Logistic regression
Use logistic regression when the outcome is binary and you want to estimate its relationship with one or more predictors. A simple 2×2 chi-square analysis and a logistic model can analyze related questions, but regression becomes especially useful when adjustment for additional predictors is needed.
Which Test Should You Use for Categorical Data?
Proportion tests
A one-proportion procedure compares one binary proportion with a claimed value. A two-proportion procedure compares binary outcome proportions across two independent groups. These are natural choices when the estimand is directly a proportion difference or ratio and the approximation conditions are reasonable.
Chi-square test of independence
Use the chi-square test of independence for a contingency table when the goal is to determine whether two categorical variables are associated. The test evaluates the overall pattern of counts, not causation and not the size of the association by itself. Pair it with the observed proportions and an appropriate effect measure when interpretation matters.
Fisher exact test
Fisher exact test is especially useful for sparse 2×2 tables where the chi-square approximation may be unreliable. The decision is based on the expected-frequency structure rather than merely whether an observed cell happens to contain fewer than five cases. [4]
Paired categorical outcomes
If the same participants provide a binary outcome twice, the observations are paired. A standard chi-square independence test treats observations as independent and may not fit. McNemar test is a common method for paired binary outcomes. This is a useful example of why “categorical vs. categorical” is not enough information by itself.
When Welch Methods Are the Better Choice
Equal variances are often treated as a box to tick before a t-test or ANOVA. A more practical approach is to recognize that Welch procedures are specifically designed for mean comparisons without assuming equal population variances.
For two independent groups, Welch t-test adjusts the standard error and degrees of freedom. For three or more independent groups, Welch ANOVA serves a similar role. Unequal sample sizes make variance heterogeneity more consequential, so this choice deserves attention even when both groups look approximately normal.
Welch is not a substitute for solving dependence, major outliers, severe model misspecification, or the wrong outcome family. It solves a narrower problem: unequal variance in a mean-comparison framework.
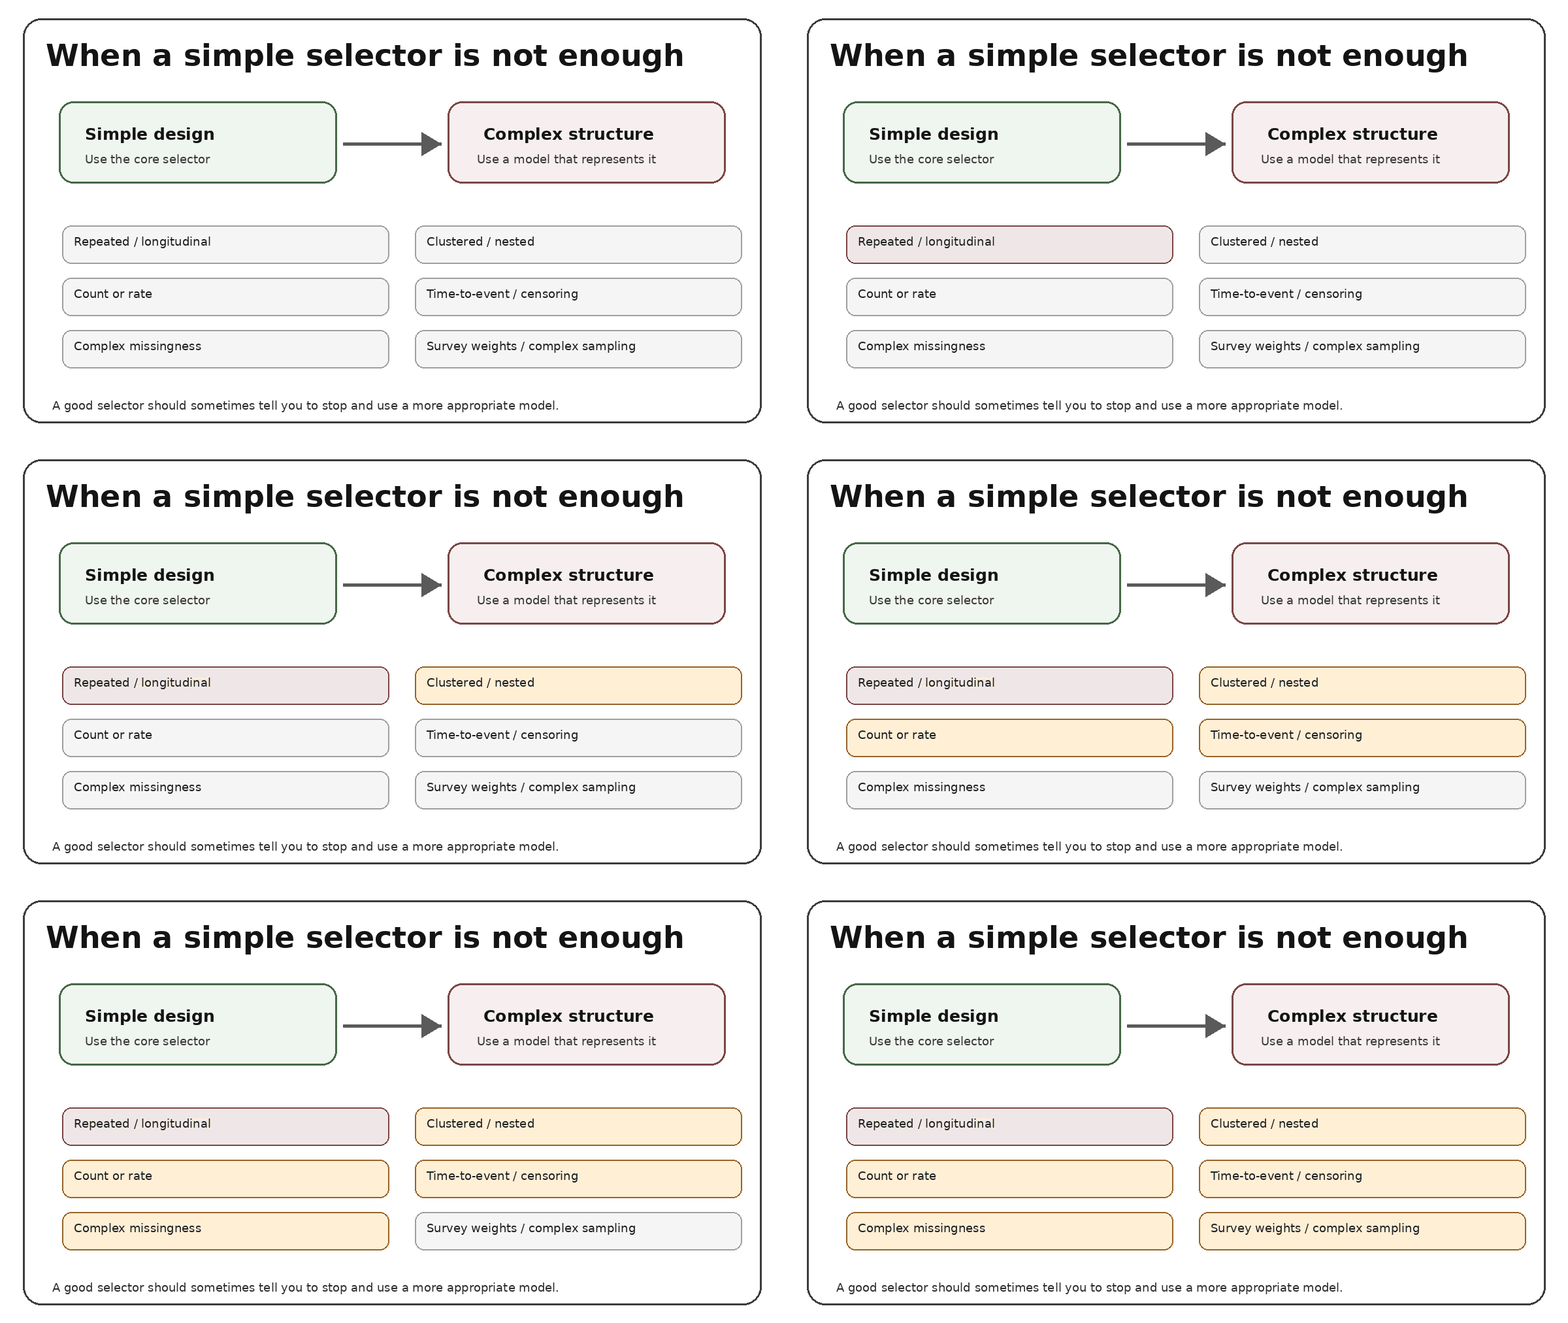
When a Simple Statistical Test Selector Is Not Enough
A good statistical test selector should sometimes tell you to stop. Some designs need a model that explicitly represents their structure instead of a single introductory test.
| Data structure | Why the simple selector can fail | Methods to investigate |
|---|---|---|
| Repeated or longitudinal measurements | Rows from the same person are correlated | Mixed-effects models, generalized estimating equations |
| Students within classes; patients within hospitals | Observations share cluster-level influences | Multilevel / hierarchical models, cluster-robust methods |
| Counts or event rates | Outcome is discrete and often mean-variance linked | Poisson or negative binomial regression |
| Time-to-event outcomes with censoring | Not all participants have fully observed event times | Kaplan-Meier, log-rank, Cox regression |
| Substantial missing repeated data | Complete-case repeated ANOVA can waste data and change the target population | Appropriate longitudinal models; missing-data strategy |
| Complex survey samples | Weights, strata, and clusters affect uncertainty | Survey-design-aware estimation |
If your design falls into one of these categories, directing the analysis toward a more appropriate model is more useful than confidently forcing it into t-test versus Mann-Whitney or ANOVA versus Kruskal-Wallis.
Worked Examples: Choosing a Statistical Test Step by Step
Before and after therapy
Thirty patients have anxiety scores before and after treatment. The outcome is numerical and the same patients are measured twice. If inference about the mean change is appropriate and the paired differences are reasonably modeled, use a paired t-test. If the research target is rank-based or the measurement scale makes mean inference unsuitable, consider a paired rank method.
Two independent teaching methods
Two separate classes receive different teaching methods and the outcome is exam score. This is a continuous outcome with independent groups. Welch two-sample t-test is a strong candidate for a mean difference because it does not require equal variances.
Three skewed ordinal pain groups
Pain is recorded on an ordinal scale for three independent treatments. If a rank-based comparison matches the scientific question, Kruskal-Wallis is more natural than forcing an ordinary ANOVA solely because there are three groups.
Landing-page conversion
Visitors are randomly assigned to page A or B and conversion is yes/no. A two-proportion or 2×2 contingency-table analysis addresses the unadjusted difference. Logistic regression becomes useful if the analysis also adjusts for traffic source, device, or other predictors.
Study hours and exam score
Both variables are quantitative. If the question is linear association, Pearson correlation is a candidate. If the aim is to predict score from hours and perhaps prior GPA, regression is the more informative framework.
Hospital readmission
Readmission within 30 days is binary, with age, treatment, and comorbidities as predictors. Logistic regression matches the outcome and the multivariable objective. A t-test would answer a different question.
Monthly measurements for a year
Eighty patients contribute up to 13 measurements each. The spreadsheet may contain more than 1,000 rows, but the observations are clustered within 80 people. A longitudinal or mixed-effects model is usually more appropriate than treating all rows as independent.
Common Statistical Test Selection Mistakes
Choosing a test from sample size alone
Rules such as “n < 30 means non-parametric” or “n ≥ 30 means z-test” are too crude. Sample size affects robustness and precision, but it does not determine the outcome type, estimand, pairing, clustering, skewness, or variance structure.
Testing raw data for normality when the model concerns residuals
For paired t-tests the differences matter; for many regression and ANOVA models the residual structure matters. Normality testing the original response in isolation can answer the wrong diagnostic question.
Treating paired or repeated data as independent
This discards the dependence structure and can distort standard errors. The observational unit matters more than the number of spreadsheet rows.
Automatically switching because Shapiro-Wilk is significant
A p-value from a normality test is evidence about distributional adequacy, not a complete method-selection algorithm. Combine it with plots, design, robustness, and the scientific target.
Calling Mann-Whitney a median test without qualification
The test can detect differences in location, spread, or shape. A median-shift interpretation requires stronger conditions. [6]
Using many t-tests instead of a planned multi-group analysis
Repeated pairwise testing increases the opportunity for false-positive findings. Use a coherent omnibus or model-based strategy and planned or adjusted follow-up comparisons when appropriate.
Reporting only p < .05
Statistical significance does not quantify the size or importance of an effect. The ASA explicitly cautions that conclusions should not be based only on whether a p-value crosses a threshold and that p-values do not measure effect size. [7]
What to Report After Choosing Your Statistical Test
The test name is not the finished analysis. Report enough information for the reader to understand the direction, magnitude, uncertainty, and assumptions behind the result.
| Analysis | Useful reporting elements |
|---|---|
| t-test | Group or paired descriptive statistics, estimated mean difference, confidence interval, t statistic, degrees of freedom, p-value, and suitable effect size |
| ANOVA | Group descriptives, omnibus statistic and degrees of freedom, p-value, effect size, and planned/post-hoc comparisons when relevant |
| Correlation | Correlation coefficient, confidence interval where available, sample size, p-value, and a plot showing the relationship |
| Regression | Coefficient estimates, confidence intervals, model diagnostics, sample size, fit information, and clearly defined outcome/predictors |
| Categorical analysis | Observed counts/proportions, test statistic or exact result, p-value, and an association measure where useful |
A p-value is not the probability that the null hypothesis is true. The American Statistical Association states that p-values indicate how incompatible the data are with a specified model, do not measure effect size or importance, and should not be the sole basis for scientific or business decisions. [7]
FAQs
Which statistical test should I use for two groups?
For a continuous outcome and two independent groups, a two-sample t procedure such as Welch t-test is a common candidate when the target is a difference in means. If the same people are measured twice, the data are paired. Ordinal or rank-based questions may call for Mann-Whitney U or Wilcoxon signed-rank instead.
Which test should I use for three or more groups?
For a continuous outcome across independent groups, consider one-way ANOVA or Welch ANOVA. For an ordinal/rank-focused comparison across independent groups, Kruskal-Wallis may fit better. Repeated observations require a repeated-measures or longitudinal approach.
Which test should I use for before-and-after data?
If the same participants are measured before and after, the observations are paired. A paired t-test targets the mean within-person change when that estimand and its assumptions are appropriate. Wilcoxon signed-rank is a common rank-based alternative.
Which statistical test should I use for Likert-scale data?
There is no single test for all Likert data. Individual items are ordinal; multi-item scales may be analyzed differently depending on validation, construction, distribution, and the research question.
When should I use Pearson instead of Spearman correlation?
Use Pearson when the target is linear association between quantitative variables and the assumptions are reasonable. Use Spearman for ordinal data or when the target is a monotonic rank relationship.
When should I use chi-square instead of Fisher exact?
Chi-square is useful when the expected-frequency approximation is adequate. Fisher exact is especially useful for sparse 2×2 tables. Evaluate expected counts, not only observed cells. [4]
Do I need to test for normality before using a t-test?
You should consider the relevant distributional assumption, but a formal normality test is not always required and should not be used alone. Inspect the appropriate data or residuals, assess outliers and sample structure, and consider robustness.
Can I use a parametric test when data are not perfectly normal?
Often yes. Perfect normality is not required for many procedures. The seriousness of the departure, tail behavior, balance, sample size, outliers, and the method’s robustness matter.
What should I use when variances are unequal?
For two independent means, Welch t-test is designed for unequal variances. For three or more independent means, consider Welch ANOVA. These methods address variance heterogeneity, not every other model assumption.
What statistical test should I use with a small sample?
There is no universal small-sample test. The correct method still depends on the outcome, design, dependence, estimand, distribution, and whether exact or robust methods are available. Small samples make uncertainty and diagnostics more important, not less.
What is the difference between statistical significance and effect size?
Statistical significance describes incompatibility with a specified null model under the testing framework. Effect size describes magnitude. A result can be statistically significant yet too small to matter practically. [7]
Statistical Test Selection Checklist
- Define the research question before opening the test menu in SPSS, R, Python, Stata, jamovi, JASP, or another package.
- Identify the outcome variable and its measurement type.
- Identify predictors, grouping variables, conditions, or reference values.
- Determine the true observational unit.
- Decide whether observations are independent, paired, repeated, clustered, or nested.
- Count the groups, time points, conditions, and predictors relevant to the question.
- State what quantity you want to compare or estimate: mean difference, proportion, rank relationship, odds, rate, time-to-event effect, and so on.
- Choose a candidate method that matches the question and design.
- Check only the assumptions that matter for that method, using plots and diagnostics as well as formal tests where useful.
- Use Welch, robust, exact, rank-based, transformed, or model-based alternatives when they better answer the same scientific question.
- Report effect estimates, uncertainty, descriptive statistics, and diagnostics instead of reporting only a p-value.
Which Statistical Test Should You Use? The Practical Takeaway
The best answer to “which statistical test should I use?” starts with the research question and study design, not with a normality test. Identify the outcome, determine how observations are related, decide what quantity you want to estimate, choose a candidate method, and then evaluate its assumptions.
For simple designs, this process usually narrows the choice quickly: independent mean comparisons lead toward Welch or Student t procedures and ANOVA; paired observations require paired methods; categorical outcomes lead toward proportion, contingency-table, or logistic methods; associations lead toward correlation; prediction leads toward regression.
The most important limitation is equally practical: a simple selector is not always enough. Longitudinal, clustered, survival, count, weighted, or otherwise complex data may require a statistical model that represents that structure explicitly. When the design is complex, refusing to force the data into an introductory test is part of choosing the right method.
A sensible next step is to write one sentence describing your research goal, outcome, predictors or groups, number of measurements, and whether observations are independent or related. If you can state those pieces clearly, the correct statistical family is usually much easier to justify.
Sources
[1] NIST/SEMATECH Engineering Statistics Handbook: Two-Sample t-Test for Equal Means
[2] NIST/SEMATECH Engineering Statistics Handbook: Shapiro-Wilk Test for Normality
[3] NIST/SEMATECH Engineering Statistics Handbook: Levene Test for Equality of Variances
[4] NIST Dataplot: Fisher Exact Test and expected-frequency guidance
[5] OpenStax Statistics: A Single Population Mean Using the Student's t-Distribution
[6] BMJ: Mann-Whitney test is not just a test of medians
[7] American Statistical Association: Statement on Statistical Significance and P-Values
[8] Google Search Central: AI Features and Your Website
[9] Google Search Central: Optimizing for Generative AI Features on Google Search