
Wilcoxon Signed-Rank Test: Steps, Uses and Examples
The Wilcoxon signed-rank test compares two related sets of measurements when a rank-based analysis is more appropriate than a mean-based paired t-test. It ranks the absolute paired differences, restores their signs, and…
What Is the Wilcoxon Signed-Rank Test in Simple Terms?
The Wilcoxon signed-rank test compares two related sets of measurements when a rank-based analysis is more appropriate than a mean-based paired t-test. It ranks the absolute paired differences, restores their signs, and evaluates whether positive and negative changes are balanced around zero.
Use it for repeated or matched observations, such as pain scores before and after treatment, battery life before and after an update, or reaction times for the same participants under two conditions.
Core Concepts of the Wilcoxon Signed-Rank Test Explained
The method uses three pieces of information: each paired difference, the magnitude of that difference, and its direction. Small absolute differences receive low ranks, large differences receive high ranks, and tied magnitudes receive average ranks.
The positive and negative rank sums show whether changes mostly point in one direction. The exact statistic reported as W, V, or T can differ by platform, so the software definition must be checked before comparing results across tools.
How the Wilcoxon Signed-Rank Test Works With Paired Data
Imagine nine devices tested before and after a software update. Each device contributes one difference score, so the analysis focuses on within-device change rather than treating the two columns as independent groups.
From what I’ve seen, incorrect results often begin with a pairing error: rows are sorted separately, incomplete pairs are retained inconsistently, or an independent-samples procedure is selected. The integrity of the pairs matters more than the convenience of the menu path.
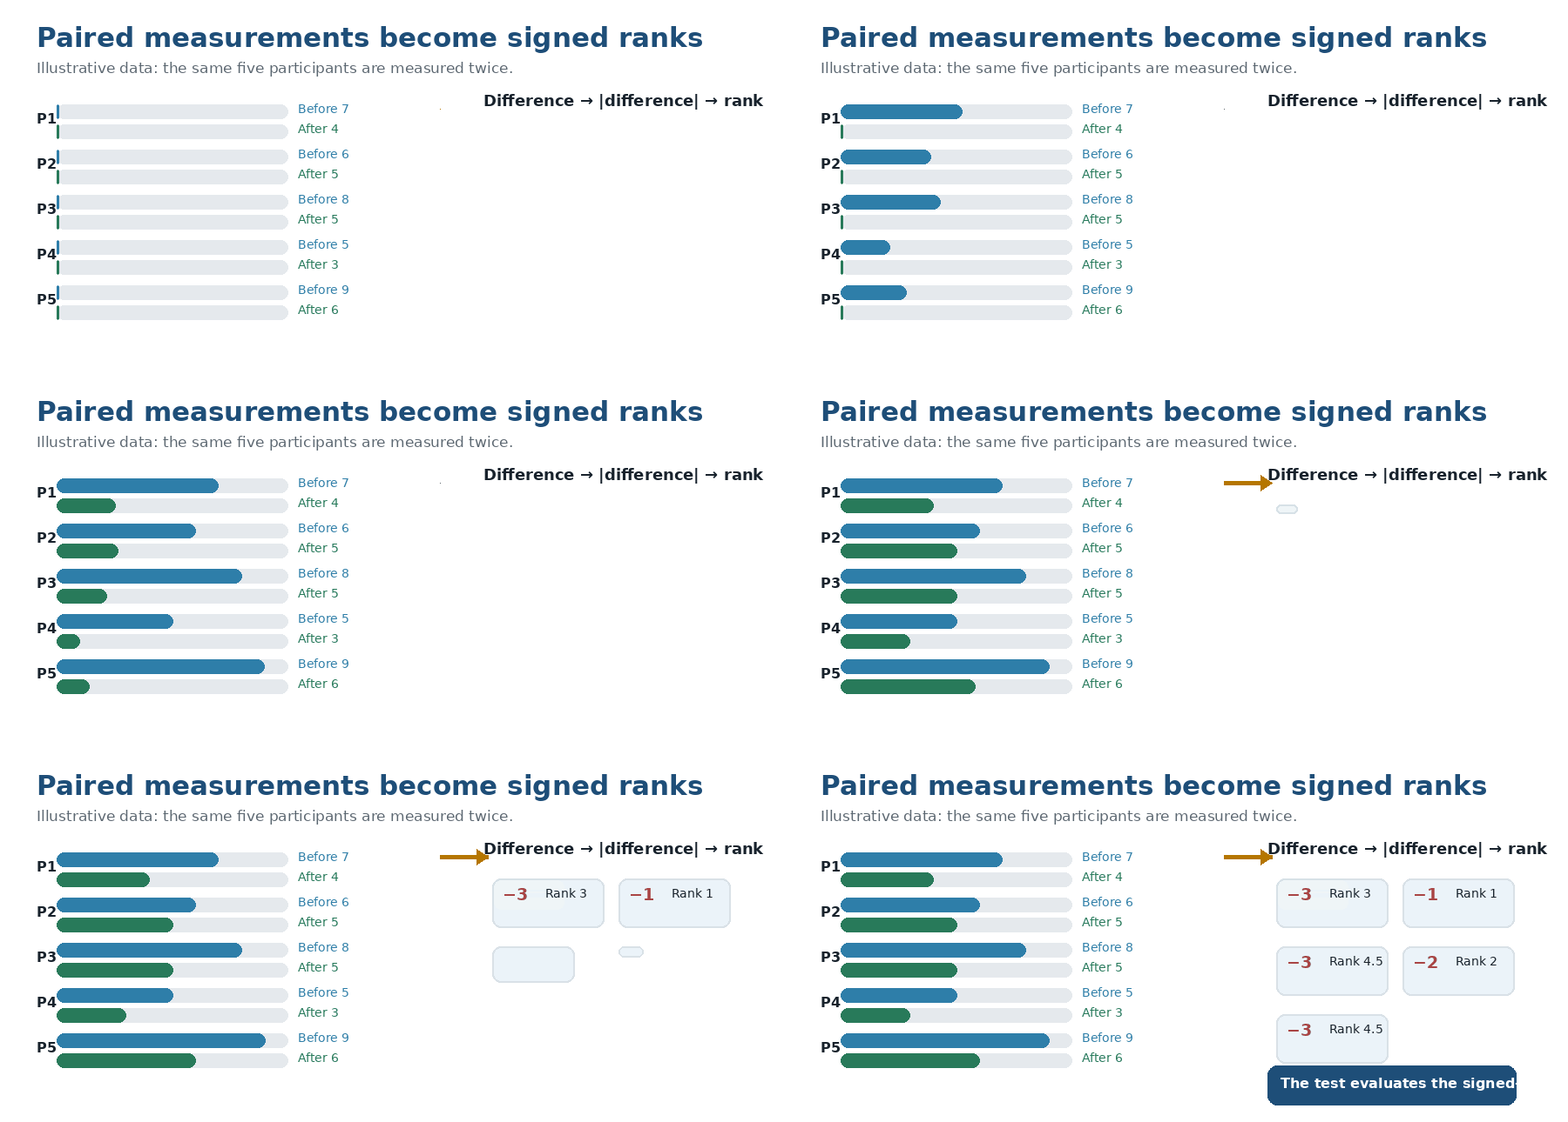
Animated Figure 1. Paired measurements are converted into signed differences and ranks.
When Should You Use a Wilcoxon Signed-Rank Test?
Use the test when there are exactly two related conditions, observations can be meaningfully ordered, and a rank-based comparison matches the research question. It is often considered for ordinal outcomes, small samples, marked outliers, or paired differences that make a normal-theory analysis difficult to defend.
Do not switch tests merely because each raw measurement column looks non-normal. For a paired analysis, the relevant diagnostic target is the distribution of the paired differences.
Wilcoxon Signed-Rank Test vs Paired t-Test: Which Is Better?
Neither test is universally better. The paired t-test directly addresses the mean difference and can remain reliable under moderate non-normality, while the Wilcoxon test limits the influence of extreme numerical magnitudes by replacing values with ranks.
Theoretical advice often says to choose Wilcoxon whenever a normality test is significant, but in practice that rule is too mechanical. Test choice should reflect the estimand, scale, sample size, symmetry, outliers, and whether the scientific question concerns a mean change or a rank-based location shift.
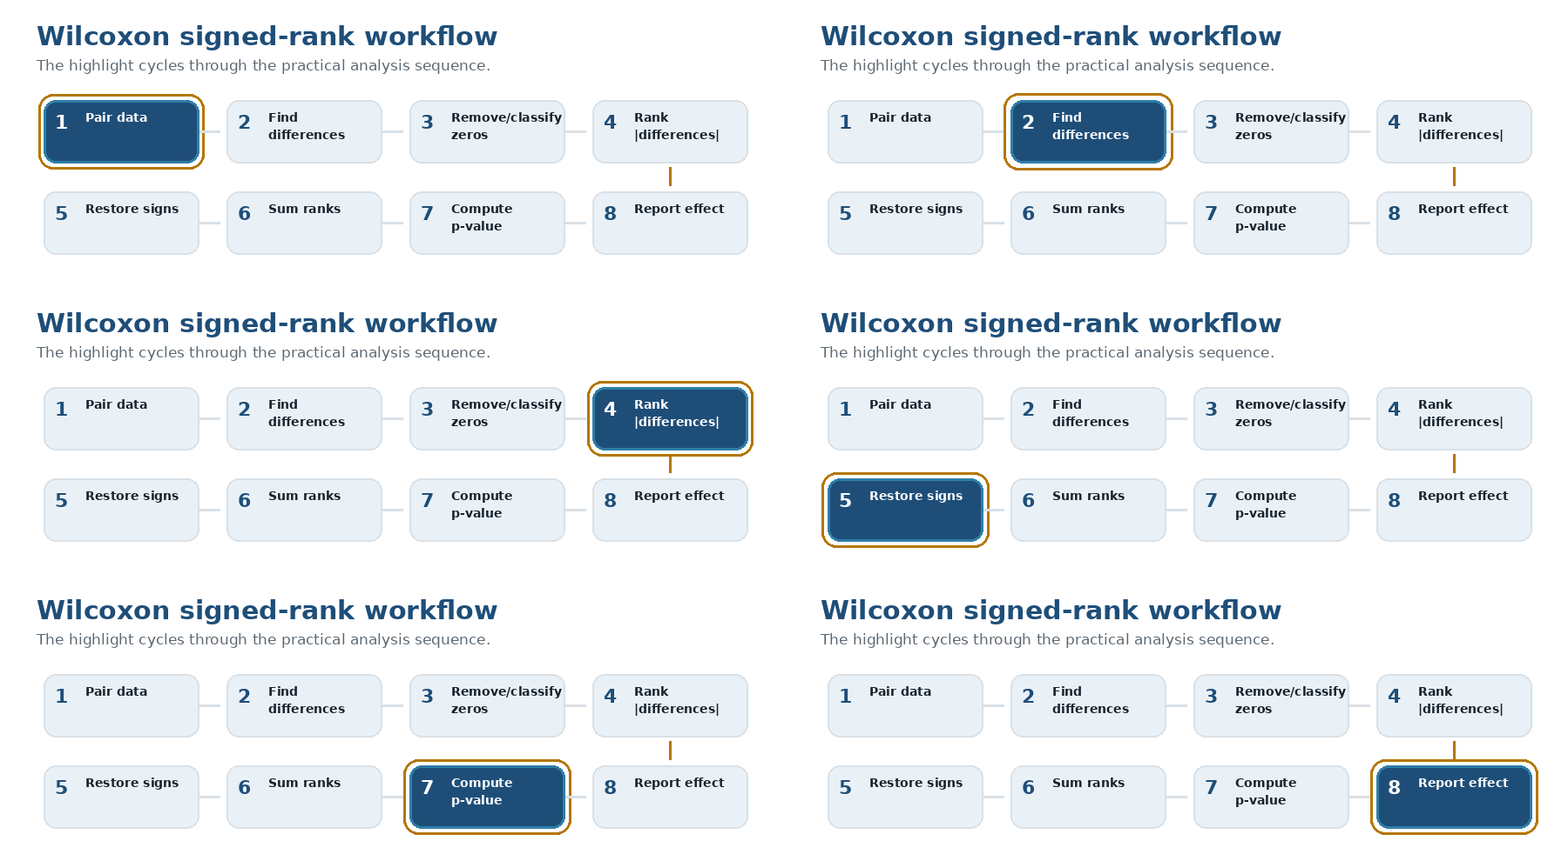
Animated Figure 2. The practical workflow highlights each analysis decision in sequence.
Wilcoxon Signed-Rank Test Assumptions and Data Requirements
The observations must be correctly paired, and different pairs should be independent. The outcome should be ordinal or continuous, and the differences must be rankable.
For the common location-shift interpretation, the distribution of paired differences should be reasonably symmetric. This is the hidden assumption many summaries omit: nonparametric does not mean assumption-free. Severe asymmetry can make a sign test, permutation analysis, bootstrap interval, or another model more appropriate.
How to Calculate a Wilcoxon Signed-Rank Test Step by Step
First calculate the difference for every pair. Next identify exact zeros, rank the absolute nonzero differences from smallest to largest, assign average ranks to ties, and restore each difference’s original sign.
Then sum the positive and negative ranks and use the selected convention to form the test statistic. An exact, permutation-based, or normal-approximation method converts that statistic into a p-value. In real use, software should perform the probability calculation, but manually checking a small dataset is valuable for detecting sign, rank, and data-entry errors.
Try the Wilcoxon Signed-Rank Test Calculator: "Statistics Calculator — dataclue." Enter your paired data to calculate the test statistic, p-value, effect size, and interpretation instantly.
How Tied Ranks, Zero Differences and Outliers Affect the Test
Ties occur when two or more absolute differences have the same magnitude. Zero differences require an explicit rule: some implementations discard them, while others retain or split their ranks using methods associated with Wilcox, Pratt, or zero-split conventions.
A common mistake is to compare p-values from SPSS, R, Python, or an online calculator without matching zero handling, exact-versus-asymptotic settings, continuity correction, and rounding. Small computational choices can explain apparently conflicting output.
How to Interpret the W Statistic, z-Value, p-Value and Effect Size
The test statistic summarizes the signed-rank pattern. The p-value indicates how unusual that pattern would be under the stated null hypothesis, while a z-value may appear when a normal approximation is used.
A small p-value is evidence against the null, not proof of an important effect. Add descriptive statistics, an effect-size measure such as rank-biserial correlation or r, and preferably an interval estimate. When using r = z/√N, define N clearly because reporting conventions differ, often using the number of nonzero pairs included in the test.
SPSS vs R vs Python: Best Tools for Running a Wilcoxon Signed-Rank Test
IBM SPSS Statistics is useful for menu-driven workflows and recognizable output tables. R offers wilcox.test() for paired testing, alternative hypotheses, exact calculations, continuity correction, and confidence intervals. Python’s scipy.stats.wilcoxon() provides explicit controls for zero handling, alternatives, corrections, missing data, and computational method.
What practitioners often do is run the primary analysis in their normal platform, document the settings and software version, then reproduce an unusual result in a second tool. Agreement is meaningful only when both implementations are configured consistently.
Common Wilcoxon Signed-Rank Test Misconceptions
The test is not appropriate for two unrelated groups; that problem usually points to the Mann-Whitney U or Wilcoxon rank-sum test. It also does not automatically test only whether two observed medians are equal under every data-generating process.
Another misconception is that ranking removes all outlier risk. Ranks reduce sensitivity to extreme magnitude, but unusual differences can still change the rank pattern and may reveal measurement, pairing, or protocol problems that deserve investigation.
Why “Nonparametric” Does Not Mean Assumption-Free
The contrarian insight is that automatically selecting Wilcoxon can be less defensible than retaining a paired t-test. A rank procedure may answer a different question from the one specified in the protocol, especially when the target is an average treatment effect.
Reality layer: the best analysis is not the test with the fewest familiar formulas. It is the method whose assumptions, estimand, and uncertainty calculation align most closely with how the observations were produced.
Real-World Examples in Medicine, Engineering and UX Research
Medical researchers may compare pain, mobility, or symptom scores before and after treatment. Engineers may assess battery performance or manufacturing measurements under two configurations, while UX teams may compare task times or satisfaction ratings for the same participants using two interfaces.
These examples share one structural requirement: each observation has a meaningful partner. The domain changes, but correct pairing, transparent exclusions, suitable effect sizes, and a defensible interpretation remain constant.
Wilcoxon Testing in the AI Era
In 2026, generative AI tools and AI agents can suggest statistical tests, generate R or Python code, interpret software output, and draft APA-style reporting. They can accelerate routine work, but they can also reverse the subtraction order, overlook asymmetry, invent a median interpretation, or apply incompatible default settings.
For search visibility, a shallow assumption is that publishers need artificial keyword repetition or fragmented “AI-ready” pages. Google’s current guidance favors effective SEO, original value, clear organization, and useful evidence over special AEO or GEO hacks; its 2026 Search Console generative-AI reporting also gives eligible site owners a direct way to evaluate visibility in AI features.
Wilcoxon Signed-Rank Test Summary and Actionable Next Steps
Use the Wilcoxon signed-rank test when two measurements are genuinely paired, the data can be ranked, and a signed-rank location analysis fits the research objective. Before running it, inspect the differences, assess symmetry, document missing pairs, choose the zero and p-value methods, and define the alternative hypothesis.
Finish by reporting the statistic, p-value, descriptive change, effect size, software version, and relevant settings. The calculation is straightforward; the expert work lies in proving that the method answers the question the data actually pose.
FAQs
Should I avoid this?
Yes, avoid it when the observations are not paired, the outcome cannot be meaningfully ranked, or the paired differences are severely asymmetric for the interpretation you intend. Use an independent-samples test, sign test, permutation method, bootstrap approach, or model that better matches the design.
Is the Wilcoxon test always safer than a paired t-test?
No, it is not automatically safer. It trades numerical information for ranks and may answer a different question, so a paired t-test can be preferable when mean change is the target and its assumptions are reasonably satisfied.
Can a significant Wilcoxon result prove a treatment worked?
No, statistical significance alone cannot prove causation or practical benefit. Study design, effect size, uncertainty, missing data, adherence, and alternative explanations determine how strong the conclusion can be.
Why do SPSS, R and Python sometimes give different p-values?
Usually, the programs are using different defaults for zero differences, tied ranks, continuity correction, rounding, or exact versus asymptotic inference. Match these settings and the direction of subtraction before treating the discrepancy as an error.
Will AI agents make manual validation unnecessary?
No, AI agents can generate code and summarize output, but they can still choose the wrong test or misstate its null hypothesis. Long-term reliability requires a reproducible dataset, disclosed settings, human review, and independent verification of unusual results.
Sources and Verification
The article uses official statistical and search documentation for method definitions, software capabilities, assumption notes, and the 2026 generative-search context.
1.SciPy documentation: scipy.stats.wilcoxon
2. R documentation: stats::wilcox.test
3. IBM SPSS Statistics: Two-Related-Samples Tests
4. Google Search Central: Optimizing for generative AI features
5. Google Search Central: Generative AI performance reports, June 3, 2026