
Best AI Tools for Statistical Analysis in 2026
Discover the best AI tools for statistical analysis in 2026, including Julius AI, Hex, ChatGPT, Power BI, and DataRobot. Compare their features, pricing, statistical capabilities, limitations, and ideal use cases to choose the right platform for your data, skill level, and workflow.
Julius AI is the most practical code-free choice for statistical analysis, while Hex is the stronger option for analysts who need editable SQL, Python, R, live data connections and reusable workflows. ChatGPT is best for quick one-off exploration, and DataRobot or Databricks makes more sense when predictive models must be deployed and monitored.
The best AI tools for statistical analysis are not interchangeable. A spreadsheet assistant, a collaborative notebook, a business intelligence platform and an AutoML system solve different problems. The right choice depends on the statistical method, the user’s skill level, where the data lives and how much validation, governance and repeatability the work requires.
For non-coders, start with Julius AI. For professional analysts, choose Hex. For flexible file-based exploration, use ChatGPT. For governed enterprise reporting, compare Power BI Copilot, ThoughtSpot Spotter, Tableau and Looker. For production machine learning, evaluate DataRobot or Databricks. Use Energent.ai mainly when extracting structured data from PDFs and scans is the first obstacle.
Evidence note: this article is based on current official product documentation, published pricing and primary benchmark research. It does not claim that all 15 tools were tested under one controlled experiment. Product rankings are therefore workflow recommendations, not laboratory-certified winners.
Best AI Statistical Analysis Tools at a Glance
The table compares the products by their actual analytical role rather than treating every tool with a chatbot as equivalent. Prices and feature availability can change by region, plan and contract, so verify the live vendor page before purchasing.
| Tool | Best for | Skill required | Data sources | Statistical capabilities | No-code | Starting price | Main limitation | Overall verdict |
|---|---|---|---|---|---|---|---|---|
| Julius AI | Code-free file analysis | Beginner to intermediate | CSV, Excel, PDFs, Drive and supported connectors | Descriptive statistics, regression, hypothesis tests, R/Python execution and charts | Yes | Free; Plus $20/month | Users must still verify test choice and assumptions | Best dedicated no-code option |
| Hex | Professional SQL, Python and R workflows | Intermediate to advanced | Warehouses, databases, APIs and files | Full code-based statistics, machine learning, visualizations and data apps | Partial | Free; Professional $36/editor/month | More setup and technical knowledge | Best for advanced analysts |
| Akkio | Media-agency data and campaign workflows | Beginner to intermediate | Agency, campaign and connected business data | Predictive and generative analytics within agency workflows | Yes | Custom quote | Current positioning is specialized rather than general-purpose AutoML | Best only for a matching agency use case |
| Energent.ai | Extracting data from unstructured documents | Beginner to intermediate | PDFs, scans, images and spreadsheets | Document extraction, calculations and generated deliverables | Yes | Free trial; paid pricing not clearly public | Vendor benchmark claims require independent reconciliation | Treat as document intelligence first |
| Anomaly AI | Recurring business reports and dashboards | Beginner to intermediate | Excel, CSV, Sheets, GA4, BigQuery, Snowflake and MySQL | Business calculations, trends, joins, reports and alerts | Yes | Free; paid plans from $16/month | Not designed as specialist academic statistics software | Strong for repeatable reporting |
| ChatGPT | Fast one-off exploration and custom analysis | Beginner to advanced | Uploaded files and supported connected sources | Python-based cleaning, tests, models, tables and charts | Yes | Free; Plus $20/month | Not a persistent governed BI system | Best flexible one-off assistant |
| Claude | Long-context reasoning across data and documents | Intermediate to advanced | Files, documents, code and connectors | Code execution, file creation and visualization | Partial | Free; Pro $20/month | Less purpose-built for recurring BI | Strong reasoning companion |
| Google Gemini | Google Sheets-centered analysis | Beginner to intermediate | Sheets, Drive and Google services | Formulas, pivots, charts, optimization tasks and summaries | Yes | Included with eligible Google plans; pricing varies | Best value depends on Google ecosystem adoption | Best for teams already in Sheets |
| Power BI Copilot | Governed Microsoft business intelligence | Intermediate | Microsoft Fabric and connected enterprise sources | DAX assistance, semantic-model analysis, reports and summaries | Partial | Power BI Pro $14/user/month; Copilot capacity extra | Requires a well-prepared semantic model and licensing setup | Best Microsoft BI choice |
| ThoughtSpot Spotter | Search-first governed analytics | Beginner to advanced | Cloud data platforms and governed models | Conversational analysis, root-cause exploration and code execution | Yes | From $25/user/month annually | Quality depends on modeled business context | Best search-first enterprise agent |
| Tableau | Visual analytics and metric storytelling | Intermediate | Enterprise databases, files and governed data sources | Visual analysis, calculated fields, Pulse insights and statistical algorithms | Partial | Free Desktop available; AI editions generally quoted | Advanced statistical modeling is not the core product | Best visualization-led platform |
| Looker | Governed analytics on Google Cloud | Intermediate to advanced | LookML models, BigQuery and databases | Natural-language querying grounded in a semantic layer | Partial | Custom quote | LookML modeling and governance require investment | Best governed Google Cloud BI |
| DataRobot | Governed predictive modeling and monitoring | Advanced | Enterprise structured data and deployed models | AutoML, explanations, deployment, accuracy and drift monitoring | Partial | Custom quote | Enterprise complexity and cost | Best governed AutoML option |
| Databricks | Large-scale data science, engineering and ML | Advanced | Lakehouse tables, streams, files and enterprise systems | EDA, SQL, code generation, ML, pipelines, serving and governance | Partial | Usage-based DBU pricing | Excessive for a small spreadsheet | Best for large technical teams |
| Domo | Real-time operational analytics and dashboards | Intermediate | Cloud apps, databases, files and warehouses | BI, alerts, workflows, Python/R and predictive features | Partial | Custom credit-based pricing | Actual cost depends on usage patterns | Best for operational monitoring |
How We Evaluated the Best AI Tools for Statistical Analysis
The evaluation prioritizes statistical usefulness over marketing language. The core questions are whether a tool can prepare data correctly, run the required method, expose enough logic for review, reproduce the work, connect to the relevant data source and operate within the user’s security requirements.
Statistical accuracy cannot be inferred from a polished chart or confident explanation. AIDABench evaluated more than 600 realistic tasks involving spreadsheets, databases, reports, visualizations and file generation. The best evaluated model achieved 59.43% pass-at-1, showing that current systems still fail a substantial share of complex end-to-end analytics tasks.[31]
That evidence changes the ranking criteria. Ease of prompting matters, but code visibility, assumption checks, traceable transformations, semantic governance and independent validation matter more when the result influences research, finance, healthcare, employment or another high-stakes decision.
Best Dedicated AI Tools for Statistical Analysis
Julius AI: Best Overall for Code-Free Statistical Analysis
Julius AI is designed around conversational data analysis rather than general-purpose chat. Its statistical software pages explicitly describe ANOVA, chi-square tests, P-value calculations, standard deviation and AI-generated R code, alongside data cleaning, modeling and visualization.[1]
The interface is most useful when a student, researcher, marketer or small business user has an Excel or CSV file and wants descriptive statistics, a regression, a comparison test and a clear chart without building a notebook environment. Julius also offers a free plan, while its Plus plan is listed at $20 per month.[2]
The limitation is methodological, not merely technical. A tool can execute valid R or Python code while choosing an unsuitable test, overlooking dependence between observations or interpreting statistical significance as practical importance. Julius is therefore a strong assistant for no-code analysis, not a substitute for understanding the study design.
Hex: Best for Advanced Analysts Using Python, R and SQL
Hex combines SQL, Python, R, no-code exploration, visualizations and data applications in one collaborative workspace. Its notebooks are intended to move from exploratory analysis to reusable apps without switching between a separate query editor, notebook and BI tool.[3]
Professional users can inspect every transformation, modify generated code, install packages, rerun cells, manage version history and publish interactive outputs. The Community plan is free, Professional starts at $36 per editor per month, and Team adds scheduled runs, alerts and broader collaboration at $75 per editor per month.[4]
Hex is not the easiest answer for a beginner with a single spreadsheet. It becomes valuable when analysts need live warehouse access, collaborative review, reproducible code and a path from one-off investigation to a maintained data product.
Akkio: Best for Media-Agency Predictive Workflows
Akkio is often described in older comparisons as a broad no-code predictive analytics platform. Its current official positioning is more specialized: it focuses on automating campaign workflows for media agencies and data providers.[25]
That specialization can be an advantage for agencies that need campaign analysis, audience workflows, forecasting and client-facing reporting. It also means Akkio should not automatically be presented as the best general-purpose predictive modeling tool for academic, scientific or regulated enterprise work. Current pricing is custom.[26]
Energent.ai: Best Treated as an Unstructured-Data Tool
Energent.ai is relevant when the hardest part of the job is extracting tables, figures and quantitative fields from PDFs, scans, images and mixed document collections. Turning those files into structured rows can remove hours of preparation before statistical analysis begins.
The company publicly claims a 94.4% result on DABstep and promotes the ability to process very large multi-file collections.[27] However, the original DABstep paper reported that the best evaluated agent achieved only 14.55% accuracy on its hardest tasks.[28] The figures may refer to different benchmark versions, subsets or evaluation conditions, but the discrepancy must be reconciled before the vendor claim is treated as independent proof.
The practical conclusion is narrower and more defensible: evaluate Energent.ai for document extraction and source reconciliation. Do not assume that strong parsing automatically establishes expertise in inferential statistics, experimental design or production-grade predictive modeling.
Anomaly AI: Best for Recurring Business Analysis and Reporting
Anomaly AI sits between a one-off chatbot and a traditional BI implementation. It connects to sources including Excel, CSV, Google Sheets, GA4, BigQuery, Snowflake and MySQL, then turns plain-language requests into dashboards, reports and recurring analytical workflows.[30]
Its published plans include a free tier and paid options starting at $16 per month.[29] The product is most useful when a monthly revenue review, marketing report, margin analysis or client dashboard must be refreshed repeatedly rather than recreated in a new conversation.
Anomaly is less suitable when the main requirement is a specialist academic procedure, a controlled clinical analysis or a production model with formal drift monitoring. Its strength is traceable business reporting, not every branch of statistics.
Best General-Purpose AI Assistants for Statistical Analysis
ChatGPT: Best for Fast, One-Off Exploratory Analysis
ChatGPT can inspect uploaded data, write and execute Python, clean and combine files, calculate statistics and produce tables or charts. OpenAI’s documentation also allows users to inspect the underlying code, which is essential when the method or transformation must be reviewed.[5]
This flexibility makes ChatGPT useful for exploratory data analysis, custom regressions, hypothesis tests, sensitivity checks and unusual outputs that a narrow no-code interface may not support. The free plan includes limited analysis, while Plus is listed at $20 per month.[7]
File limits still matter. OpenAI documents a hard maximum of 512 MB per uploaded file, with lower practical limits for spreadsheets and structured text.[6] More importantly, successful upload does not prove that every sheet, row, image or table relationship was interpreted correctly. ChatGPT is best used for exploration and prototyping, not as an automatic replacement for a governed reporting system.
Claude: Best for Long-Context Analytical Reasoning
Claude can generate code, visualize data, create files and execute code on its free plan, while paid plans provide more usage and project capabilities. Claude Pro is listed at $20 when billed monthly.[8]
It is especially useful when quantitative work must be interpreted alongside long reports, methodological documents, business rules or a large codebase. That broader reasoning context can help with analysis planning and critique.
Claude is still a general assistant rather than a maintained semantic layer or dashboard platform. Users should preserve the code, transformations and outputs if the work must be reproduced later.
Google Gemini: Best for Google Sheets Workflows
Gemini in Google Sheets can create formulas and tables, generate insights, build charts, create pivot tables, apply formatting, sort or filter data and perform optimization tasks.[9]
That makes it convenient for teams whose analysis should remain inside Sheets and Drive. It reduces file movement and keeps collaboration within familiar Google Workspace permissions.
Gemini is less differentiated when the analysis requires advanced model diagnostics, custom statistical packages or production deployment. At that point, a code-first workspace or managed data platform offers more control.
Best Enterprise BI Platforms With AI Statistical Features
Power BI Copilot: Best for Microsoft-Based Organizations
Copilot for Power BI supports chat-based analysis, report creation, report summaries and DAX assistance across Power BI and Microsoft Fabric.[10] The platform is strongest when users need governed metrics, permissions, refresh schedules and company-wide dashboards rather than a one-time statistical conversation.
Microsoft warns that Copilot can produce low-quality or misleading outputs when the data, semantic model and users are not prepared properly.[11] This is an important reality layer: generative AI does not repair unclear relationships, inconsistent measures or poorly defined business logic.
Power BI Desktop remains free, Power BI Pro is listed at $14 per user per month and Premium Per User at $24, while broader Copilot usage can require eligible Fabric capacity.[12] The total cost therefore includes modeling, governance and capacity—not only the visible per-user license.
ThoughtSpot Spotter: Best for Search-First Governed Analytics
The current product name is ThoughtSpot Spotter, not ThoughtSpot Sage. Spotter is positioned as an enterprise analytics agent that combines conversational analysis, governed data architecture and embedded workflows.[13]
Its advantage is the relationship between natural-language questions and modeled business context. Spotter is more appropriate than a general chatbot when answers must respect approved metrics, row-level security and an enterprise semantic layer.
ThoughtSpot lists plans starting at $25 per user per month when billed annually, with larger usage-based and enterprise options.[14] The main dependency is data readiness: a conversational interface cannot provide dependable answers if the underlying definitions and models are inconsistent.
Tableau: Best for Visual Analytics and Data Storytelling
Tableau Agent helps users explore data, create visualizations, build calculated fields and uncover insights, while Tableau Agent in Pulse examines groups of metrics and provides source-linked explanations.[15][16]
Tableau is most valuable when the final output must communicate trends and drivers clearly to executives, clients or operational teams. It can integrate results from R, Python and other analytical environments, making it a strong presentation layer for advanced work performed elsewhere.
Its limitation is scope. Tableau can support statistical analysis, but its central strength remains visual analytics rather than specialist experimental modeling. AI features also depend on the relevant Tableau edition and configuration.
Looker: Best for Governed Analytics on Google Cloud
Looker’s Conversational Analytics is powered by Gemini and grounded in the Looker semantic modeling layer. It lets users ask questions in natural language while retaining centrally defined metrics, relationships and access controls.[17]
That semantic layer is both the advantage and the implementation cost. Teams must define and maintain LookML models before conversational access becomes consistently useful. This is more work than uploading a CSV, but it creates a stronger basis for organization-wide consistency.
Looker uses custom platform and user pricing. Google is also introducing usage considerations for conversational analytics, so procurement should examine both licensing and query consumption.[18]
Best Enterprise Platforms for Machine Learning and Advanced Modeling
DataRobot: Best for Governed Enterprise AutoML
DataRobot supports model development, deployment, prediction explanations, service monitoring, accuracy tracking and data-drift analysis.[19][20] These capabilities matter after a model leaves an analyst’s notebook and begins affecting operational decisions.
The platform is appropriate when an organization needs repeatable training, governance, explanation and post-deployment monitoring. It is far more than a conversational statistics tool, and its enterprise scope brings additional cost, procurement and implementation work.
AutoML reduces repetitive experimentation, but it does not remove the need to define the target correctly, prevent leakage, select appropriate evaluation metrics or assign accountability for model behavior.
Databricks: Best for Large-Scale Data Science and Machine Learning
Databricks combines data engineering, SQL, notebooks, machine learning, governance and business intelligence on a lakehouse platform. Genie Code can generate and execute code, assist with pipelines and dashboards and work within governed data context.[21]
This is the strongest option in the list for a technical organization that wants data preparation, analysis, model development and production systems in one environment. It is usually the wrong choice for a user who only needs to upload one spreadsheet and run an ANOVA.
Databricks uses usage-based DBU pricing, and AI features can add their own consumption and compute costs.[22] Budgeting therefore requires realistic assumptions about query volume, compute, storage, serving and ongoing administration.
Domo: Best for Real-Time Operational Analytics
Domo combines data connectors, dashboards, alerts, workflows and data-science features, including support for Python and R on governed data.[23] It is designed to move from connected operational data to decisions, notifications and business-facing applications.
The platform is a good fit when leadership needs continually updated KPIs, mobile access and alerts across many sources. It is less attractive for a small team seeking a transparent fixed monthly price.
Domo uses credit-based consumption pricing, so ingestion frequency, transformations, storage, AI usage and automation all influence cost.[24] The realistic buying decision therefore depends on workload design, not just feature availability.
General-Purpose LLMs vs. Dedicated Statistical Analysis Tools
A general-purpose assistant is sufficient when the dataset is manageable, the question is clearly defined and someone can review the generated method and code. ChatGPT or Claude may be more flexible than a dedicated interface because the user can request custom libraries, alternative models and sensitivity analyses.
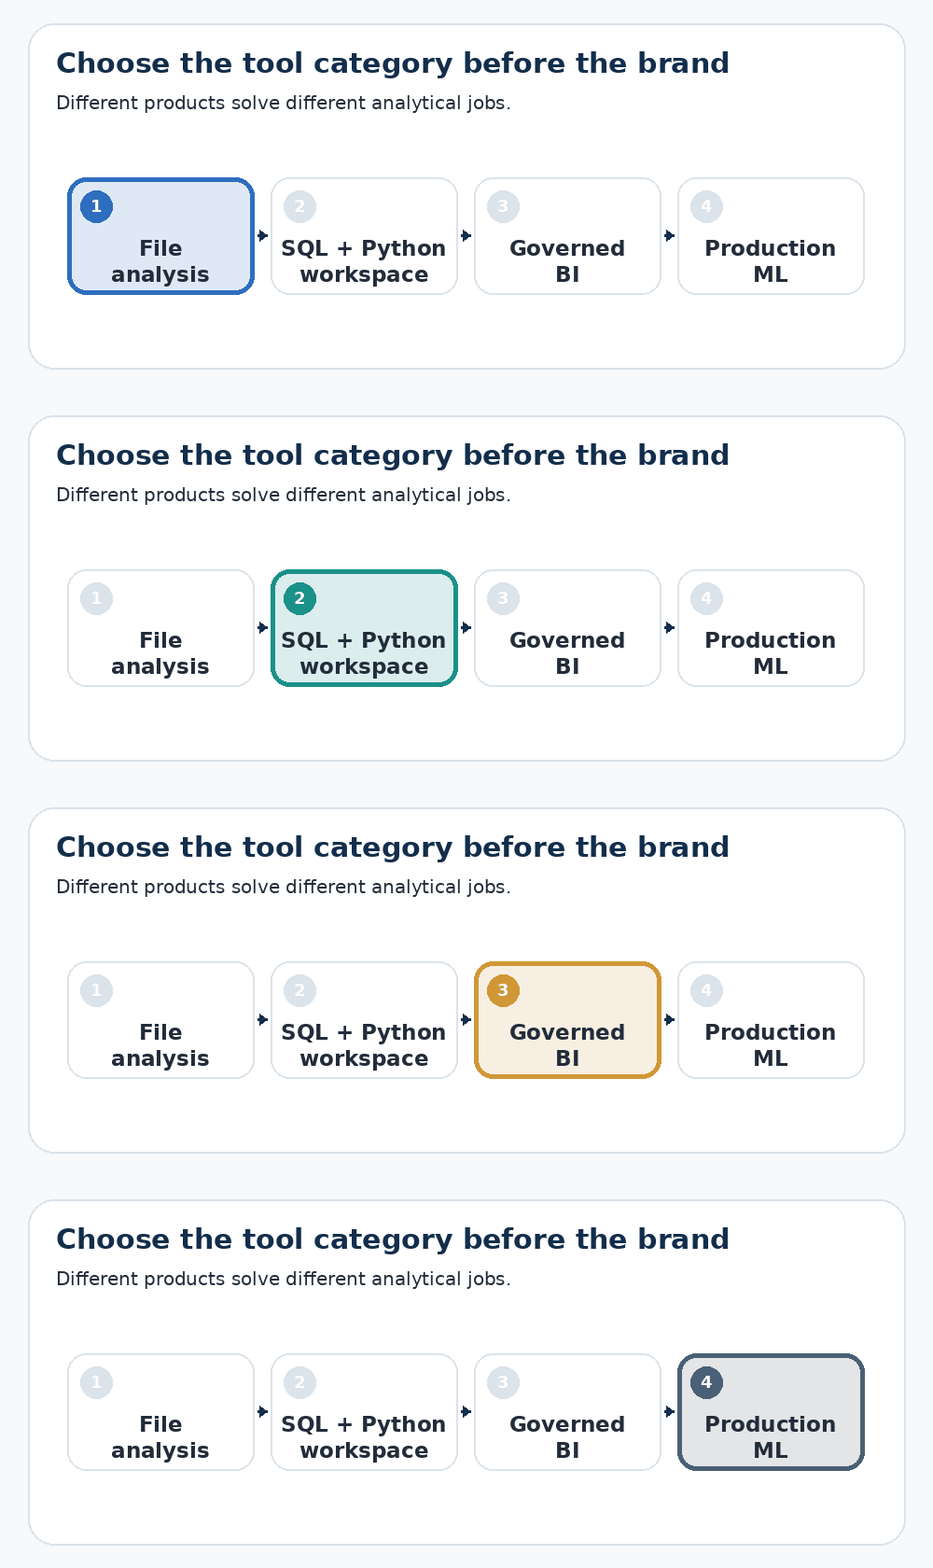
A dedicated analysis tool is preferable when non-coders need guidance, the same workflow must be repeated or the output must become a reusable report. Enterprise BI is the better category when the real problem is maintaining shared business definitions and permissions. AutoML and lakehouse platforms become necessary when models must be deployed, monitored and integrated with production systems.
| Requirement | General-purpose LLM | Dedicated analysis tool | Enterprise BI | AutoML or lakehouse |
|---|---|---|---|---|
| One-off CSV analysis | Strong | Strong | Usually excessive | Excessive |
| Persistent database connections | Limited or plan-dependent | Varies | Strong | Strong |
| Editable Python, R or SQL | Strong in code-enabled environments | Strong in Hex; varies elsewhere | Limited to moderate | Strong |
| Formal statistical analysis | Possible through generated code | Often central | Usually secondary | Strong for predictive work |
| Dashboards and scheduled reports | Limited | Moderate to strong | Strong | Moderate |
| Governed business definitions | Limited | Varies | Strong | Strong |
| Model deployment and monitoring | Limited | Usually limited | Limited | Strong |
| Collaboration and auditability | Varies by plan | Moderate to strong | Strong | Strong |
Best AI Tools for Statistical Analysis by Use Case
Students and Non-Coders
Julius AI provides the most direct statistical interface, while ChatGPT offers broader flexibility. A student should prefer the tool that shows the method, variables, exclusions and code rather than choosing only by the quality of the written explanation.
Academic and Scientific Research
Julius, ChatGPT and Claude can assist with data preparation, scripts and interpretation. Final research should preserve a reproducible R, Python, SPSS, JASP or jamovi workflow, including assumptions, effect sizes, confidence intervals and all exclusions. AI should support methodological judgment rather than replace it.
Excel and CSV Analysis
Use Julius for accessible statistical work, ChatGPT for flexible exploration and Anomaly AI when a large workbook needs to become a recurring report. Google Gemini is the natural choice when the source and collaboration workflow already live in Sheets.
Business Analysts
Anomaly AI is suitable for repeatable file-based reporting. Power BI Copilot fits Microsoft-centered organizations, ThoughtSpot Spotter suits search-first governed analytics and Tableau remains strong when visual communication is the priority.
Data Scientists
Hex provides the best balance of collaborative SQL, Python, R and data applications. Databricks is stronger when pipelines, governance, model serving and large-scale infrastructure must operate together.
Predictive Modeling
DataRobot is the stronger governed AutoML option, while Databricks provides greater technical control and scale. Akkio is worth considering when the workflow is specifically connected to media-agency campaign operations.
Large Enterprise Data
Databricks, Power BI, Looker, ThoughtSpot and Domo are more relevant than a simple upload-and-chat tool. The choice depends on whether the organization prioritizes lakehouse engineering, Microsoft BI, a Google semantic layer, search-first analysis or operational dashboards.
SQL Data Warehouses
Hex is the strongest analyst workspace for SQL plus Python or R. ThoughtSpot, Looker and Power BI are better when business users need governed self-service access to warehouse data.
PDFs and Unstructured Documents
Energent.ai can be evaluated for extracting structured fields from mixed documents. The extracted values should be reconciled with the original source before they are passed into a statistical model.
Automated Dashboards and Reports
Power BI, ThoughtSpot, Tableau, Looker, Domo and Anomaly AI are more appropriate than a temporary chatbot conversation. Their value comes from refresh schedules, permissions, maintained definitions and repeatable delivery.
How to Choose Among the Best AI Tools for Statistical Analysis
Define the Statistical Question
“Find insights” is not a sufficient analytical brief. State whether you need a group comparison, relationship test, forecast, classification model, anomaly investigation or recurring KPI report. The product category follows from that job.
Match the Tool to the User’s Skill Level
A non-coder needs guided workflows and understandable warnings. An analyst needs editable calculations and SQL. A data scientist needs package control, diagnostics, reproducibility and integration with engineering systems.
Identify Where the Data Lives
A local CSV, multi-tab workbook, scanned report, PostgreSQL database, Snowflake warehouse and Databricks lakehouse require different connectors, security controls and processing strategies.
Confirm the Required Methods
Check whether the platform natively supports the statistical method or merely generates code that might implement it. Confirm that the workflow can report assumptions, diagnostics, effect sizes, uncertainty and alternative specifications where relevant.
Evaluate the Semantic Layer and Data Context
For enterprise analytics, a semantic layer defines measures, relationships and business terms consistently. Without this context, two users can ask the same question and receive calculations based on different assumptions.
Review Privacy and Retention Terms
Assess encryption, model-training policies, data retention, user permissions, audit logs, regional processing, private networking and deployment options. A consumer account should not be treated as equivalent to an enterprise contract.
Run a Representative Pilot
Use a dataset with known answers, missing values, inconsistent categories, an intentional outlier and at least one opportunity for an incorrect join. Measure correctness, repeatability, error recovery, export quality, setup effort and practical cost.
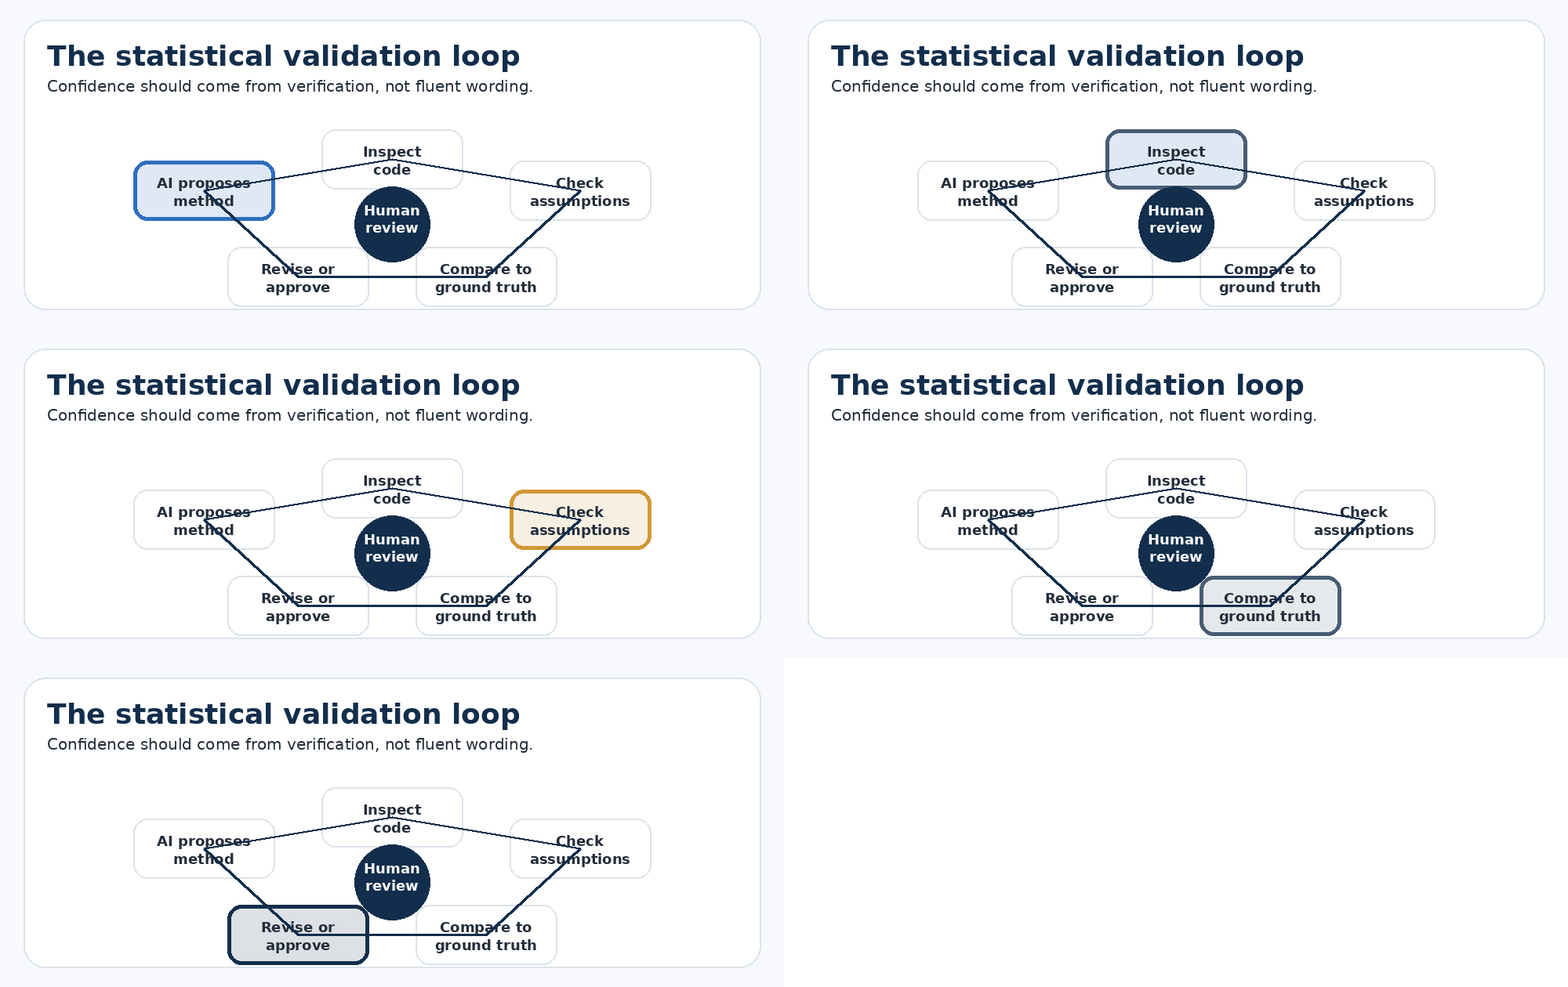
Validate Before Acting
Require the tool to show the code, transformations, excluded rows and assumptions. Then compare the result with an independent calculation in R, Python or another trusted system.
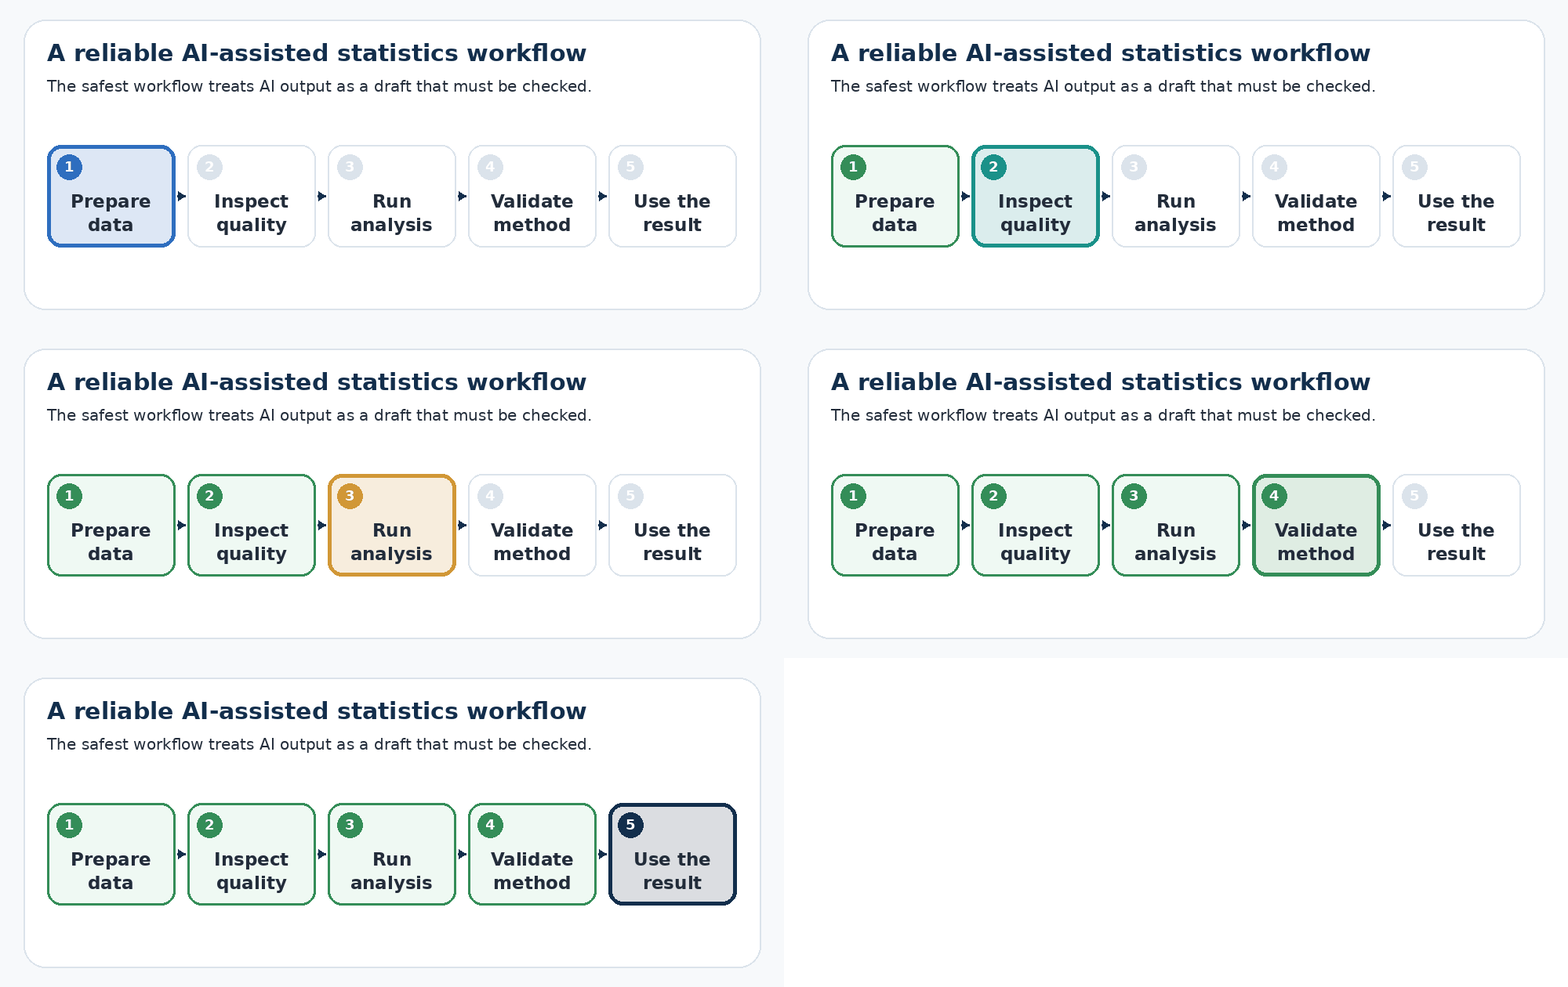
How to Perform Statistical Analysis With an AI Tool
Preserve and Describe the Original Data
Keep an untouched copy, document what each column means and identify the unit of observation. Remove confidential fields that are not necessary for the analysis.
Inspect Data Quality
Ask for dimensions, data types, missing values, duplicate records, impossible values, inconsistent labels, outliers and likely join keys. Review the output rather than accepting automated cleaning silently.
Confirm Every Transformation
Require a record of recoding, exclusions, imputation, aggregation and table joins. A correct statistical test applied after an incorrect join is still a wrong analysis.
Review Descriptive Statistics First
Examine group sizes, distributions, central tendency, variability and charts before moving to inferential tests. This often reveals data errors or design problems earlier.
State the Research Design Clearly
Identify the outcome, predictors, comparison groups, sampling approach and whether observations are independent, paired, repeated or clustered. These details determine the valid method.
Challenge the Proposed Test
Ask why the method was selected, which assumptions apply and what alternative should be used if those assumptions fail. Do not accept a test simply because the code executes.
Request Complete Results
Where applicable, request the test statistic, degrees of freedom, P-value, effect size, confidence interval, diagnostics and exact code. A lone P-value is rarely enough for a sound decision.
Run Sensitivity Checks
Ask for an independent calculation, robust alternative, residual analysis, outlier sensitivity or revised specification. For predictive work, compare against a baseline and inspect leakage and cross-validation.
Interpret Results in Context
Separate statistical significance from effect size, causation, business value and decision risk. A statistically detectable effect may still be too small or too uncertain to matter.
Export a Reproducible Record
Save the cleaned data, code, prompts, outputs, assumptions, limitations, product plan, model version and analysis date. Reproducibility is the difference between a useful workflow and an impressive but disposable answer.
Statistical Methods AI Analysis Tools Can Perform
Code-capable systems can perform descriptive statistics, correlation analysis, linear and logistic regression, t-tests, chi-square tests, ANOVA, nonparametric comparisons, time-series forecasting, classification, clustering, anomaly detection, Monte Carlo simulation, survival analysis and other methods when suitable libraries are available.
Capability is not validity. A system may execute a regression while using the wrong unit of analysis, ignoring repeated observations, overlooking data leakage or treating an association as causal. The decisive feature is whether the data preparation, method, assumptions and interpretation can be checked.
What AI Statistical Analysis Tools Can and Cannot Do
AI tools are effective at writing routine code, inspecting datasets, translating plain-language questions, generating visualizations, explaining formulas, documenting transformations and exploring several analytical approaches quickly.
They are less dependable when the study design is unclear, variable definitions are ambiguous, causal assumptions are unstated or the correct method depends on domain knowledge not contained in the data. A fluent explanation cannot resolve missing context.
Human review is essential when findings affect medical care, public policy, employment, credit, safety, regulated reporting, academic publication or major financial decisions.
Common Mistakes When Using AI for Statistical Analysis
The most damaging mistake is uploading poor-quality data and asking the system to find insights. The AI may confidently analyze duplicates, inconsistent dates, incorrect joins, leakage variables or mislabeled categories.
Another mistake is accepting the first statistical test. Ask the tool to explain the design assumptions, report alternatives and show the exact code. Do not confuse correlation with causation or statistical significance with practical importance.
Confidential data requires additional care. Remove unnecessary identifiers, use an approved environment and verify current retention and model-training terms before uploading proprietary information.
Privacy, Security and Governance Considerations
Safe use depends on the product plan, contract, configuration and type of data. Enterprise platforms may provide role-based access, audit logs, regional controls, private networking or self-managed deployment options that are absent from consumer subscriptions.
Governance also means analytical consistency. Power BI, ThoughtSpot, Looker, Databricks and similar platforms can ground questions in approved metrics, permissions and lineage. This reduces ambiguity, but it does not eliminate errors in the underlying model.
Regulated organizations should review the whole data path, including connectors, storage, code execution, logs, exports, third-party models and collaboration features. Compliance cannot be inferred from a general security claim on a marketing page.
Are AI Tools for Statistical Analysis Worth It in 2026?
They are worth using when they shorten data preparation, make code accessible, improve documentation, accelerate exploration or enable non-specialists to ask better questions. The productivity benefit is real when the workflow includes validation.
They are less valuable when an organization has not defined its metrics, cleaned its data, established permissions or assigned responsibility for reviewing outputs. Adding an AI agent to an inconsistent data environment can produce incorrect answers more quickly.
A useful contrarian point is that a general assistant with visible, reviewed Python can sometimes be more auditable than a no-code product that hides transformations. Conversely, a governed BI platform can be safer for recurring metrics than repeatedly asking a general chatbot to rediscover the business logic. The conventional hierarchy of “specialized is always better” is therefore incomplete.
Final Verdict on the Best AI Tools for Statistical Analysis
Choose Julius AI when you need accessible, code-free statistical analysis from files. Choose Hex when analysts need inspectable SQL, Python, R, warehouse connections and reusable collaborative workflows. Use ChatGPT for fast exploration, Anomaly AI for recurring business reporting and Energent.ai when document extraction is the main bottleneck.
For governed enterprise BI, shortlist Power BI Copilot, ThoughtSpot Spotter, Tableau or Looker according to the existing data ecosystem. For predictive models that must be deployed and monitored, choose DataRobot or Databricks.
The best AI tools for statistical analysis are not the ones that produce the most polished answer. They are the tools that perform the required method, expose enough logic to be checked, fit the data environment and produce work that the user can reproduce, govern and maintain. Before buying, test two finalists on the same representative dataset and compare both against an independent ground truth.
You May Also Like GraphRAG vs RAG
FAQs
What is the best AI tool for statistical analysis?
Julius AI is the strongest dedicated no-code candidate, while Hex is better for analysts using SQL, Python or R. ChatGPT is best for flexible one-off exploration, and DataRobot or Databricks is better for production predictive modeling.
Which AI statistics tool is best for non-coders?
Julius AI is the most direct choice for guided statistical analysis. ChatGPT is broader and more flexible, but the user may need clearer prompts and closer review.
Can ChatGPT perform statistical analysis?
Yes. ChatGPT can write and execute Python for data cleaning, visualization, regression, hypothesis testing, forecasting and other methods. Important results still require validation.[5]
Can AI perform regression and hypothesis testing?
Yes, when the platform has built-in statistical functions or code execution. The user must still confirm the design, variables, assumptions and interpretation.
Which AI tool is best for Excel data analysis?
Use Julius for accessible statistical tests, ChatGPT for custom exploration, Gemini when the workflow should stay in Google Sheets and Anomaly AI for recurring workbook-based reporting.
Which AI tool is best for academic research?
Julius, ChatGPT and Claude can assist, but final research should preserve reproducible scripts, assumptions, effect sizes, confidence intervals and a record of AI-assisted decisions.
What is the best AI tool for predictive analytics?
DataRobot is a strong governed AutoML choice. Databricks is better for technical teams that need greater control, scale, pipelines and deployment.
Can AI analyze SPSS, CSV and Excel files?
CSV and Excel are widely supported. SPSS .sav support varies and may depend on a compatible Python or R package, so users should verify the product and plan.
Are AI-generated statistical results accurate?
They can be accurate, but they are not inherently reliable. AIDABench found that even the best evaluated model completed only 59.43% of complex end-to-end analytics tasks on its first attempt.[31]
Can AI choose the correct statistical test?
AI can recommend a test, but the recommendation may fail when the sampling method, dependence structure, research objective or study design is unclear.
What is the best free AI tool for data analysis?
ChatGPT, Claude, Julius AI and Anomaly AI all offer free access with different limits. The best free option depends on the file size, required method and need for saved or recurring outputs.
Is Julius AI better than ChatGPT for data analysis?
Julius AI is more focused on guided statistics and file analysis. ChatGPT is broader and often more flexible for custom code, unusual methods and iterative explanations.
Is Hex better than Julius AI?
Hex is better for professional teams using databases, SQL, Python, R, reusable notebooks and data applications. Julius is easier for code-free file analysis.
What is the difference between AI analytics and traditional BI?
AI analytics uses conversational instructions and generated code to explore or model data. Traditional BI emphasizes governed metrics, dashboards, permissions, refresh schedules and repeatable organizational reporting.
Can AI tools analyze PDFs and scanned research papers?
Yes, but extraction quality depends on layout, scan quality, tables and the product’s document-understanding technology. Extracted values should be reconciled with the source before statistical use.
Are AI statistical analysis tools safe for confidential data?
Not automatically. Safety depends on the vendor, plan, contract, retention settings, encryption, permissions, deployment model and the organization’s internal policy.
Will AI replace statisticians and data analysts?
AI will automate more preparation, coding, visualization and routine interpretation. It does not remove the need for study design, domain expertise, validation, governance and accountability.
References
[1] Julius AI Statistical Software.
[2] Julius AI Pricing.
[3] Hex Data Notebooks.
[4] Hex Pricing.
[5] OpenAI: Data Analysis with ChatGPT.
[9] Google: Collaborate with Gemini in Google Sheets.
[10] Microsoft: Copilot for Power BI Overview.
[11] Microsoft: Copilot with Power BI Semantic Models.
[12] Microsoft Power BI Pricing.
[13] ThoughtSpot Spotter.
[14] ThoughtSpot Pricing.
[15] Tableau Agent in Pulse.
[16] AI in Tableau Features.
[17] Looker Conversational Analytics.
[18] Looker Pricing.
[19] DataRobot Performance Monitoring.
[20] DataRobot Prediction Explanations.
[21] Databricks Genie Code.
[22] Databricks Pricing.
[23] Domo Data Science.
[24] Domo Pricing Guide.
[25] Akkio Platform.
[26] Akkio Pricing.
[27] Energent.ai Vendor Benchmark Claim.
[28] DABstep Research Paper.
[29] Anomaly AI Pricing.
[30] Anomaly AI Data Connectors.
[31] AIDABench Research Paper.