
Classification Models: Types, Metrics and Uses
Classification models are machine learning systems that predict which predefined category an observation belongs to. Instead of forecasting a continuous number, they assign a class such as spam or legitimate, fraudulent…
Classification Models: How They Work, Types and Evaluation
Classification models are machine learning systems that predict which predefined category an observation belongs to. Instead of forecasting a continuous number, they assign a class such as spam or legitimate, fraudulent or genuine, or cat, dog or bird.
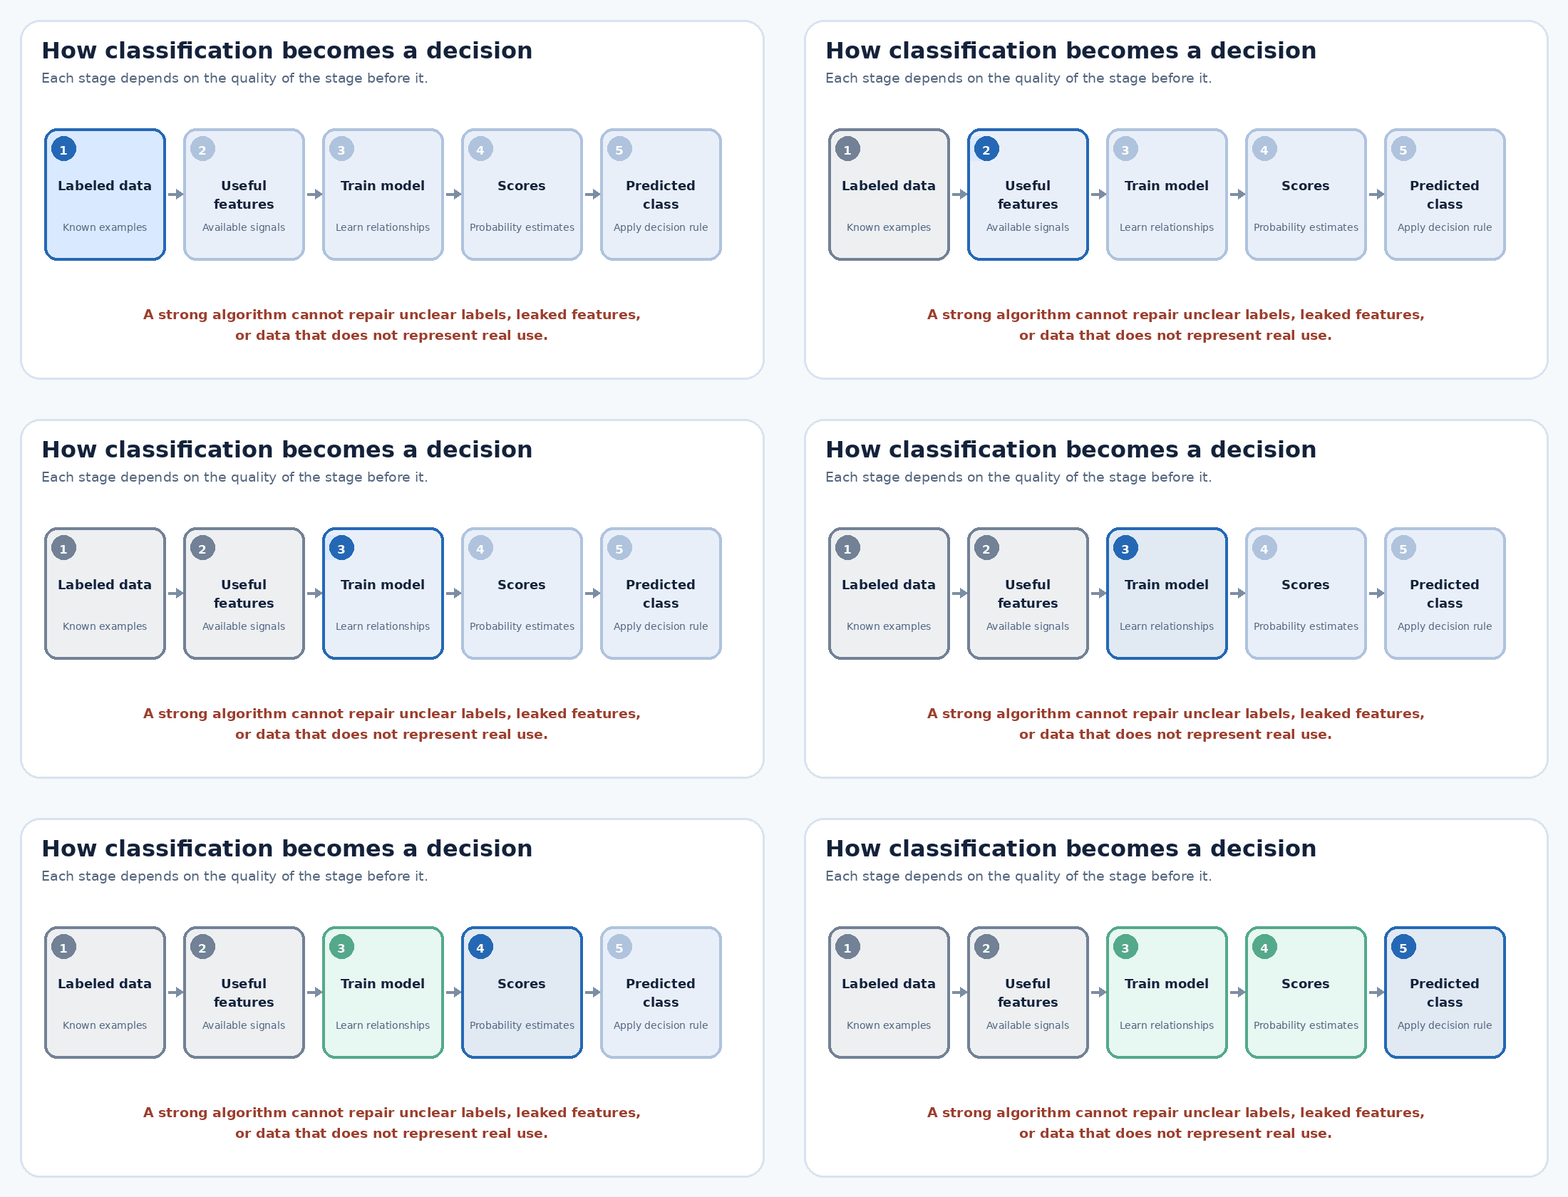
A useful classifier is more than an algorithm. It combines labeled data, features, model training, probability or score generation, a decision threshold, evaluation on unseen data, and monitoring after deployment. Google’s current Machine Learning Crash Course presents classification around this same progression from probability estimates to categories, thresholds, confusion matrices, and evaluation metrics.[1]
What Are Classification Models in Simple Terms?
Classification models predict categories rather than continuous numerical values. A bank may predict whether a transaction is fraudulent. An email service may decide whether a message belongs in the inbox or spam folder. A customer-success team may estimate whether an account is likely to churn within a defined period.
The possible outcomes are called classes. The recorded answer attached to each training example is its label, while the measurable inputs used to make the prediction are features. In a loan-default model, income, payment history, debt and account age may be features, while default and no default are the classes.
The terms classifier and classification model are often used interchangeably. More precisely, a classification algorithm is the learning method, such as logistic regression or a decision tree. The trained classifier is the fitted system that applies the learned relationships to new data.
Why Classification Models Matter
Classification converts historical records into decisions that can be repeated at scale. It can prioritize suspicious payments, route support tickets, identify likely defects, organize products, filter unwanted messages and highlight patients who may need further assessment.
The main benefit is not simply automation. A classifier can help an organization apply a consistent decision rule to large volumes of incoming cases. In higher-risk settings, however, it is often safer to use the model for triage or decision support rather than allowing it to make every final decision without review.
Consistency also does not guarantee fairness. Human decisions about what data to collect, which cases receive labels and how categories are defined can introduce bias. Google’s fairness guidance notes that selection, reporting, historical and other forms of bias can enter machine learning through data selection and curation.[13]
How Do Classification Models Work?
Supervised classification starts with examples that contain both input information and a known class. The model learns statistical relationships between the features and those labels, then applies the relationships to new observations.
Feature selection or feature extraction turns raw records into usable signals. Tabular features may include account age, income or transaction amount. Text systems may use word counts or embeddings. Image systems learn from pixel values and increasingly from representations produced by pretrained neural networks.
During training, the algorithm adjusts internal parameters to reduce prediction error. A linear model learns feature weights. A decision tree learns a sequence of splits. A nearest-neighbor model compares new examples with stored observations. A neural network learns several layers of transformations.
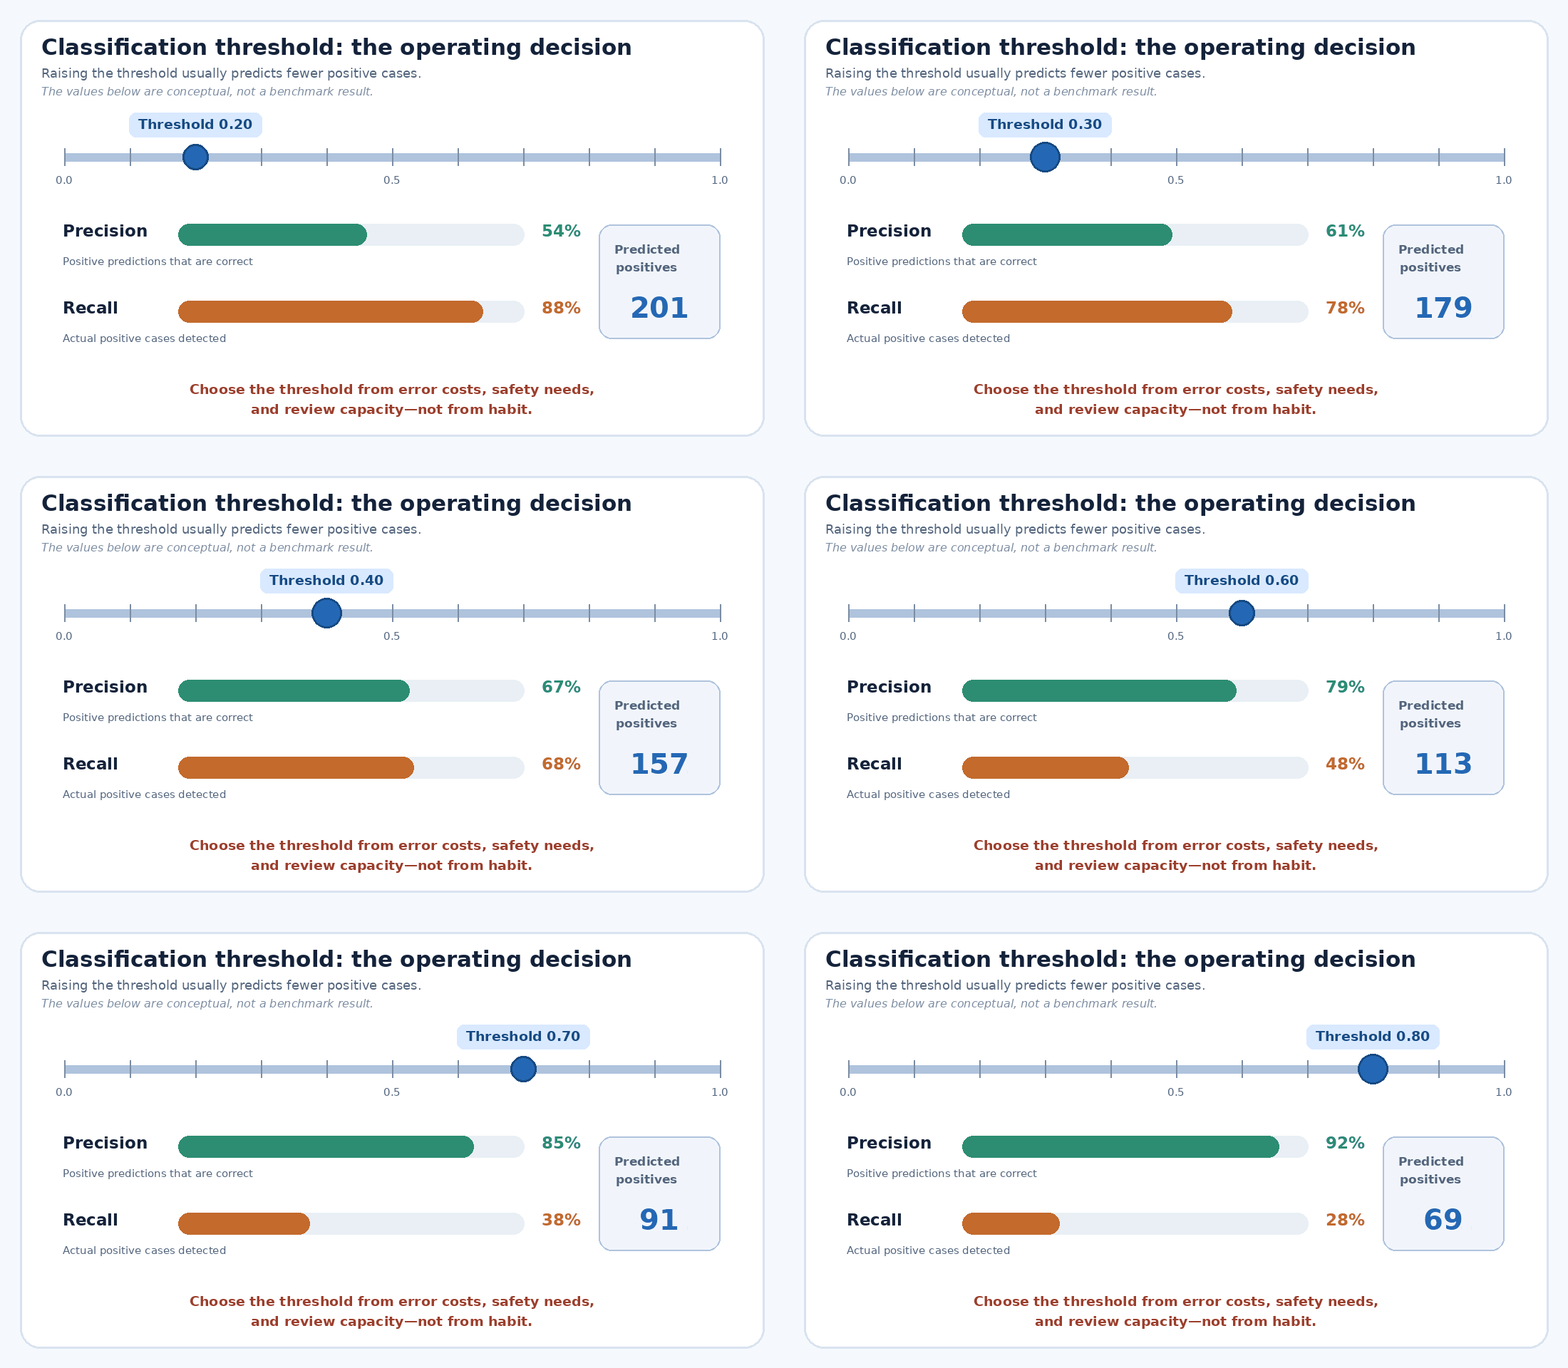
Many classifiers produce a score or class probability before they produce a label. A binary model may estimate a positive-class probability of 0.82, but the final output still depends on a threshold. Threshold selection changes the balance between false positives and false negatives, so it should reflect the action taken after the prediction.[2][3]
Evaluation must use data that was not used to fit the model. Cross-validation gives a broader view by training and evaluating across multiple splits, while a final test set provides a last estimate after model and threshold decisions have been made.[6] For time-ordered problems, ordinary random splitting can train on future records and evaluate on the past; time-aware validation avoids that mistake.[9]
After deployment, inputs, prediction rates, latency, downstream outcomes and data quality need monitoring. Production machine learning is a wider system in which the model is only one component, and changes in upstream data or user behavior can reduce performance.[12]
Core Concepts Behind Classification Models
Features are input variables, labels are the known answers attached to training records, and classes are the possible categorical outcomes. Clear class definitions are essential. If annotators disagree about what counts as a high-risk transaction, the model is learning an unstable target.
Training data fits the model. Validation data supports feature, hyperparameter and threshold decisions. Test data estimates performance after those choices are complete. Repeatedly consulting the test set turns it into another validation set and makes the reported result too optimistic.
A decision boundary separates regions assigned to different classes. Linear classifiers create linear boundaries in the feature space. Nonlinear systems such as trees, kernel methods and neural networks can represent more complex regions, although that flexibility can also fit noise.
A confidence score is not always a trustworthy probability. A well-calibrated classifier that assigns many cases a probability near 0.8 should be correct for roughly 80 percent of those cases. Scikit-learn recommends calibration analysis when probabilities are used for decisions and provides cross-validated calibration methods.[5]
A classification threshold converts a score into an operational decision. Lowering it usually catches more positive cases but creates more false positives. Raising it usually predicts fewer positives, often improving precision while reducing recall.[2][3]
Overfitting occurs when a model learns patterns that do not generalize beyond the training data. Underfitting occurs when the model or features are too limited to capture useful relationships. Cross-validation, regularization, pruning and early stopping help manage this trade-off, but none can compensate for a badly framed target or unrepresentative data.
Main Types of Classification Tasks
Binary classification contains two possible classes, such as spam and legitimate, churned and retained, or defective and acceptable. The output may be binary even though the underlying model produces a continuous score.
Multiclass classification selects one class from more than two mutually exclusive options. An image classifier might choose cat, dog or bird, while a support-routing model might choose billing, technical support, sales or account management.
Multilabel classification allows several labels to apply simultaneously. A film may be action, science fiction and comedy at the same time. Evaluation must account for partial correctness because a prediction may contain some correct labels and omit another.
Imbalanced classification occurs when one class is much rarer than another. Fraud, serious defects and uncommon medical conditions often have this structure. A model that always predicts the majority class can report excellent accuracy while detecting none of the cases that matter.
Ordinal classification uses classes with a meaningful order, such as low, medium and high risk. The categories are ordered, but the distance from low to medium is not automatically equal to the distance from medium to high.
Classification vs Regression vs Clustering
Classification predicts a predefined category. Regression predicts a continuous numerical value such as price, demand or delivery time. Clustering looks for groups in unlabeled data rather than predicting classes that were defined in advance.
The same business issue can sometimes be framed in more than one way. Predicting the exact number of days until a customer cancels is a regression task. Predicting whether the customer will cancel within 30 days is a classification task.
The correct choice comes from the decision the output must support. Avoid converting a meaningful numerical target into arbitrary categories merely because classification appears easier. That conversion discards information unless the categories correspond to real operational actions.
A related internal guide on regression models guide would help readers who are deciding whether their target is categorical or continuous.
Popular Classification Algorithms Explained
Logistic regression is a linear classifier despite its name. It is fast, widely understood and often a strong baseline for binary or multiclass work. Its coefficients can support interpretation, but correlated features, transformations and regularization can make simplistic coefficient explanations unreliable.
Decision trees learn nested feature-based rules. Small trees are easy to visualize and can capture nonlinear interactions without feature scaling. Deep trees can overfit and become difficult to explain, so depth limits and pruning are often important.[15]
Random forests average predictions from many trees trained with variation in records and features. This reduces the instability of a single tree and can improve generalization, although a forest can still overfit noisy data and is less transparent than a compact tree.[16]
Gradient boosting builds trees sequentially so that later stages improve the current ensemble. XGBoost and LightGBM provide production-oriented implementations for binary and multiclass classification. Their performance can be strong on structured data, but tuning depth, learning rate, regularization and boosting rounds adds complexity.[17][18]
Support vector machines seek a separating boundary with a large margin. Linear SVMs can perform well with high-dimensional sparse text, while kernel SVMs represent nonlinear boundaries. Their decision scores are not automatically calibrated probabilities.
K-nearest neighbors predicts from nearby training examples. It is intuitive but sensitive to feature scale, distance choice and irrelevant dimensions. Prediction can also become expensive because new cases must be compared with stored records.[19]
Naive Bayes applies Bayes’ theorem under a strong conditional-independence assumption. That assumption is rarely exact, but the method remains fast and useful for suitable text and count-based data.[20]
Neural networks learn layered nonlinear representations and are central to modern image, audio and language classification. Their flexibility comes with greater data, compute, tuning and explainability demands. A neural network is justified when the gain is large enough to support those operational costs.
Linear vs Nonlinear Classification Models
Linear models combine features through learned weights and create linear decision boundaries. They train quickly, work well with many sparse text problems and provide a useful benchmark for more complex systems.
Nonlinear models capture interactions, curved relationships and segmented decision regions. Trees, kernel SVMs, nearest-neighbor methods and neural networks fall into this broad group.
Theoretical flexibility does not guarantee better performance on unseen data. A nonlinear model may capture genuine structure, or it may memorize accidental patterns in a small dataset. The comparison should use the same validation procedure, preprocessing and decision metric.
A simpler model may be better when the dataset is small, explanations are required, predictions must be fast, maintenance resources are limited, or the performance difference is minor. The practical question is whether the extra gain justifies the added cost and risk.
How to Evaluate Classification Models
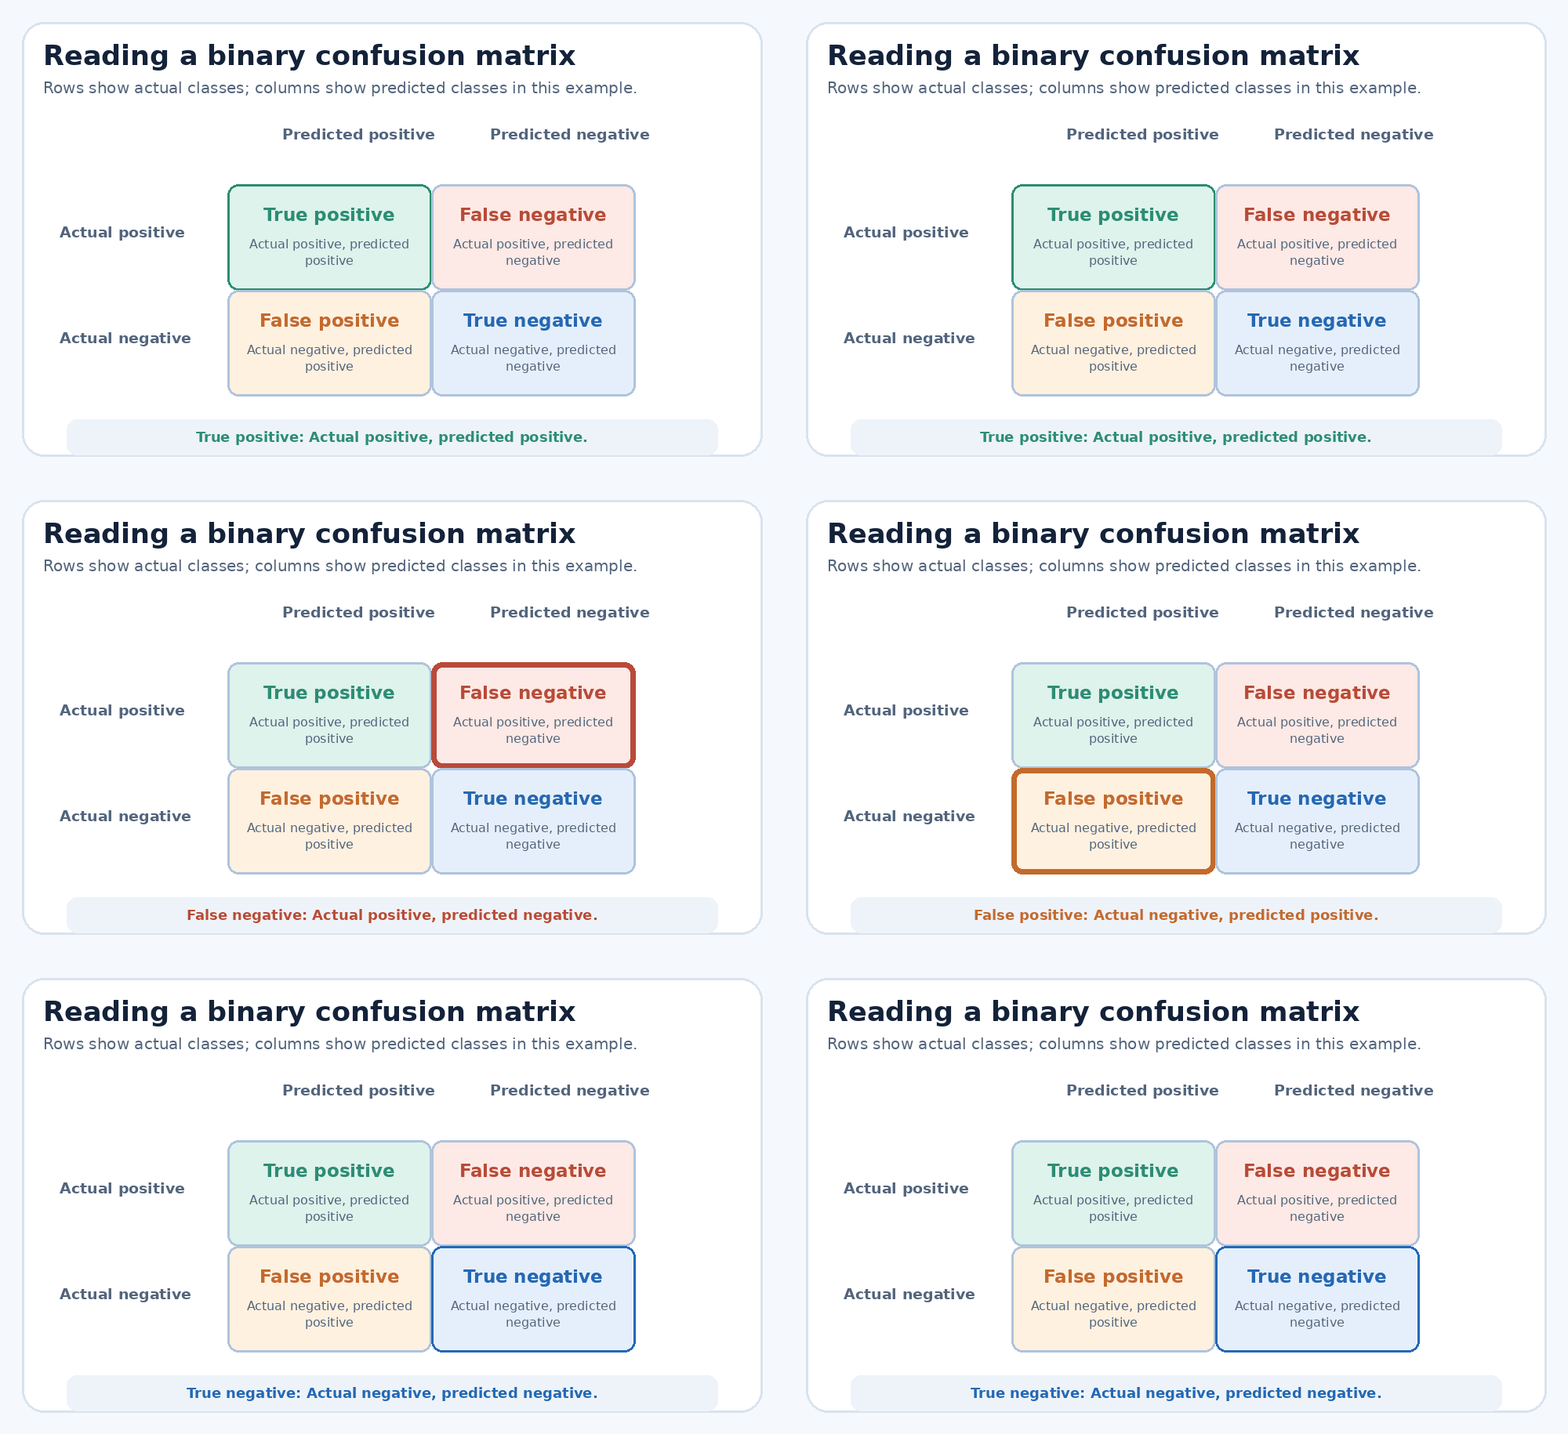
A confusion matrix counts true positives, true negatives, false positives and false negatives. In scikit-learn’s convention, rows represent actual classes and columns represent predicted classes, but other tools may reverse the axes, so readers should always check the labels.[8]
Accuracy is the share of all predictions that are correct: (TP + TN) / (TP + TN + FP + FN). It is most informative when classes are reasonably balanced and the costs of the two error types are similar.[2]
Precision is TP / (TP + FP). It asks how many positive predictions are genuinely positive. Precision matters when false alarms are expensive, such as blocking legitimate payments or hiding valid email.
Recall, also called sensitivity or the true positive rate, is TP / (TP + FN). It asks how many actual positive cases the model detects. Recall matters when missing a positive case is especially harmful.[2]
The F1 score is the harmonic mean of precision and recall. It is helpful when both matter and the positive class is important, but it ignores true negatives and assumes equal weight for precision and recall.[2]
Specificity is TN / (TN + FP), which measures how well the model identifies negative cases. In binary classification, it is the negative class’s recall.
The ROC curve plots true positive rate against false positive rate across thresholds. ROC-AUC summarizes ranking performance rather than performance at one selected threshold. For heavily imbalanced data, a precision-recall curve may reveal more about positive-class performance.[4]
Log loss evaluates the probabilities assigned to the correct classes and penalizes confident mistakes. Calibration curves and Brier scores add information when the probabilities themselves drive prioritization, pricing, resource allocation or risk decisions.[5][7]
Which Classification Metric Should You Use?
Use accuracy as one part of the evaluation when classes are balanced and the error costs are similar. Do not use it alone when a rare class carries most of the value or risk.
Prioritize precision when false positives trigger expensive or disruptive actions. Prioritize recall when missing a real positive is more harmful than investigating an additional false alarm.
Use F1 when precision and recall both matter and true negatives are not central to the decision. Use F-beta when one of those two metrics deserves more weight. For multiclass problems, report per-class results and explain whether macro, micro or weighted averaging was used.
ROC-AUC and PR-AUC help compare ranking ability across thresholds, but neither selects the operating threshold. The final threshold should connect model behavior with business costs, safety requirements, human-review capacity and the value of a correct intervention.
To let readers test different confusion-matrix values, add your own classification metrics calculator here. The calculator can help translate true positives, false positives, false negatives and true negatives into accuracy, precision, recall, specificity and F1 score.
How to Build a Classification Model Step by Step
Define the prediction goal before choosing an algorithm. State what is being classified, when the prediction will be made, which labels are possible and what action each label will trigger. “Predict risky customers” is vague; “predict whether an active customer will cancel within 30 days so the retention team can prioritize outreach” is testable.
Gather labeled data that represents the intended deployment population. Review whether important customer types, time periods, devices or locations are absent. More data does not repair systematic label errors or a sample that excludes the cases the model will face.
Clean missing values, duplicates, inconsistent formats and impossible ranges according to documented rules. Do not delete every unusual record automatically because rare cases may represent the outcomes the classifier is intended to find.
Encode categorical variables and scale features when the selected algorithms require it. All imputation, scaling, feature selection and encoding steps must be fitted on training data rather than on the full dataset.
Split data in a way that matches deployment. Keep records from the same customer, patient or device together when necessary. Use time-based evaluation when the model will predict future events. Scikit-learn’s common-pitfalls guidance emphasizes fitting preprocessing only on training data to prevent leakage.[10]
Establish a simple baseline, such as the majority class, a business rule or logistic regression. A complicated classifier that cannot meaningfully outperform a transparent baseline may not justify deployment.
Train a small, diverse group of candidate algorithms and compare them under the same cross-validation procedure. Tune hyperparameters using validation data, not the final test set. Select the threshold according to error costs or operational capacity, then evaluate the frozen model and threshold once on untouched test data.
Deployment should include versioning, input validation, prediction logging, performance monitoring and a fallback process. Ground-truth labels may arrive late, so teams may need temporary quality proxies while they wait for confirmed outcomes.
Real-World Applications of Classification Models
Email spam detection predicts whether a message is unwanted. False positives matter because a legitimate message may be hidden, so the threshold must balance catching spam with protecting valid mail.
Fraud detection identifies suspicious transactions or ranks them for investigation. Since fraud is often rare, accuracy alone is weak evidence. Review capacity, transaction value, customer disruption and delayed fraud confirmation all affect the operating decision.
Credit-risk and loan-default classification estimates whether an applicant or borrower may default. Predictive performance is only one requirement; explanation, fairness, privacy, auditability and applicable regulation may determine whether the model can be used.
Medical classification can support screening, diagnosis and triage. A screening tool may prioritize recall, while a confirmatory process may require stronger precision. Technical evaluation does not by itself establish clinical safety, so domain validation and professional oversight remain necessary.
Customer-churn classification predicts who may cancel or stop purchasing. The most useful target may not be who is likely to leave, but who is likely to leave and can realistically be influenced through an available retention action.
Text classifiers label sentiment, topics and support requests. Traditional supervised classifiers remain efficient for stable taxonomies with labeled data. Modern zero-shot systems can classify text against candidate labels without task-specific examples, but they rely on pretrained models and require their own testing for consistency, latency and cost.[21]
Image classifiers assign a category to an image, while object-detection systems also locate objects. Manufacturing quality systems classify defects, and cybersecurity classifiers identify suspicious files, messages or behavior. Both environments change over time, which makes monitoring and error review essential.
Common Classification Problems and Mistakes
Using accuracy on a heavily imbalanced dataset is one of the most common errors. Consider 1,000 transactions containing 10 fraud cases. A model that labels every transaction as genuine achieves 99 percent accuracy while producing zero fraud recall.
Low-quality labels create a hard limit on model performance. Ambiguous guidelines, inconsistent annotators and outdated class definitions teach the model a target that the organization itself has not defined clearly.
Data leakage creates results that cannot be reproduced in practice. Common examples include preprocessing before the train-test split, including post-outcome information as a feature, and placing records from the same entity on both sides of the evaluation.
Ignoring class imbalance can produce a classifier that performs well on the majority and poorly on the cases that matter. Class weighting, oversampling and undersampling may help, but they can change probability calibration and must be assessed on data with realistic class prevalence.
Accepting a default threshold without evaluation disconnects the model from the real decision. A fraud team that can inspect 100 cases per day needs a threshold or ranking rule that respects that capacity.
Excessive complexity can improve the training score while reducing stability, interpretability and maintainability. Correlation also should not be described as causation: a feature may predict an outcome without causing it.
Finally, failing to monitor drift assumes the future will resemble the original test set. Product changes, policies, user behavior and data pipelines can alter the relationship between inputs and outcomes.
Limitations and Risks of Classification Models
Classification models depend on the quality and relevance of their training data. A larger dataset is not automatically better if it repeats the same bias, misses new populations or uses inconsistent labels.
Historical data can encode unequal treatment or selective measurement. Removing protected attributes does not guarantee fairness because other variables may act as proxies. Fairness evaluation should examine outcomes and error rates for relevant groups where that analysis is appropriate and lawful.[13][14]
Probabilities do not guarantee certainty. Even a calibrated 90 percent estimate will be wrong in some cases, and the estimate can become unreliable when the deployment population differs from the training data.
High-performing ensembles and neural networks can be difficult to explain. Explanation tools may describe influential features, but they do not turn a predictive association into a causal reason.
Performance can decline through data drift, concept drift or changes in the surrounding software system. Retraining is not automatically the remedy; teams first need to identify whether the cause is new behavior, broken inputs, label changes or a flawed monitoring signal.
Privacy, security and regulatory requirements vary by jurisdiction and use case. Systems involving health, credit, employment or identity data require qualified legal and domain review rather than generic machine learning advice.
How to Choose the Best Classification Algorithm
Start with the data structure. Linear models and tree ensembles are common baselines for tabular data. Linear SVM, logistic regression and Naive Bayes can be competitive for sparse text. Neural networks and pretrained representations are more common for raw images, audio and complex language.
Consider interpretability across the whole pipeline. A simple classifier placed after opaque feature transformations may not be simple to explain. When explanations or audits are required, a constrained model with stable features may be preferable to a small gain from a complex ensemble.
Measure training cost, prediction latency and memory in the intended environment. A model trained monthly can tolerate more training expense than a live system producing thousands of predictions each second.
Account for missing data, noisy variables and class imbalance. Different implementations handle these conditions differently, and native support does not remove the need to test error patterns and probability quality.
Compare candidates through the same cross-validation folds, preprocessing pipeline and evaluation metric. Report variation as well as the average. A slightly higher mean score with unstable results may be less dependable than a consistent baseline.
The best classification algorithm is the simplest one that meets the required precision, recall, calibration, latency, fairness, interpretability and maintenance standards on representative unseen data.
FAQs
What is a classification model in machine learning?
A classification model predicts which predefined class an input belongs to. It learns relationships between features and known labels, then applies those relationships to new observations.
What is the simplest classification algorithm?
Logistic regression is a common practical baseline because it is fast and comparatively interpretable. A shallow decision tree may be easier to visualize, but the simplest useful method depends on the data and audience.
Is logistic regression a classification model?
Yes. Logistic regression estimates a class probability and uses a threshold or class-selection rule to produce a categorical prediction.
What is the difference between binary and multiclass classification?
Binary classification chooses between two classes. Multiclass classification chooses one class from three or more mutually exclusive options.
Can classification models output probabilities?
Many can output probabilities or decision scores as well as labels. Not every score is calibrated, so probability quality should be tested before the values are interpreted as literal real-world risks.
Which metric is best for classification?
No single metric is best for every problem. The choice depends on class balance, false-positive and false-negative costs, probability requirements and the action taken after the prediction.
Why can classification accuracy be misleading?
A model can achieve high accuracy by predicting the majority class while missing every rare positive case. The confusion matrix and class-specific metrics reveal that failure.
How do you improve a classification model?
Start with the target definition, labels, data quality and validation design. Then consider better features, regularization, class weighting, threshold tuning, calibration, hyperparameter search or a different algorithm according to the errors found.
Can classification be performed without labeled data?
Standard supervised classification requires labeled examples. Semi-supervised learning combines labeled and unlabeled records, while zero-shot pretrained systems can apply candidate labels without task-specific examples. Clustering is the usual term for discovering groups without predefined labels.
Key Takeaways and Next Steps
Classification models are most useful when they support a clearly defined decision. Begin with precise classes, representative data and a simple baseline. Evaluate on unseen data with metrics that reflect the real consequences of false positives and false negatives.
Do not treat the algorithm, headline accuracy or default threshold as the entire solution. Probability calibration, human-review capacity, latency, fairness, maintenance and post-deployment monitoring may matter more than a small improvement in one benchmark score.
The defensible choice is the simplest classifier that performs reliably on representative data, supports the required action at an appropriate threshold and remains measurable after deployment. The next step is to define one prediction target, establish a baseline, choose a consequence-aware metric and test the complete workflow before investing in additional complexity.
You May Also Like Logistic Regression
References
[1] Google for Developers, “Classification,” Machine Learning Crash Course. https://developers.google.com/machine-learning/crash-course/classification
[2] Google for Developers, “Accuracy, recall, precision, and related metrics.” https://developers.google.com/machine-learning/crash-course/classification/accuracy-precision-recall
[3] Google for Developers, “Thresholds and the confusion matrix.” https://developers.google.com/machine-learning/crash-course/classification/thresholding
[4] Google for Developers, “ROC and AUC.” https://developers.google.com/machine-learning/crash-course/classification/roc-and-auc
[5] Scikit-learn, “Probability calibration.” https://scikit-learn.org/stable/modules/calibration.html
[6] Scikit-learn, “Cross-validation: evaluating estimator performance.” https://scikit-learn.org/stable/modules/cross_validation.html
[7] Scikit-learn, “Metrics and scoring: quantifying prediction quality.” https://scikit-learn.org/stable/modules/model_evaluation.html
[8] Scikit-learn, “confusion_matrix.” https://scikit-learn.org/stable/modules/generated/sklearn.metrics.confusion_matrix.html
[9] Scikit-learn, “TimeSeriesSplit.” https://scikit-learn.org/stable/modules/generated/sklearn.model_selection.TimeSeriesSplit.html
[10] Scikit-learn, “Common pitfalls and recommended practices.” https://scikit-learn.org/stable/common_pitfalls.html
[11] Scikit-learn, “Supervised learning.” https://scikit-learn.org/stable/supervised_learning.html
[12] Google for Developers, “Production ML systems” and monitoring guidance. https://developers.google.com/machine-learning/crash-course/production-ml-systems
[13] Google for Developers, “Fairness: Types of bias.” https://developers.google.com/machine-learning/crash-course/fairness/types-of-bias
[14] Google for Developers, “Fairness: Evaluating for bias.” https://developers.google.com/machine-learning/crash-course/fairness/evaluating-for-bias
[15] Scikit-learn, “Decision Trees.” https://scikit-learn.org/stable/modules/tree.html
[16] Scikit-learn, “Ensembles: gradient boosting and random forests.” https://scikit-learn.org/stable/modules/ensemble.html
[17] XGBoost, official documentation. https://xgboost.readthedocs.io/en/stable/
[18] LightGBM, official documentation. https://lightgbm.readthedocs.io/en/latest/
[19] Scikit-learn, “Nearest Neighbors.” https://scikit-learn.org/stable/modules/neighbors.html
[20] Scikit-learn, “Naive Bayes.” https://scikit-learn.org/stable/modules/naive_bayes.html
[21] Hugging Face Transformers, “Zero-shot classification” pipeline documentation. https://huggingface.co/docs/transformers/main_classes/pipelines
Try it in DataClue
Ready to run Classification Models?
Train machine learning classifiers with your choice of model, hyperparameters, and evaluation settings.
Run Classification Models