
Cluster Analysis: Methods, Steps, Examples and Uses
Cluster analysis is an unsupervised statistical and machine-learning method used to group similar data points into meaningful clusters. This guide explains how cluster analysis works, key methods such as K-means, hierarchical clustering and DBSCAN, how to choose the right number of clusters, validate results, interpret findings and apply clustering in real-world research, marketing, healthcare and data analysis.
Cluster Analysis: Methods, Steps, Examples and Uses
Cluster analysis is a statistical and unsupervised machine-learning technique used to group unlabeled observations according to similarity. The goal is to make observations within the same cluster relatively alike while keeping different clusters meaningfully distinct.
The method is useful for customer segmentation, exploratory research, healthcare studies, education, anomaly detection, and machine-learning workflows. Its value, however, depends less on pressing “run” and more on defining meaningful similarity, selecting an appropriate algorithm, and validating whether the resulting groups are stable and useful.
What Is Cluster Analysis in Simple Terms?
A simple definition of cluster analysis
Cluster analysis is a statistical and unsupervised machine-learning method that groups observations according to similarity. The goal is to create groups whose members are relatively alike while keeping different groups meaningfully distinct. Because the data are not supplied with target labels, the method is used to explore structure rather than predict a known class.
That definition sounds straightforward, but an important qualification is often missed: clusters are not simply waiting inside every dataset to be discovered. The variables chosen, the way they are scaled, the distance measure, and the algorithm all influence the structure that appears. This is why modern clustering libraries provide several methods rather than treating K-means as a universal solution. (Scikit-learn: Clustering user guide)
What makes a good cluster?
A useful cluster is internally coherent and externally distinguishable. In plain language, observations within a group should be similar enough to justify treating them together, while the difference between groups should be large enough to matter for the research or business question.
The definition of similarity depends on the problem. Customers may be compared by spending and purchase frequency, documents by vector similarity, and geographic observations by spatial distance or density. A cluster is therefore only as meaningful as the similarity concept used to create it.
Intracluster similarity and intercluster difference
Intracluster similarity describes how close observations are within the same cluster. Intercluster separation describes how distinct one group is from another. The silhouette coefficient combines both ideas by comparing an observation with its own group and the nearest competing group. Scikit-learn documents the coefficient on a scale from -1 to 1, where larger values indicate better separation under the selected metric. (Scikit-learn: silhouette_score)
A strong silhouette score is useful evidence, but it does not prove that the groups correspond to natural categories in the real world. It measures the geometry produced by the chosen data representation and clustering solution.
Why clustering is an unsupervised learning method
Clustering is unsupervised because no target label tells the algorithm what the correct group should be. This separates it from classification, where examples with known labels are used to train a predictive model.
The absence of labels makes cluster analysis valuable for exploration, but it also makes validation harder. There may be no external answer key against which the partition can immediately be checked.
Why Is Cluster Analysis Used?
Discovering structure that averages can hide
Descriptive statistics summarize a population, but they can hide meaningful subgroups. An average customer spend of $70 might combine one group spending around $25 with another spending around $120. Clustering asks whether the observations form useful patterns that are obscured by a single overall average.
It is particularly valuable when the analyst knows which features matter but does not know the group labels beforehand.
From segmentation to decision-making
Customer segmentation, patient phenotyping, educational research, biological exploration, document grouping, anomaly detection, and employee research can all use clustering. The common thread is not the industry; it is the need to organize unlabeled observations according to defensible similarity.
The practical value appears after the groups are interpreted. A cluster number by itself is not an insight. The result becomes useful only when the groups can be profiled, validated, and connected to an appropriate decision or research question.
When clustering adds more value than simple summaries
Cluster analysis is most useful when differences between potential groups matter. It is less useful when the data form a smooth continuum with no meaningful boundaries. In that case, forcing a three- or four-cluster solution may create a tidy presentation rather than a defensible representation of the population.
How Cluster Analysis Works From Question to Validated Decision
Define the objective before selecting an algorithm
The first step is to define what is being grouped and why. “Find customer clusters” is too vague. “Identify customer groups with sufficiently different purchasing patterns to support different retention strategies” gives the analysis a practical test of usefulness.
This objective also guides variable selection, validation, and interpretation. A technically elegant solution that cannot answer the original question is not a successful analysis.
Select variables that represent meaningful similarity
Features should be included because they represent the dimensions along which similarity matters. Adding every available variable usually increases noise. Including several nearly duplicate variables can also cause one concept to dominate the solution because it has effectively been counted multiple times.
A useful feature set is therefore a modeling decision, not merely a data-export decision.
Clean, transform, and scale the data deliberately
Missing values, data-entry errors, outliers, skewed variables, and incompatible scales can all affect the geometry of a clustering problem. Standardization is often appropriate when differences in units are arbitrary. For example, annual income measured in tens of thousands can dominate purchase frequency measured from 1 to 20 if raw Euclidean distance is used.
The conventional instruction to “always standardize” is incomplete. If absolute scale carries genuine domain meaning, automatic standardization can also remove useful information. The correct question is whether the scale should influence similarity.
Choose a distance or similarity measure
Euclidean distance is common for continuous numerical data, Manhattan distance sums absolute coordinate differences, and cosine similarity focuses on vector direction. Binary and categorical variables often require different encodings or similarity measures rather than arbitrary numeric codes.
IBM SPSS hierarchical clustering explicitly separates distance and similarity choices by measurement type, which is a useful reminder that the metric is part of the analytical model rather than a software default to ignore. (IBM SPSS Statistics: Hierarchical Cluster Analysis Method)
Select an algorithm that matches the expected structure
K-means favors compact centroid-based groups. Hierarchical clustering builds nested relationships. DBSCAN looks for density-connected regions and can label sparse observations as noise. Gaussian mixture models represent groups probabilistically. These methods solve related but not identical problems.
Scikit-learn’s clustering documentation and algorithm-comparison examples show that the same dataset can produce different partitions because algorithms respond differently to cluster shape, density, initialization, and parameter choices. (Scikit-learn: Clustering user guide; Scikit-learn: Comparing clustering algorithms)
Determine a plausible number of clusters
K-means requires the analyst to specify K, the number of clusters. The elbow method, silhouette analysis, hierarchical dendrograms, stability checks, and domain usefulness can all provide evidence. None should be treated as a universal automatic answer.
Some algorithms such as DBSCAN do not require K in advance, but they introduce other parameters that influence the result. Avoid assuming that removing K removes analyst judgment.
Validate, profile, and interpret the solution
After fitting the model, examine cluster sizes, separation, defining characteristics, and sensitivity to reasonable modeling changes. A useful solution should not collapse completely when the random initialization changes, a few observations are removed, or a plausible preprocessing choice is altered.
The final question is whether the groups make sense in the real problem. Statistical separation, stability, interpretability, and actionability are related but different standards.
Main Cluster Analysis Methods and When to Use Them
K-means clustering
K-means partitions quantitative observations into a predefined number of groups represented by centroids. The algorithm alternates between assigning observations to the nearest center and recalculating those centers until the solution stabilizes. Its objective is to reduce within-cluster squared distance, often called inertia or within-cluster sum of squares.
K-means is attractive because it is simple, scalable, and easy to interpret when clusters are compact. Its weaknesses include sensitivity to initialization, outliers, unequal variances, and non-spherical geometry. Scikit-learn provides explicit examples showing where these assumptions can produce unintuitive results. (Scikit-learn: K-means assumptions)
K-medoids clustering
K-medoids resembles K-means but represents each cluster with an actual observation rather than an arithmetic centroid. NIST documentation notes that this can make K-medoids more robust to noise and outliers in suitable settings. It is especially useful when a real representative observation is easier to interpret than a synthetic mean point. (NIST: Cluster Analysis)
Hierarchical cluster analysis
Hierarchical methods create a tree of nested groups. Agglomerative clustering begins with separate observations and merges them; divisive clustering starts with a larger group and splits it. The result can be represented by a dendrogram, which shows the sequence and distance of merges.
Linkage rules define the distance between clusters. Single linkage focuses on the nearest pair, complete linkage on the most distant pair, average linkage on average distances, and Ward’s method chooses merges that minimize the increase in within-cluster variation. These choices can produce different structures even with the same observations.
DBSCAN and HDBSCAN
DBSCAN defines clusters through dense neighborhoods rather than centroids. It can identify irregularly shaped groups and label sparse observations as noise. Scikit-learn documents `eps` and `min_samples` as key parameters, so the method avoids choosing K but still requires a defensible density definition. (Scikit-learn: Clustering user guide)
A single density threshold can struggle when groups have very different densities. HDBSCAN extends the density-based idea across varying density levels and is designed to recover more stable structure in such cases. (Scikit-learn: Clustering user guide)
Gaussian mixture models
Gaussian mixture models assume that observations arise from a combination of Gaussian distributions. Instead of forcing purely hard membership, they can estimate the probability that an observation belongs to each component. This is valuable when groups overlap and uncertainty about membership matters. (Scikit-learn: Gaussian mixture models)
Mixture models introduce distributional assumptions and model-selection decisions of their own, so probabilistic output should not be confused with guaranteed real-world categories.
TwoStep clustering in SPSS
IBM SPSS Statistics includes TwoStep clustering alongside K-means and hierarchical procedures. TwoStep is relevant for large datasets and workflows involving both continuous and categorical information. IBM documentation describes a preclustering stage followed by hierarchical merging of subclusters. (IBM SPSS Modeler: TwoStep clustering overview)
That makes TwoStep a practical option when a standard quantitative K-means workflow does not match the measurement structure.
Which clustering method fits which problem?
Use K-means when numeric data are reasonably compatible with compact centroid-based groups and a value of K can be justified. Use hierarchical clustering when the nested structure or dendrogram is important. Consider DBSCAN or HDBSCAN when irregular shapes and noise matter. Consider K-medoids when robust representative observations are useful, and mixture models when probabilistic membership is part of the question.
The most important rule is not to choose a method because it is popular. Choose it because its definition of a cluster matches the structure you are trying to discover.
K-Means Cluster Analysis Explained
How K-means assigns observations and moves centroids
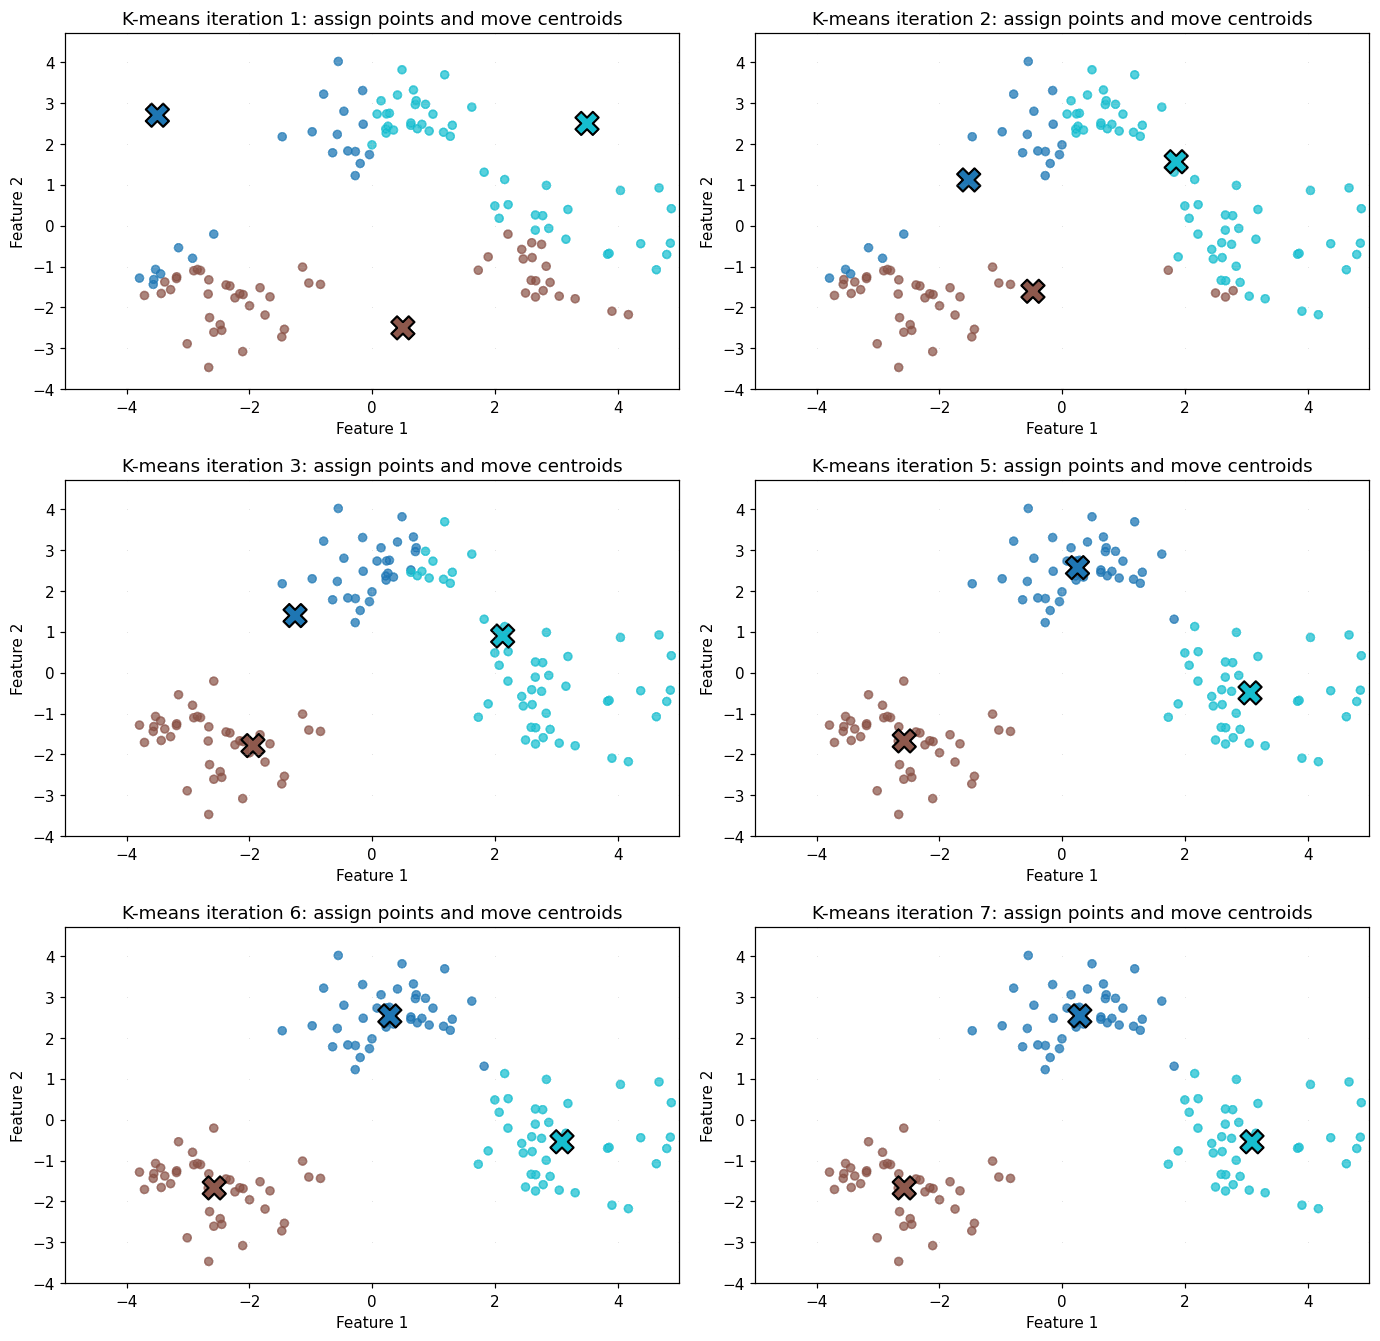
K-means begins with candidate centers, assigns each observation to the nearest center, recalculates each centroid using the assigned observations, and repeats the cycle. The animation below shows how the assignments and centroids can change across iterations before stabilizing.
Because the final solution can depend on starting centers, implementations commonly use improved initialization strategies and multiple starts. Even so, sensitivity to initialization remains a reason to check solution stability.
Why compact clusters suit K-means
The squared-distance objective rewards compact groups around a mean center. This works well for roughly spherical clusters with comparable spread, but it can split elongated groups or merge nearby groups with different densities. Scikit-learn’s K-means assumption examples make this limitation visually clear. (Scikit-learn: K-means assumptions)
K-means should therefore be understood as a model of a particular geometry, not a generic synonym for clustering.
Hierarchical Clustering and Dendrograms
How hierarchical merging works
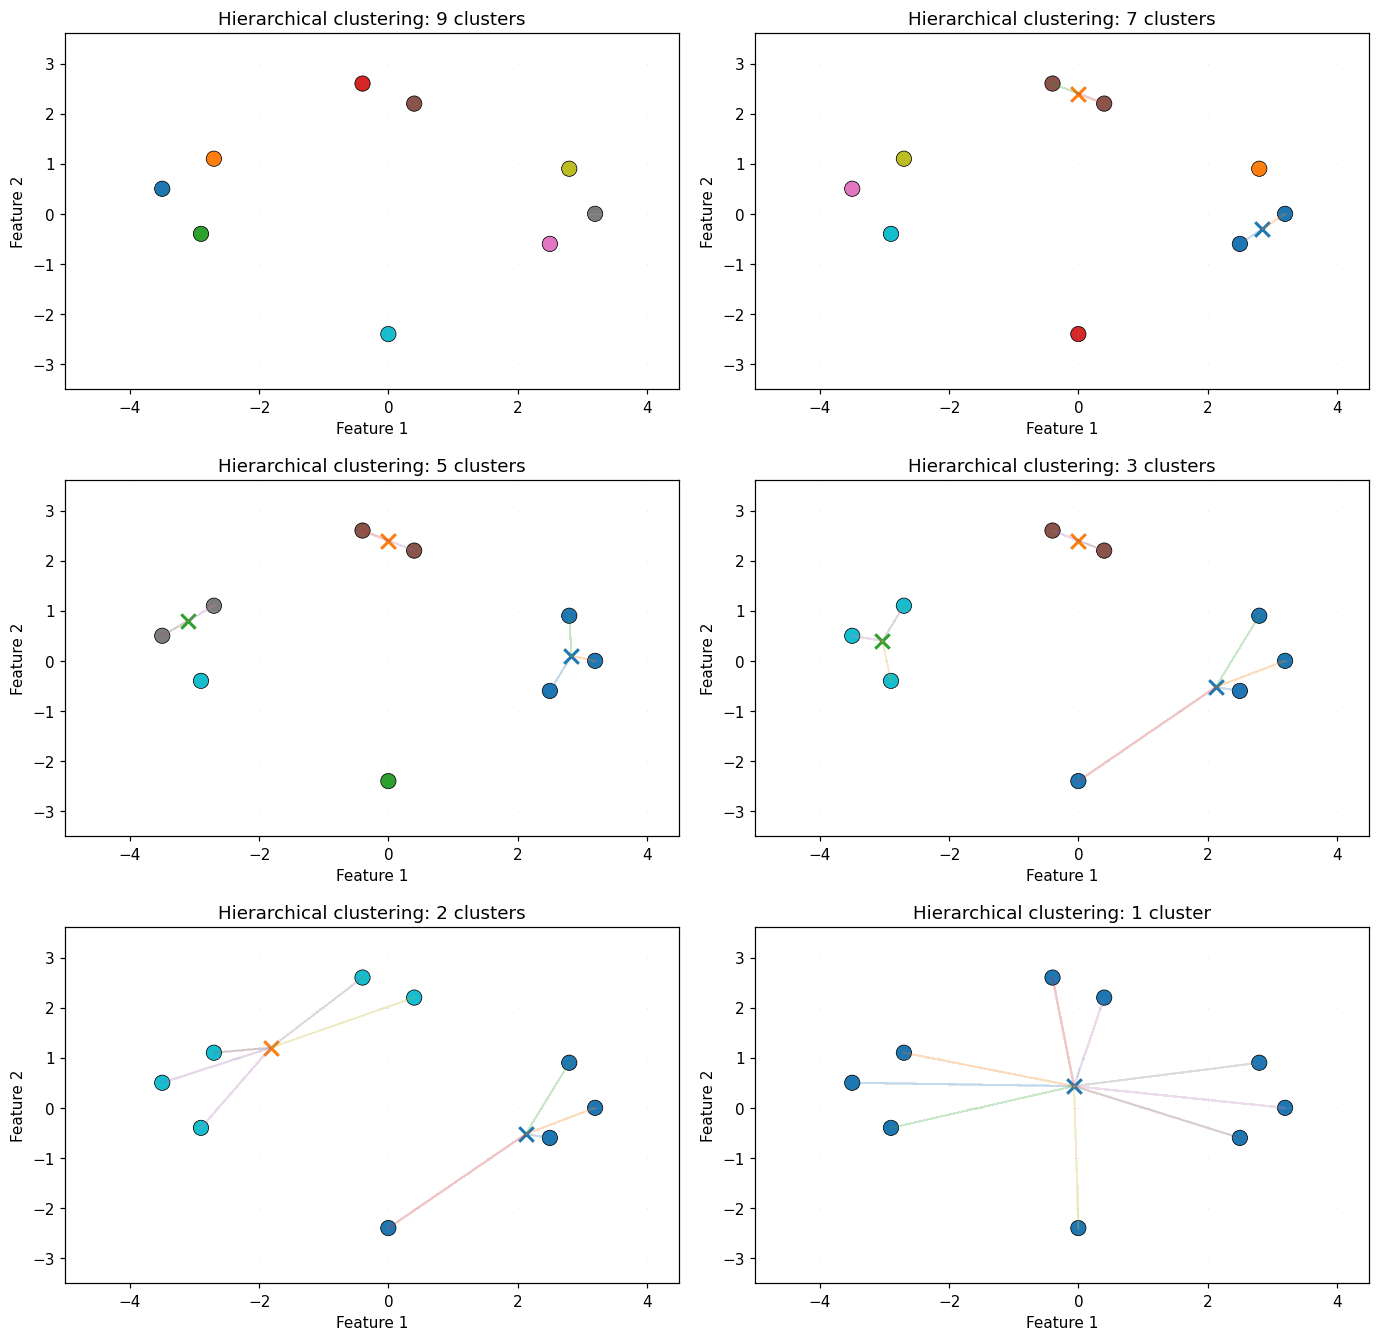
In agglomerative hierarchical clustering, every observation begins as its own cluster. The algorithm repeatedly merges the pair of groups considered closest under the selected linkage rule. The animation below illustrates how many small groups gradually become fewer, broader clusters.
The dendrogram records this history, so the analyst can inspect several possible cluster solutions rather than committing immediately to one K.
How to read a dendrogram without overinterpreting it
Large jumps in merge distance can suggest useful cut points, but a dendrogram is not a machine that announces the correct number of clusters. The chosen cut should still produce groups that are stable, interpretable, and relevant to the analytical objective.
This is especially important when several cut points look plausible. Different levels of the hierarchy may answer different questions.
Distance and Similarity Measures in Cluster Analysis
Euclidean, squared Euclidean, and Manhattan distance
Euclidean distance is ordinary straight-line distance through feature space. Squared Euclidean distance gives larger discrepancies more influence. Manhattan distance adds absolute feature-by-feature differences and can be more natural in problems where changes accumulate across dimensions.
The choice affects the geometry of the solution. Changing the metric can change which observations appear close, which can in turn change cluster membership.
Cosine similarity and high-dimensional representations
Cosine similarity compares vector orientation rather than raw magnitude. It is often relevant for text vectors and other high-dimensional representations where direction carries more meaning than absolute size.
High dimensionality introduces another problem: many distance measures become less discriminative as the number of dimensions grows. Dimensionality reduction can sometimes help, but it should preserve the information relevant to the clustering objective.
Categorical and mixed data need different treatment
If a dataset combines age, income, subscription type, and a yes-or-no behavior, simply converting categories to arbitrary integers and applying Euclidean K-means can create meaningless distances. Mixed-data approaches may use appropriate encodings, Gower-type dissimilarity, or software procedures designed for mixed measurement levels.
This is one of the most important practical differences between a textbook numerical example and real survey, customer, or clinical datasets.
How to Prepare Data for Reliable Clustering
Missing values and data quality
Missing values should be investigated rather than automatically replaced with zero. The correct treatment depends on the cause of missingness, the amount of information lost, and the requirements of the selected algorithm. Data-entry errors should be corrected before interpreting unusual observations as a new segment.
Standardization as a modeling decision
Standardization is useful when measurement units would otherwise dominate similarity. Scikit-learn’s preprocessing documentation describes standard scaling as centering features and scaling them by their standard deviation. Robust transformations may be preferable when extreme outliers strongly affect the mean and variance. (Scikit-learn: Preprocessing data)
The contrarian but evidence-consistent point is that standardization is not automatically correct. If a 10-unit difference in one variable truly should count more than a 1-unit difference in another, preserving scale can be defensible. What matters is the meaning of the distance after preprocessing.
Outliers, noise, and rare but legitimate cases
Outliers can shift centroids, distort scaling statistics, and produce tiny clusters. Removing them automatically can be just as misleading as ignoring them. An unusual point might be a data error, a valuable niche, a rare clinical profile, or genuine noise.
The right response depends on why the point is unusual and whether the chosen algorithm is designed to model noise explicitly.
Feature redundancy and dimensionality
Redundant features can unintentionally weight one concept several times. Highly dimensional feature spaces can also make distance less informative. Feature selection, domain-informed weighting, principal component analysis, or another reduction method may help, but each changes the representation on which similarity is calculated.
How to Determine the Optimal Number of Clusters
The elbow method
The elbow method compares within-cluster error over several values of K. As K increases, the error almost always falls because more clusters give the model greater flexibility. Analysts look for a point where the improvement begins to diminish sharply.
The weakness is that many datasets do not show a clear elbow. Treating a weak bend as a precise answer creates false certainty.
Silhouette analysis
The silhouette coefficient compares each observation with its own cluster and the nearest competing cluster. Scikit-learn recommends silhouette analysis as one way to study separation when selecting K. The metric is useful because it considers both cohesion and separation. (Scikit-learn: silhouette_score)
However, no silhouette threshold proves that the clusters represent real categories. A mathematically clean partition can still be irrelevant to the decision problem.
Dendrograms, stability, and domain usefulness
Hierarchical dendrograms provide another view of plausible group counts. Stability analysis adds a different question: do roughly the same groups appear when the sample, initialization, or preprocessing changes reasonably?
The strongest selection usually combines mathematical quality with stability and practical interpretability. A four-cluster solution may score slightly better than a three-cluster solution but be less useful if two of the groups behave identically in practice.
Why more than one solution can be reasonable
Clustering can reveal structure at different resolutions. Three customer groups may summarize broad behavior, while six groups identify useful subsegments. The existence of multiple reasonable solutions is not necessarily a flaw; it reflects the exploratory nature of the method.
The analyst should state which resolution was selected and why it fits the intended decision.
How to Interpret and Validate Cluster Analysis Results
Profile each group before naming it
Begin by comparing cluster size, central tendencies, distributions, and meaningful categorical characteristics. Names such as “premium loyalists” or “at-risk customers” are analyst-created interpretations, not labels discovered by the algorithm.
Good profiles describe what the data show without turning an exploratory segmentation into an unsupported personality judgment.
Test separation, cohesion, and stability
Internal validation metrics help evaluate whether observations are cohesive within clusters and separated from other groups under the selected metric. Stability checks ask whether the structure survives reasonable analytical changes.
A visually convincing scatter plot is therefore not enough. Published methodology on clustering validation emphasizes reproducibility and replication because neat partitions can still be unstable or sample-specific. (PubMed: Clustering validation and replication methodology)
Use sensitivity analysis instead of trusting one run
Rerun K-means with different starts, examine the effect of removing extreme points, test reasonable preprocessing alternatives, and compare another plausible algorithm where appropriate. The goal is not to make methods “vote,” but to learn whether an important pattern survives changes in assumptions.
If every reasonable change produces a completely different segmentation, the resulting labels should be treated cautiously.
Statistical fit is not the same as actionability
A segmentation can be mathematically strong yet operationally weak. If two customer clusters need the same offer, the same service level, and the same message, splitting them may add complexity without improving a decision.
A useful hierarchy is statistical separation, then stability, then interpretability, then actionability. Each stage asks a different question.
Real-World Applications of Cluster Analysis
Customer and market segmentation
A retailer might cluster customers using recency, purchase frequency, and average order value. The groups can then be profiled to see whether distinct retention or merchandising strategies are justified. The test is not whether the clusters have attractive names; it is whether they support different actions that can later be measured.
Healthcare and patient research
Researchers can use clustering to explore patient subgroups based on measured characteristics, symptoms, biomarkers, or response patterns. Because healthcare interpretations can affect consequential decisions, exploratory groups require careful external validation before they are treated as clinically meaningful categories.
Education and social science
Student or respondent groups may be explored using performance, engagement, attitude, or support variables. Analysts should avoid converting provisional clusters into fixed labels about individuals, especially when the group structure is unstable or the variables capture only part of the phenomenon.
Fraud, anomaly, document, and machine-learning workflows
Density-based clustering can help flag observations that fall outside dense regions, while document clustering can organize text representations by similarity. In machine-learning workflows, clustering can support exploration, preprocessing, representation analysis, or feature creation.
An unusual observation is not automatically fraudulent, and a machine-generated group is not automatically a meaningful class. Domain review remains necessary.
Cluster Analysis Example: Customer Segmentation Step by Step
Define the business question
Imagine an online bookstore wants to improve retention. The objective is not merely to “find customer types,” but to identify purchasing groups different enough to justify different retention strategies.
Choose and prepare customer variables
Assume the bookstore uses annual spending, purchase frequency, and days since the last purchase. Annual spending may range from $20,000 to $200,000 in a business dataset while frequency could range from 1 to 20. If raw Euclidean distance is used, the larger numerical scale can dominate the geometry.
Standardizing the variables can provide a fairer starting point when the unit differences are arbitrary. The analyst should still explain why each variable belongs in the segmentation.
Compare reasonable algorithms
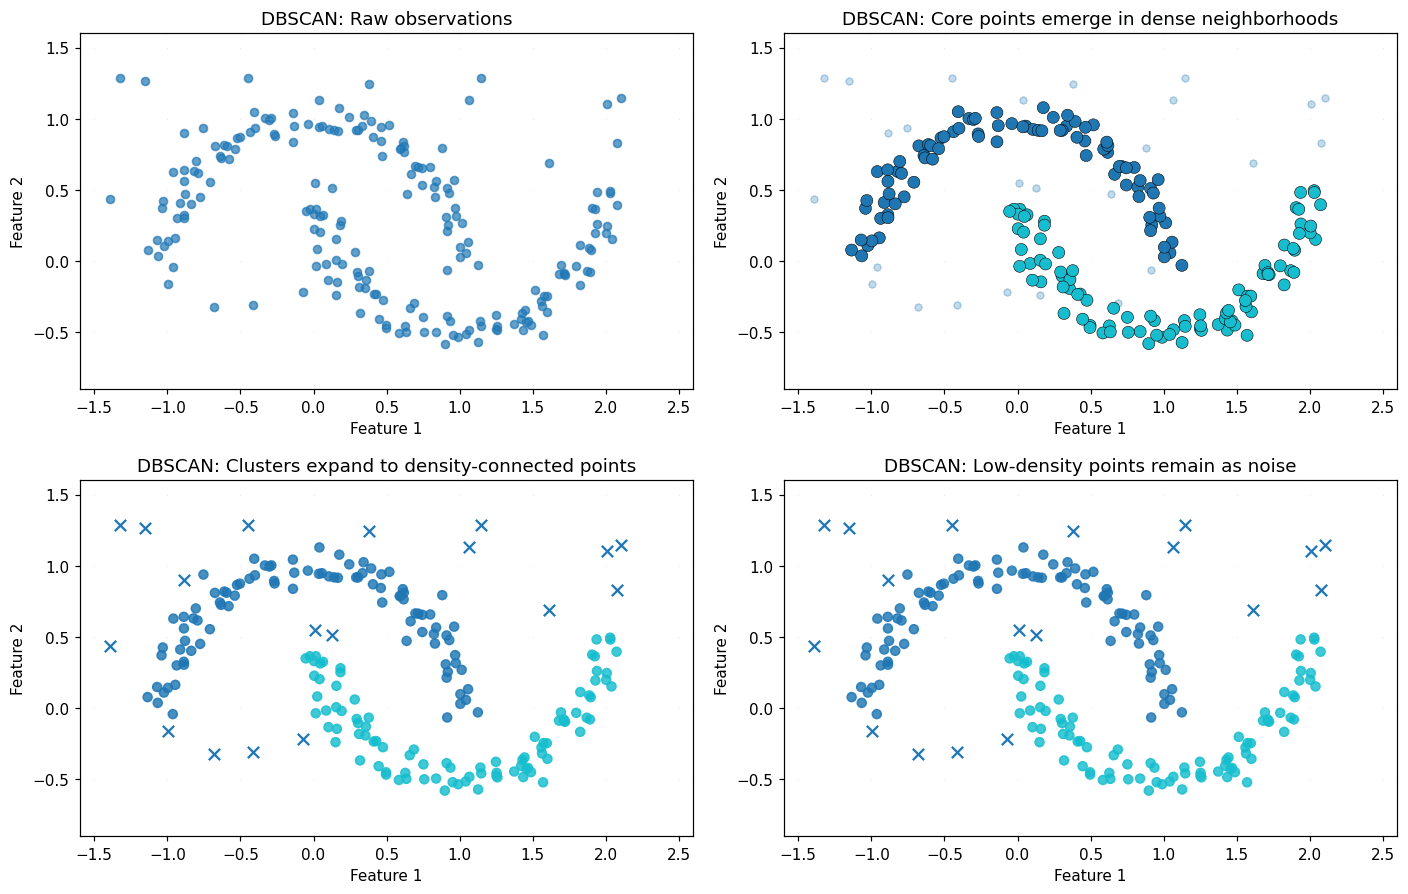
If exploratory plots suggest compact groups, K-means may be a sensible first model. Hierarchical clustering can provide a second view of the group structure. If the data show irregular shapes and sparse points, DBSCAN may produce a more natural partition.
The animation below illustrates the density-based perspective: dense neighborhoods expand into clusters while isolated observations can remain labeled as noise.
Evaluate competing solutions
Suppose both three- and four-cluster solutions look plausible. Four clusters may slightly improve an internal metric, but if two groups have almost identical behavior and require the same retention strategy, three stable groups may be the stronger business decision.
This illustrates why the optimal numerical score and the most useful segmentation are not always identical.
Turn the profiles into testable actions
The final groups might describe frequent high-spend customers, occasional high-spend customers, and infrequent low-spend customers. The bookstore can design different communications for those groups and then measure whether the segmentation improves retention, response, or revenue.
That post-analysis measurement matters. Clustering generates a hypothesis about useful structure; business outcomes test whether the structure deserves to remain operational.
Cluster Analysis vs Factor Analysis
Cluster analysis groups observations; factor analysis reduces variables
Cluster analysis usually asks which cases or observations belong together. Factor analysis asks whether correlations among many observed variables can be represented by a smaller number of underlying factors.
For example, clustering may group customers, while factor analysis may combine several survey questions into broader dimensions such as service confidence or satisfaction.
When the two methods can work together
Factor analysis can sometimes reduce a large correlated survey into a smaller set of interpretable dimensions, after which clustering is applied to those factor scores. This can make a segmentation easier to interpret and reduce redundant information.
It is not a mandatory sequence. Use factor analysis first only when the variable-reduction problem genuinely exists.
Cluster Analysis vs Classification
Unsupervised discovery vs supervised prediction
Classification predicts known labels from training examples. Clustering explores group structure without those labels. If historical transactions are already marked as fraudulent or legitimate and the goal is to predict future fraud, supervised classification is usually the more direct formulation.
Use clustering when the groups are unknown and discovering possible structure is the objective.
Can cluster membership be used later?
Cluster membership can sometimes be used as an input to later analysis, but the workflow should be validated carefully. Some clustering approaches do not naturally provide a rule for assigning new observations, and unstable clusters can create unstable downstream features.
The practical question is not only whether cluster labels can be saved, but whether the same definition remains valid when new data arrive.
How to Conduct Cluster Analysis in SPSS
K-means in IBM SPSS Statistics
Current IBM SPSS Statistics documentation places K-means under Analyze, Classify, K-Means Cluster. The procedure is designed for quantitative interval- or ratio-level variables and requires the number of clusters to be specified. SPSS can save cluster membership and distances for later profiling. (IBM SPSS Statistics: K-Means Cluster Analysis)
K-means is useful when the dataset is large and the variables fit the method, but the software cannot decide whether the selected variables represent meaningful similarity.
Hierarchical clustering in SPSS
The hierarchical procedure provides linkage choices such as nearest neighbor, furthest neighbor, centroid approaches, and Ward’s method, together with distance or similarity measures for different data types. A dendrogram can be requested to inspect the sequence of merges. (IBM SPSS Statistics: Hierarchical Cluster Analysis Method)
The correct method and metric should be justified in relation to the measurement levels and analytical goal rather than left entirely to defaults.
TwoStep clustering in SPSS
TwoStep provides a workflow for larger data and mixed field types. IBM documentation describes a first stage that compresses observations into subclusters and a second stage that merges those subclusters hierarchically. (IBM SPSS Modeler: TwoStep clustering overview)
This can be practical for applied researchers dealing with both categorical and continuous variables, although automatic options should still be reviewed rather than treated as infallible.
How to report an SPSS clustering analysis
A defensible report should explain the variables, preprocessing, distance or similarity measure, clustering procedure, linkage method where relevant, rationale for the number of clusters, final cluster sizes, profiles, and validation approach.
Reporting only the final SPSS table omits the analytical decisions that most strongly determine what the clusters mean.
Common Mistakes and Limitations of Cluster Analysis
Assuming every dataset contains natural groups
An algorithm can partition a dataset even when the underlying structure is weak. Producing cluster labels does not prove that discrete natural populations exist. This is the central limitation readers should understand before treating cluster output as ground truth.
Using incompatible scales or the wrong metric
A sophisticated algorithm cannot rescue a problem in which similarity has been defined poorly. Raw scales, arbitrary coding of categories, and unsuitable distance functions can dominate the result.
Preprocessing, measurement quality, and feature meaning often matter as much as the choice of clustering algorithm.
Ignoring outliers and unstable small clusters
Outliers can move centroids or create tiny groups. A small cluster may represent an important niche, but it may also disappear when the dataset changes slightly. Stability and domain relevance should determine how seriously it is interpreted.
Treating exploratory labels as proven categories
Cluster 1 and Cluster 2 are model outputs. Descriptions such as “high potential,” “difficult,” or “low risk” are interpretations created by people. These labels should be tied to observed characteristics and should not imply causal or diagnostic meaning that the analysis cannot support.
Searching for a universal sample-size rule
There is no single sample-size threshold that guarantees a reliable clustering solution. Recoverability depends on factors such as cluster separation, dimensionality, group imbalance, noise, and the selected method. Rules of thumb can support planning, but they should not be presented as universal statistical guarantees.
When Should You Use Cluster Analysis?
Use it when the groups are unknown
Cluster analysis fits exploratory segmentation when meaningful features are available but the labels are not. It is especially useful when the research question asks whether observations organize into distinct or partly distinct patterns.
Avoid it when another method directly answers the question
Use classification when known classes need to be predicted, regression when the goal is a continuous outcome, and factor analysis when the central problem is reducing correlated variables rather than grouping observations.
If you cannot explain what similarity should mean for your data, choosing a clustering algorithm is premature.
FAQs
What is cluster analysis in statistics?
It is a family of exploratory statistical methods that groups observations according to a defined similarity, distance, density, or probabilistic structure when the group labels are not known in advance.
What is the main purpose of cluster analysis?
The purpose is to discover potentially useful structure in unlabeled data. The result can support segmentation, exploratory research, anomaly analysis, or later modeling, but it does not automatically establish that the groups are natural or causal categories.
Is cluster analysis supervised or unsupervised?
It is generally an unsupervised learning approach because no known target class is provided during the clustering process.
How do you choose the number of clusters?
Use several sources of evidence where possible. Elbow plots, silhouette analysis, hierarchical structure, stability checks, and practical interpretability can complement one another. Avoid treating any single metric as an automatic answer.
What is the difference between K-means and hierarchical clustering?
K-means directly partitions observations into a specified number of centroid-based groups. Hierarchical clustering builds nested groups through a sequence of merges or splits and can display that structure in a dendrogram.
Can cluster analysis handle categorical data?
Yes, but not every method is suitable. Standard K-means expects quantitative variables, while mixed or categorical data may need another distance measure, encoding strategy, K-medoids-style approach, or a procedure such as TwoStep depending on the problem.
Which software can perform cluster analysis?
Common options include IBM SPSS Statistics, Python with scikit-learn and related libraries, R, MATLAB, SAS, and KNIME. The best tool depends less on the brand than on whether it supports the method, distance measure, validation workflow, and data types required for the analysis.
Cluster Analysis Summary and Practical Next Steps
Choose the question before the algorithm
The most important decision in cluster analysis happens before the model runs: define what you are grouping and what meaningful similarity should represent. That determines which variables, scales, metrics, and algorithms are defensible.
Validate before acting on the groups
Do not treat a clean visualization, a favorable silhouette value, or a software-generated cluster label as proof. Examine separation, stability, sensitivity to reasonable analytical changes, and the usefulness of the resulting profiles.
Successful cluster analysis is not primarily about producing a partition. It is about creating a defensible chain from the research question to meaningful similarity, from similarity to a suitable clustering method, and from the resulting groups to an interpretation or decision that remains useful when challenged.
Sources and Further Reading
Scikit-learn: Clustering user guide
Scikit-learn: silhouette_score
Scikit-learn: Comparing clustering algorithms
Scikit-learn: K-means assumptions
Scikit-learn: Preprocessing data
Scikit-learn: Gaussian mixture models
IBM SPSS Statistics: K-Means Cluster Analysis
IBM SPSS Statistics: Hierarchical Cluster Analysis Method
IBM SPSS Modeler: TwoStep clustering overview
PubMed: Clustering validation and replication methodology
You May Also Like Factor Analysis
Try it in DataClue
Ready to run Cluster Analysis?
Group similar observations into clusters based on their characteristics.
Run Cluster Analysis