
Friedman Test: When to Use It and How to Interpret It
Friedman Test Explained: Assumptions, Steps and Results
What Is the Friedman Test in Simple Terms?
The Friedman test compares related samples. Related means that the observations are connected, usually because the same participants are assessed under every condition or at every time point. In an experimental block design, each block may instead be a matched unit, judge, location, or other grouping that receives every treatment.
Rather than comparing raw means, the procedure ranks the observations within each subject or block and then compares the rank totals across conditions. NIST describes it as a non-parametric test for randomized complete block designs, while R documents it as a rank-sum test for unreplicated complete blocks [1, 2].
Typical questions include whether pain ratings change across three treatment stages, whether the same users rate three interfaces differently, or whether students perform differently under several teaching conditions.
When Should You Use the Friedman Test?
Use the test when the research question concerns an overall difference among at least three matched conditions and the outcome can be ordered. It is particularly useful for ordinal outcomes, such as ratings, and for continuous repeated measurements when a rank-based analysis is more defensible than a parametric repeated-measures model.
The decision should not be based only on a failed normality test. Study design, measurement scale, missing observations, distribution shape, outliers, sample size, and the meaning of the effect all matter.
- The same subjects or matched units appear in every condition.
- There are three or more related conditions or time points.
- The dependent variable is ordinal or continuous and meaningfully rankable.
- Subjects or blocks are independent of one another.
- A single omnibus comparison is a useful first step.
Non-parametric does not mean assumption-free. The Friedman test removes a normality requirement, but it still depends on a valid matched design, independent blocks, meaningful rankings, and appropriate follow-up analysis.
What Assumptions Does the Friedman Test Require?
Related measurements
Every subject or block must contribute a response under each condition. Ranking is performed within that block, not across the full dataset.
Independent blocks
Responses within a subject are related, but one subject’s responses should not determine another subject’s responses. NIST explicitly identifies independence between rows or blocks as a requirement [1].
Ordinal or continuous outcome
The dependent variable must preserve order. A category with no meaningful ranking is not suitable.
Complete repeated measurements
The classical design is complete: one observation is available for every subject-condition combination. Base R removes an entire block when a response is missing, so missing-data handling must be reviewed before analysis [2].
No normality assumption
Because the method is rank-based, it does not require normally distributed raw measurements [1, 2].
How Does the Friedman Test Work?
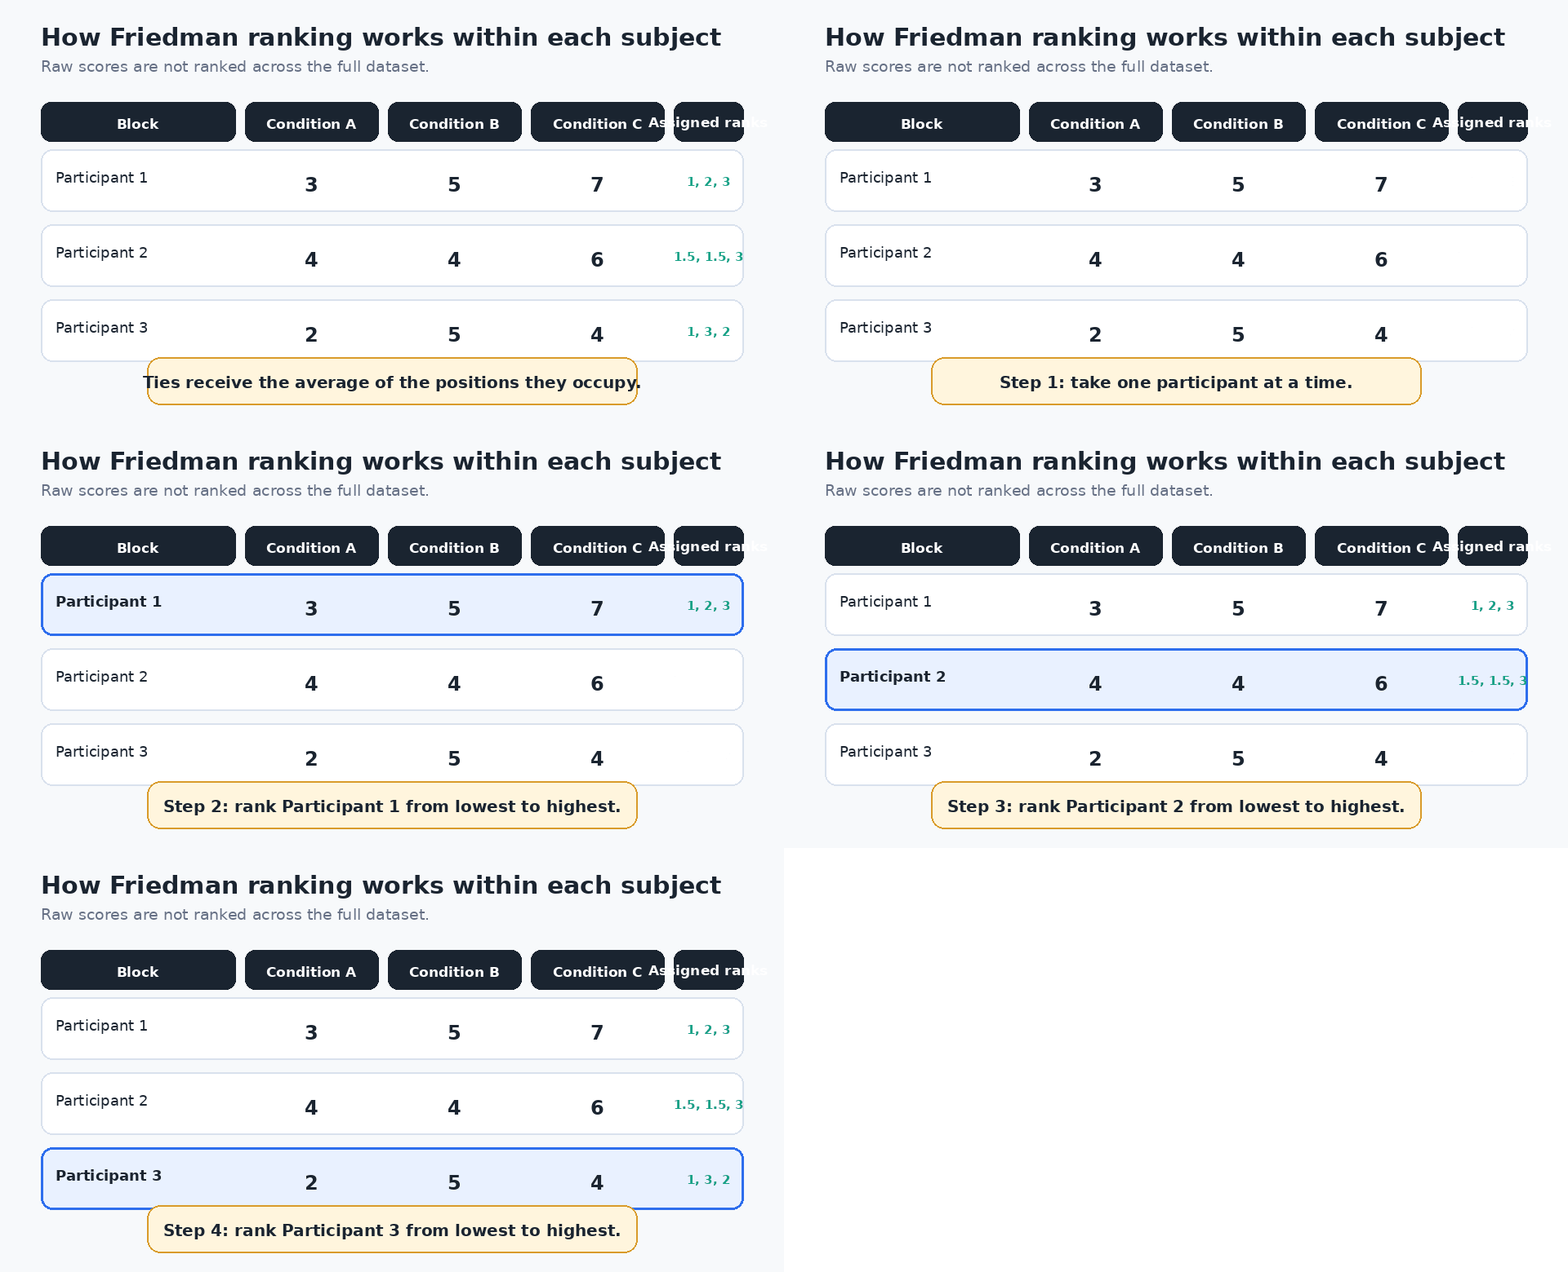
For each participant separately, the values are ordered and assigned ranks. With three conditions, the smallest value normally receives rank 1, the middle value rank 2, and the largest value rank 3. If two values are equal, they receive the average of the rank positions they occupy.
The ranks are then summed for each condition. Similar condition effects should produce similar rank sums. Greater separation among the rank sums produces a larger test statistic. Software normally applies a correction for tied observations [1, 3].
Here, n is the number of subjects or blocks, k is the number of conditions, and Rⱼ is the rank sum for condition j. The displayed formula is the common form for data without ties; software applies a tie correction when needed [1].
What Are the Null and Alternative Hypotheses?
The null hypothesis states that the related conditions have the same distribution or location after accounting for the blocks. The alternative states that at least one condition differs.
References phrase this in slightly different ways. SciPy describes equal repeated-sample distributions, R describes an equal location parameter after block effects, and IBM describes related samples drawn from the same population [2, 3, 4].
A significant result is therefore evidence of an overall difference, not proof that every pair differs. Interpreting the result specifically as a difference in medians is most defensible when the condition distributions have reasonably similar shapes and differ mainly in location.
How Do You Calculate a Friedman Test Step by Step?
The following is a hypothetical example created for calculation practice. Six participants provide scores under three conditions. Participant 2 has a tie, so the two equal values receive averaged ranks of 1.5.
| Participant | Condition A | Condition B | Condition C | Ranks A, B, C |
|---|---|---|---|---|
| 1 | 3 | 5 | 7 | 1, 2, 3 |
| 2 | 4 | 4 | 6 | 1.5, 1.5, 3 |
| 3 | 2 | 5 | 4 | 1, 3, 2 |
| 4 | 6 | 7 | 8 | 1, 2, 3 |
| 5 | 5 | 3 | 4 | 3, 1, 2 |
| 6 | 4 | 6 | 5 | 1, 3, 2 |
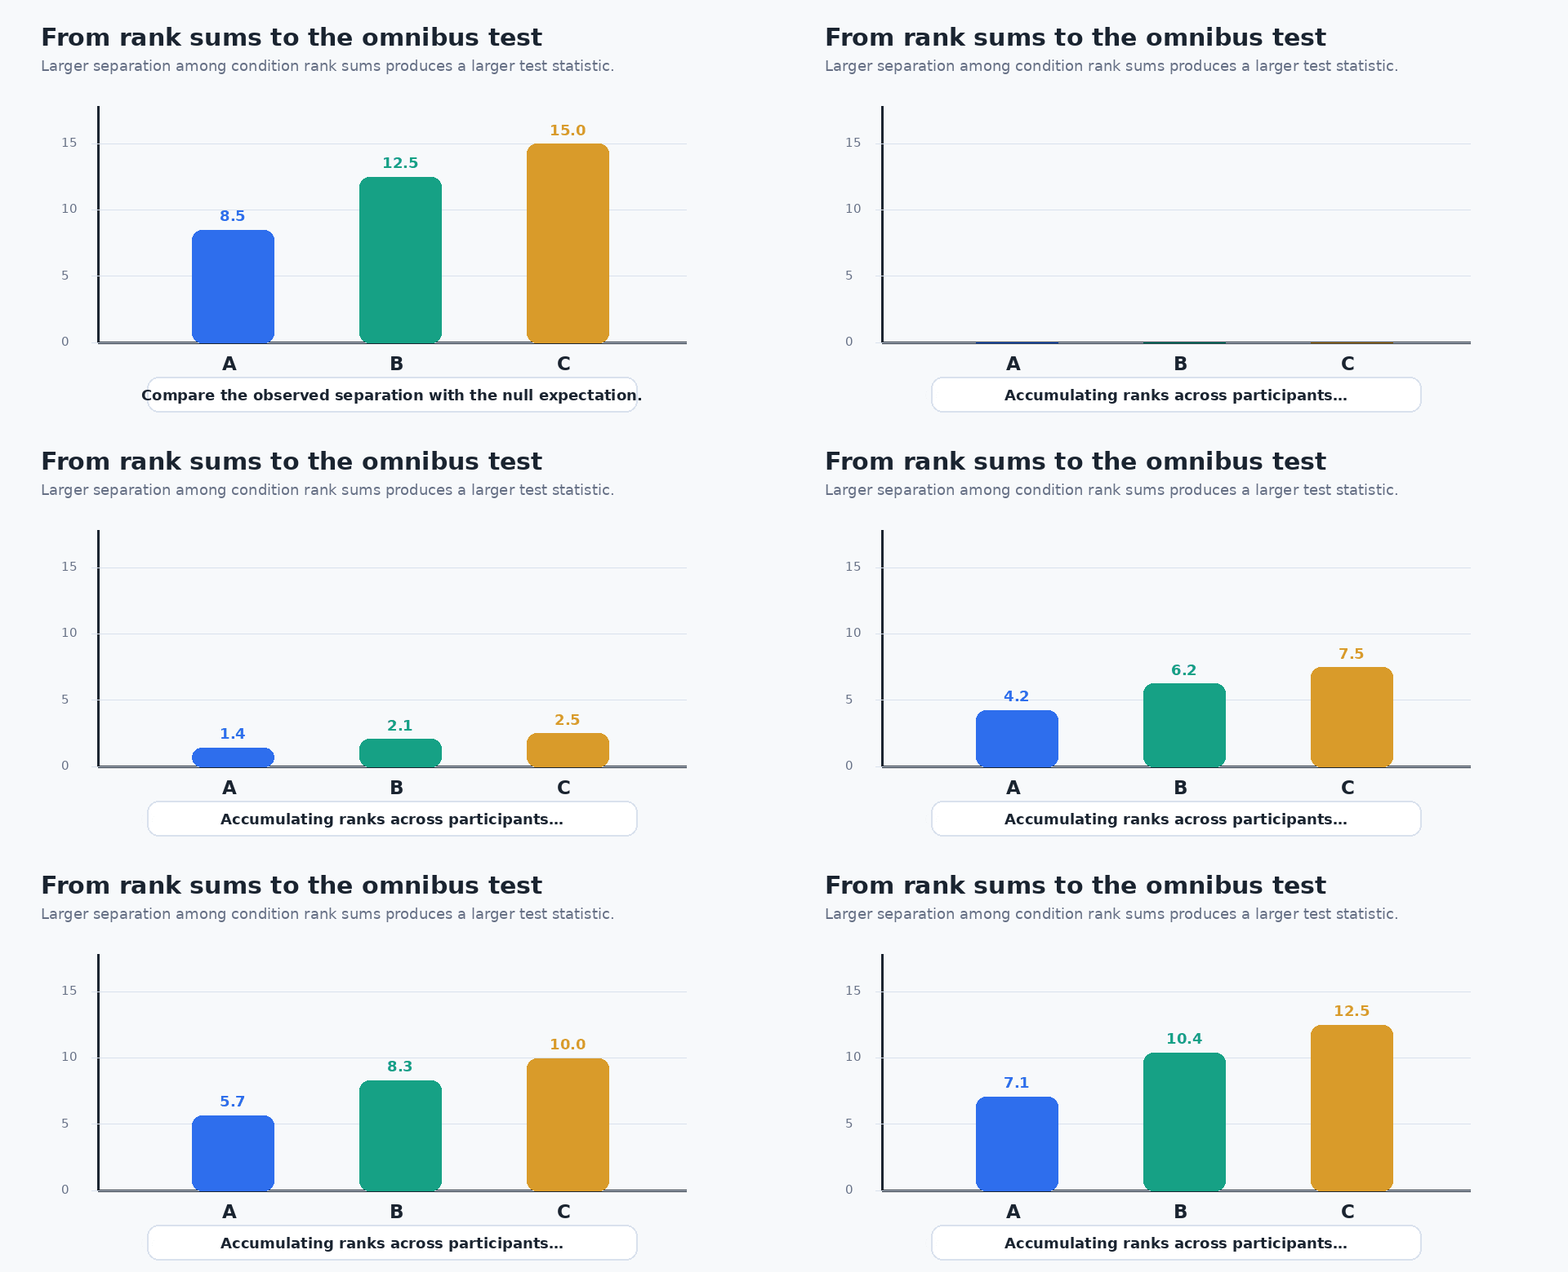
The rank sums are 8.5 for Condition A, 12.5 for Condition B, and 15.0 for Condition C. After the tie correction, the Friedman statistic is Q = 3.739 with 2 degrees of freedom and p = .154.
At α = .05, this hypothetical dataset does not provide sufficient evidence to reject the null hypothesis. That does not prove that the conditions are identical; the study may simply have limited information or a modest effect.
Approximation quality matters. SciPy notes that the chi-square p-value is reliable only for sufficiently large designs and gives a specific caution for small numbers of subjects and repeated samples [3]. Exact or permutation-based methods may be preferable when the design is small.
How Do You Interpret Friedman Test Results?
A typical software output includes the number of valid subjects, mean rank for each condition, the Friedman chi-square statistic, degrees of freedom, and a p-value. IBM SPSS reports these elements in its ranks and test-statistics tables [4].
When p is smaller than the prespecified significance threshold, reject the null hypothesis and conclude that an overall difference exists among the related conditions. Do not conclude that all conditions differ from one another.
When p is not smaller than the threshold, report that the data did not provide sufficient evidence of an overall difference. Avoid saying that the conditions were proven equal.
Mean ranks indicate relative ordering, but they are not raw-score means. Report medians and interquartile ranges so readers can understand the original measurement scale.
Interpretation checkpoint: A p-value answers a question about compatibility with the null model. It does not measure the practical size of the difference, the probability that the hypothesis is true, or the quality of the study design.
What Should You Do After a Significant Friedman Test?
The Friedman test is an omnibus procedure. A significant result identifies a difference somewhere, but post-hoc analysis is needed to locate it.
Pairwise Wilcoxon signed-rank tests are a common option because each comparison preserves the matched structure. Friedman-specific Conover, Nemenyi, Siegel, Miller, and exact rank-sum procedures are also available in specialist software [7].
Multiple comparisons increase the chance of false-positive findings, so p-values or significance thresholds should be adjusted. Bonferroni is simple but conservative. Holm’s sequential procedure usually retains more power while controlling the familywise error rate.
For small block counts, exact inference may materially change pairwise conclusions. Eisinga and colleagues documented an exact approach for differences between Friedman rank sums and showed why tail approximations can be inaccurate [5].
How Is Effect Size Measured for the Friedman Test?
Kendall’s W, also called the coefficient of concordance, is commonly reported as an effect-size measure. A standard calculation is W = Q / [n(k − 1)], where Q is the Friedman statistic, n is the number of blocks, and k is the number of conditions [6].
For the hypothetical example, W = 3.739 / [6 × (3 − 1)] = .312. Larger values indicate stronger differentiation or agreement in the rank pattern.
Do not treat generic small, medium, and large thresholds as universal. Practical importance depends on the measurement scale, the consequences of the difference, uncertainty, and evidence from the field.
Calculate Your Friedman Test
Want to check your own repeated-measures data without calculating every rank manually? Use our Statistics Calculator — dataclue to enter your conditions, calculate the test statistic and p-value, and review the result.
The calculator can perform the arithmetic, but you should still confirm that your observations are related, your data can be ranked, and each subject is represented across the required conditions.
Theory Versus Implementation
Theoretical advice recommends a complete repeated-measures dataset, a prespecified analysis plan, corrected post-hoc comparisons, effect-size reporting, and transparent interpretation. Implementation is often less tidy.
Participants miss measurement occasions, rating scales produce many ties, software packages apply different defaults, and researchers sometimes choose post-hoc procedures only after seeing the output. These issues can change the effective sample, p-values, and interpretation.
The calculation itself is inexpensive and available in common statistical software. The real effort lies in verifying the matched design, reviewing missingness, selecting the inferential method, preserving reproducibility, and explaining what the ranks do and do not represent.
AI assistants can draft R or Python code and explain output, but they cannot verify whether blocks are independent or whether the dataset was structured correctly. AI-generated analysis should be checked against the data, saved software output, and official documentation.
- Document how missing observations were handled.
- Inspect the amount and pattern of ties.
- Choose the post-hoc method and multiplicity correction deliberately.
- Save the software version, syntax, and options.
- Use exact or permutation inference when asymptotic assumptions are doubtful.
What Are the Friedman Test’s Limitations and Common Mistakes?
Ranking improves robustness but removes information about distance. Raw differences of 1 point and 100 points can produce the same rank ordering. The test can therefore show a consistent directional pattern without describing the magnitude of change on the original scale.
The classical method also handles incomplete longitudinal data poorly. If observation times are unequal, covariates matter, subjects are nested, or individual trajectories are central to the question, a mixed-effects model may be more informative.
- Using the test for independent groups
- Using it when only two related conditions exist
- Ranking values across the full dataset instead of within each subject
- Ignoring averaged ranks for ties
- Deleting incomplete subjects without examining missingness
- Treating mean ranks as raw means
- Running unadjusted pairwise tests
- Reporting only a p-value without descriptive statistics or effect size
- Claiming statistical significance proves causation
- Treating a non-significant result as evidence of equivalence
How Should Friedman Test Results Be Reported?
A complete report should name the design, state how many subjects and conditions were analyzed, give medians and interquartile ranges, report the statistic and exact p-value, include Kendall’s W, and describe any adjusted post-hoc comparisons.
Also disclose missing-data decisions, tie handling when relevant, software and version, and whether the p-value was asymptotic, exact, or permutation-based.
Reporting template: A Friedman test indicated that [outcome] differed across [k] related conditions, χ²F([df], N = [sample]) = [statistic], p = [value], Kendall’s W = [effect size]. Median (IQR) values were [values]. Post-hoc [procedure] comparisons with [correction] adjustment showed that [condition] differed from [condition], adjusted p = [value].
Is the Friedman Test the Right Choice for Your Data?
Choose the method from the study design first, then evaluate measurement and distributional assumptions. The following table provides a practical starting point.
| Research design | Likely method |
|---|---|
| Two related conditions | Wilcoxon signed-rank test or a suitable paired parametric method |
| Three or more related ordinal conditions | Friedman test |
| Three or more related continuous conditions with suitable assumptions | Repeated-measures ANOVA |
| Three or more independent groups | Kruskal-Wallis test |
| Three or more related binary outcomes | Cochran’s Q test |
| Repeated data with missing observations, covariates, clustering, or irregular timing | Consider a mixed-effects or other longitudinal model |
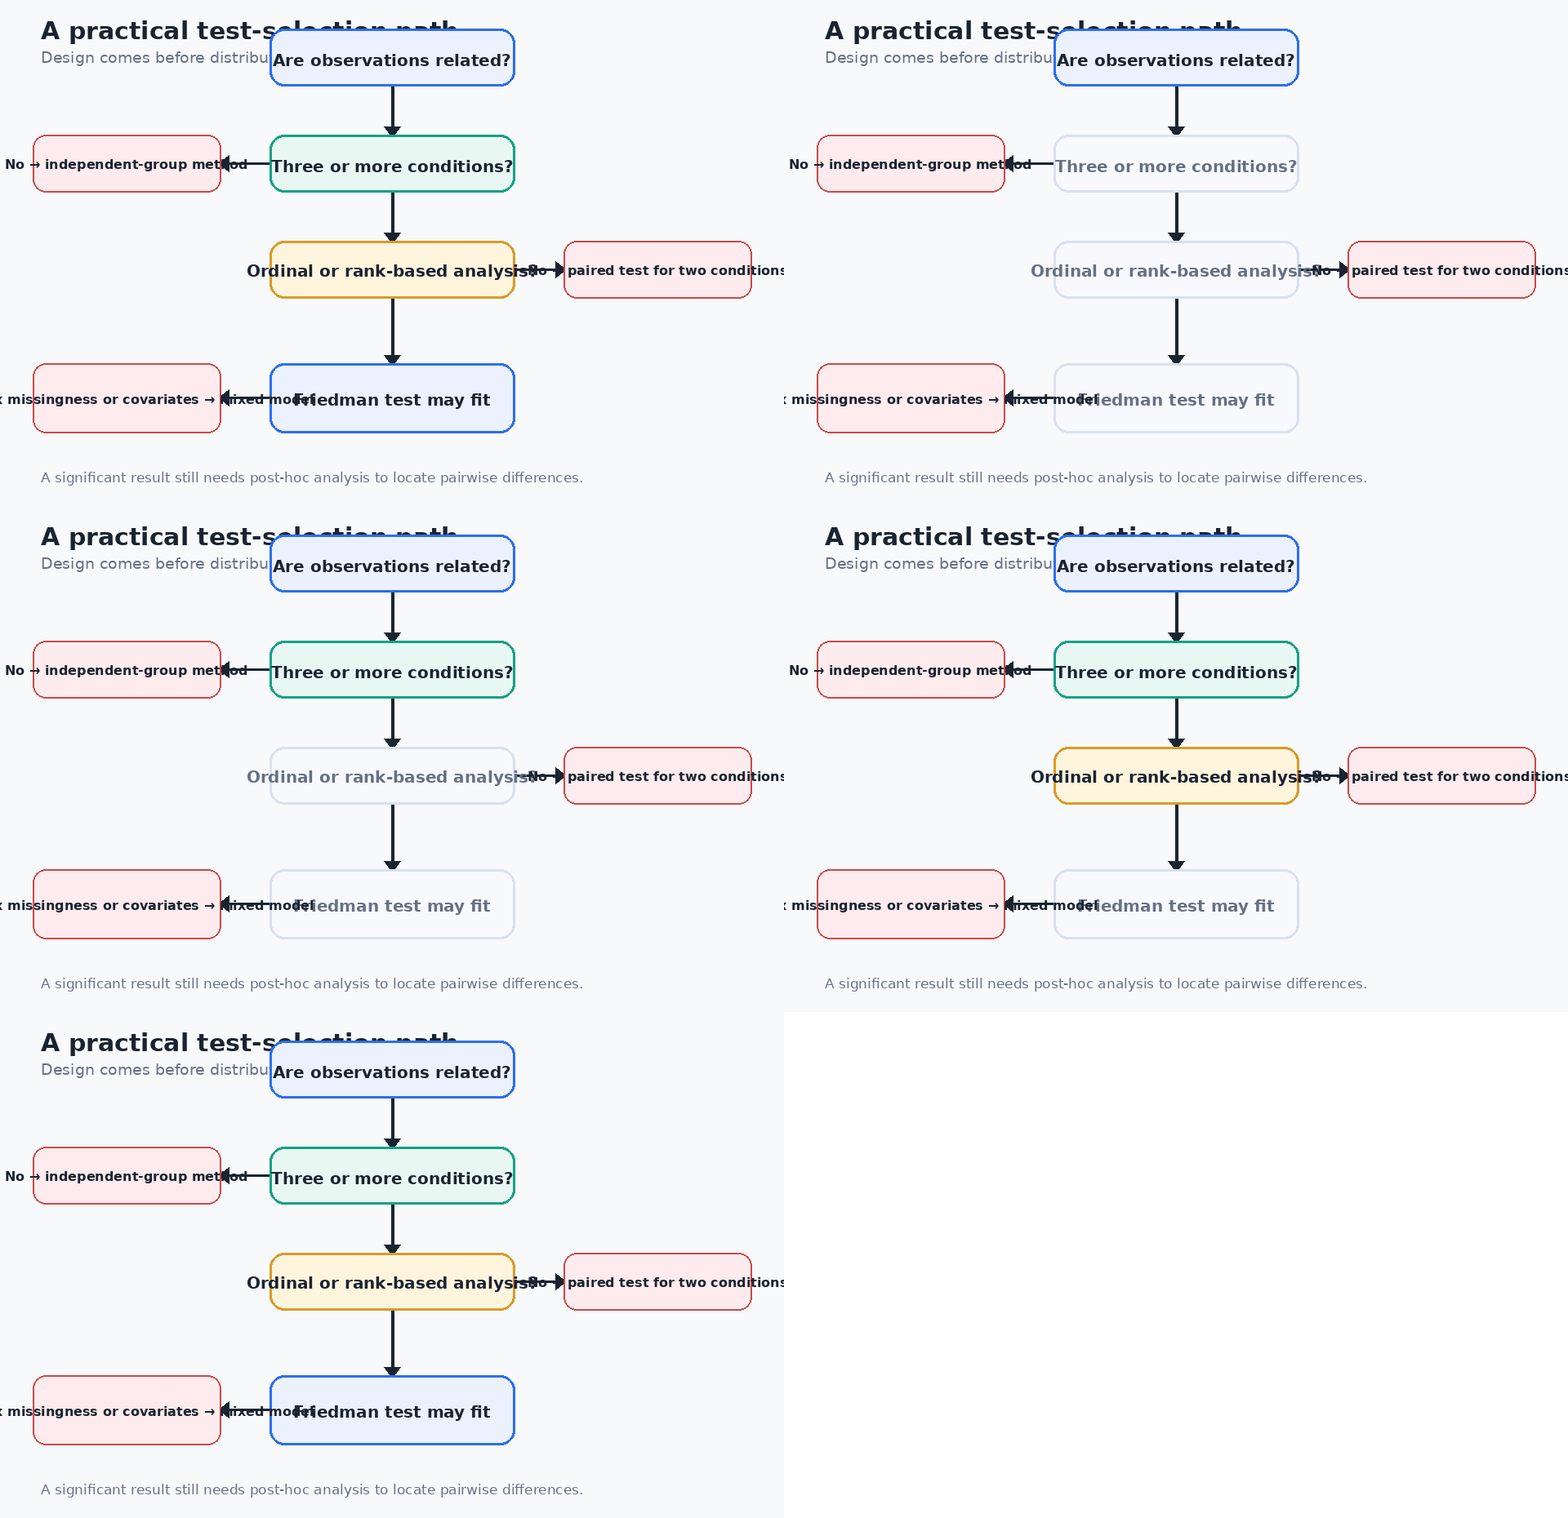
The Friedman test is a strong choice when the same subjects complete three or more conditions, the outcome is rankable, and a simple omnibus comparison answers the first research question. It is not a universal substitute for repeated-measures modeling.
Before running it, confirm the matched structure, examine missing observations and ties, choose the follow-up procedure, and decide how practical importance will be reported.
Conclusion and Actionable Next Steps
The Friedman test provides a clear rank-based comparison of three or more related conditions without requiring normally distributed raw scores. Its usefulness depends on a complete matched design, independent blocks, careful treatment of ties and missing values, and appropriate post-hoc analysis.
Arrange one matched set of observations for each subject, report medians and interquartile ranges, run the omnibus test, calculate Kendall’s W, and use adjusted pairwise comparisons only when justified. For incomplete or complex longitudinal data, compare the method with mixed-effects alternatives before finalizing the analysis.
You May Also Like Kruskal-Wallis Test
FAQs
What is the Friedman test?
The Friedman test is a non-parametric statistical test used to compare three or more related groups, repeated measurements, or matched conditions.
What is the purpose of the Friedman test?
Its purpose is to determine whether responses differ overall across several related conditions. It does not identify which specific pairs differ.
How does the Friedman test work?
The test ranks each subject’s values across the conditions and compares the resulting rank sums. Larger differences among rank sums produce a larger test statistic.
What is the main benefit of the Friedman test?
The main benefit is that it can analyze ordinal or non-normally distributed repeated-measures data without requiring a normality assumption.
What is the main limitation of the Friedman test?
Because it uses ranks, the Friedman test does not preserve the size of differences between raw scores. It also provides only an overall result unless post-hoc comparisons are conducted.
When is the Friedman test a good choice?
It is a good choice when the same subjects are measured under three or more conditions and the outcome is ordinal or meaningfully rankable.
When should the Friedman test not be used?
It should not be used for independent groups, two related conditions, or datasets in which subjects cannot be matched across all conditions.
What data structure does the Friedman test require?
Each subject or block should have one measurement for every condition. In a typical wide-format dataset, each subject occupies one row and each condition occupies one column.
What should be done after a significant Friedman test?
A significant result should usually be followed by appropriate pairwise comparisons, such as Wilcoxon signed-rank tests, with a multiple-testing correction such as Holm or Bonferroni.
What is the main implementation risk?
A common risk is running several unadjusted post-hoc tests, which increases the chance of false-positive conclusions. Missing observations and incorrectly handled ties can also affect the analysis.
Which tools can run the Friedman test?
IBM SPSS Statistics, R, Python with SciPy, jamovi, and JASP can perform the Friedman test. The best choice depends on whether the user needs a menu-based workflow, reproducible code, or advanced post-hoc options.
How much effort does a Friedman test require?
The calculation is usually quick in statistical software, but preparing matched data, checking missing values, selecting post-hoc tests, and reporting effect size require methodological judgment.
Does the Friedman test solve all repeated-measures problems?
No. Mixed-effects models may be more suitable when the data include missing occasions, unequal timing, covariates, nested observations, or interest in individual change patterns.
What is the long-term value of using the correct test?
Choosing a method that matches the study design improves the credibility, reproducibility, and interpretability of the findings. A technically correct calculation cannot compensate for incorrectly matched data or a poorly defined research question.
Sources
- NIST Dataplot: Friedman Test. Definition, assumptions, within-block ranking, tied ranks, formula, and chi-square approximation.
- R Documentation: Friedman Rank Sum Test. Complete blocked design, null hypothesis, and missing-value handling in base R.
- SciPy Documentation: scipy.stats.friedmanchisquare. Repeated-sample interpretation, tie correction, implementation, and approximation cautions.
- IBM SPSS Statistics: FRIEDMAN Subcommand. SPSS output, measurement-level requirements, mean ranks, test statistic, degrees of freedom, and probability.
- Eisinga et al. (2017): Exact p-values for pairwise comparison of Friedman rank sums. Exact pairwise inference and limitations of asymptotic comparisons.
- R rstatix Documentation: Friedman Test Effect Size. Kendall’s W calculation for the Friedman test.
- CRAN PMCMRplus Documentation. Friedman-specific Conover, Nemenyi, Siegel, Miller, and exact all-pairs procedures.