
Kruskal-Wallis Test: How It Works and When to Use It
The Kruskal-Wallis test is a rank-based method for comparing an ordinal or continuous outcome across independent groups.It is useful when a one-way ANOVA is not a good match, but a significant result does not identify…
Kruskal-Wallis Test: How It Works and When to Use It
The Kruskal-Wallis test is a rank-based method for comparing an ordinal or continuous outcome across independent groups. It is useful when a one-way ANOVA is not a good match, but a significant result does not identify which groups differ.
What Is the Kruskal-Wallis Test in Simple Terms?
The Kruskal-Wallis test is a non-parametric, rank-based method for comparing an ordinal or continuous outcome across independent groups. It is most commonly used for three or more groups when a mean-based one-way ANOVA is not a good match for the data or research question.
Instead of comparing the raw group means, the procedure pools all observations, ranks them from lowest to highest, and examines whether the groups receive systematically different ranks. William Kruskal and W. Allen Wallis introduced the method in 1952 as a rank-based approach to one-criterion variance analysis [1].
The practical value is that the method can analyze ordered outcomes without requiring a normal distribution. Its key limitation is that it is an omnibus test: a significant result shows that a difference exists somewhere, but not which groups differ.
When Should You Use the Kruskal-Wallis Test?
Use the test when one categorical variable defines independent groups and the dependent variable is at least ordinal. Typical applications include comparing symptom ratings across treatments, customer satisfaction scores across service channels, or reaction times across interface designs.
Kruskal-Wallis may be appropriate when the outcome is ordinal, strongly skewed, affected by influential outliers, or otherwise better represented by relative ordering than by group means. It can also accommodate unequal group sizes [3][4].
Non-normality alone is not a complete decision rule. ANOVA can be robust in some designs, and Welch's ANOVA may be preferable when unequal variances are the main concern. Select the method according to the study design, measurement scale, distributional pattern, and inferential question.
What Assumptions Does the Test Require?
Non-parametric does not mean assumption-free. The most important requirement is independence: each participant or experimental unit should normally contribute one observation to one group. Repeated or matched observations call for a related-samples method such as the Friedman test.
The outcome must be meaningfully rankable, and the groups should represent independent samples. The usual chi-square p-value is an approximation, so very small groups need additional care. NIST and SciPy both give a common guideline of more than four, or at least five, observations per group for the ordinary approximation [2][4].
Similar distribution shapes are especially important when the result will be described as a difference in medians. IBM's SPSS documentation explicitly notes the similar-shape assumption [6]. If group shapes or spreads differ substantially, a significant rank result can reflect more than a simple shift in central location.
How Does the Kruskal-Wallis Test Work?
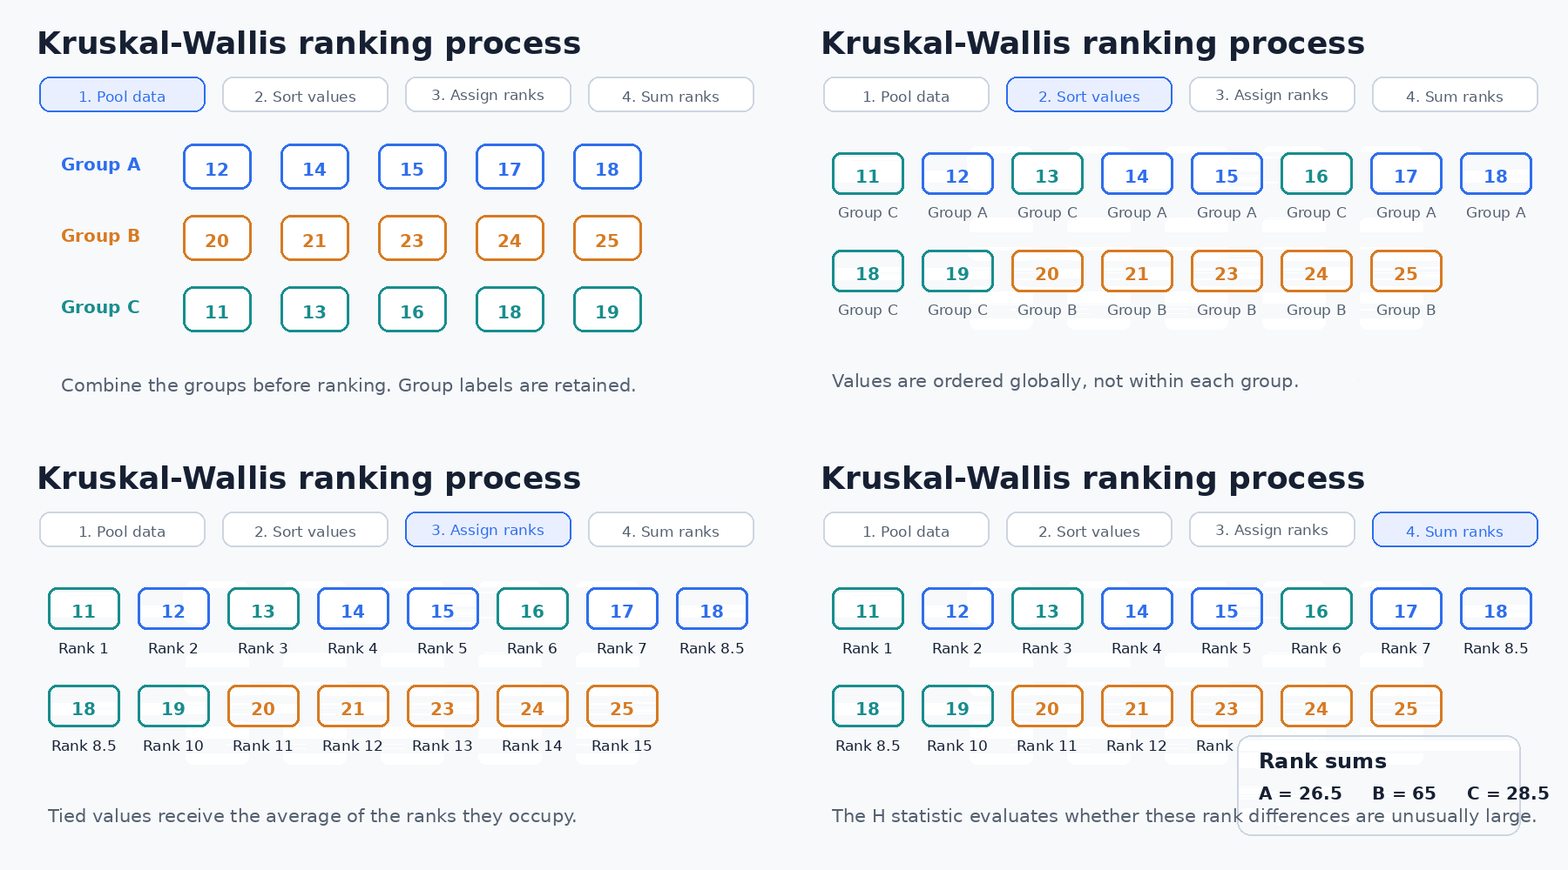
The procedure combines all observations, sorts them, assigns ranks, and then returns the ranked values to their original groups. Tied observations receive the average of the positions they occupy. Software normally corrects the H statistic for ties [4].
If the null hypothesis is reasonable, high and low ranks should be mixed across the groups. A group containing consistently larger observations will accumulate a larger rank sum, while a group containing smaller observations will accumulate a smaller one. The test evaluates whether these differences are too large to attribute to sampling variation under the null model.
What Are the Null and Alternative Hypotheses?
A precise null hypothesis is that the groups have the same distributional location. R's official documentation describes the test as assessing whether the distributions' location parameters are equal across groups [3]. The alternative is that at least one group differs.
Many introductory sources state that the null hypothesis is equality of medians. That interpretation is reasonable when the distributions have similar shapes, but the computation itself is based on ranks. The broader location or distribution wording is safer when shapes differ.
How Is the H Statistic Calculated?
Without displaying the separate tie-correction factor, the basic statistic is:
Here, N is the total number of observations, k is the number of groups, n_i is the size of group i, and R_i is that group's rank sum. NIST documents this formula and the approximate chi-square reference distribution with k - 1 degrees of freedom [2].
Manual calculation is useful for learning. Research analyses should usually be performed in established software so that tied values, missing observations, and numerical details are handled consistently.
How Do You Interpret H, Degrees of Freedom, and the p-Value?
The H value summarizes the separation among group ranks. Degrees of freedom equal the number of groups minus one. The p-value is calculated from the approximate chi-square distribution under the null hypothesis [2][4].
For example, H(2) = 9.41, p = .009 indicates evidence that the three groups do not all occupy the same position in the ranked outcome distribution. It does not show that every pair differs, establish causation, or describe the magnitude of the difference.
A p-value above the chosen significance level means the data do not provide sufficient evidence to reject the null hypothesis. It is not proof that the groups are identical.
Does the Test Compare Medians or Mean Ranks?
The test directly analyzes pooled ranks, not sample medians. Mean ranks are a useful summary of the ranked observations, although the formal calculation uses rank sums.
When group distributions have similar shapes and differ mainly in location, higher ranks generally correspond to a higher median. Under that condition, describing the result as evidence of a median difference can be defensible.
The nuanced conclusion is more useful than the usual shortcut: Kruskal-Wallis detects systematic rank differences, which can be interpreted as location or median differences only when the distributional context supports that interpretation.
What Does a Significant Result Mean?
A significant result means that at least one group differs from at least one other group in the ranked outcome. It does not identify the pair, quantify practical importance, or reveal whether location, spread, or shape produced the difference.
Interpret the result alongside group medians, interquartile ranges, sample sizes, and distribution plots. Add an appropriate effect-size estimate where possible. A p-value answers an evidence question; it does not answer the magnitude question.
Which Post Hoc Test Should You Use?
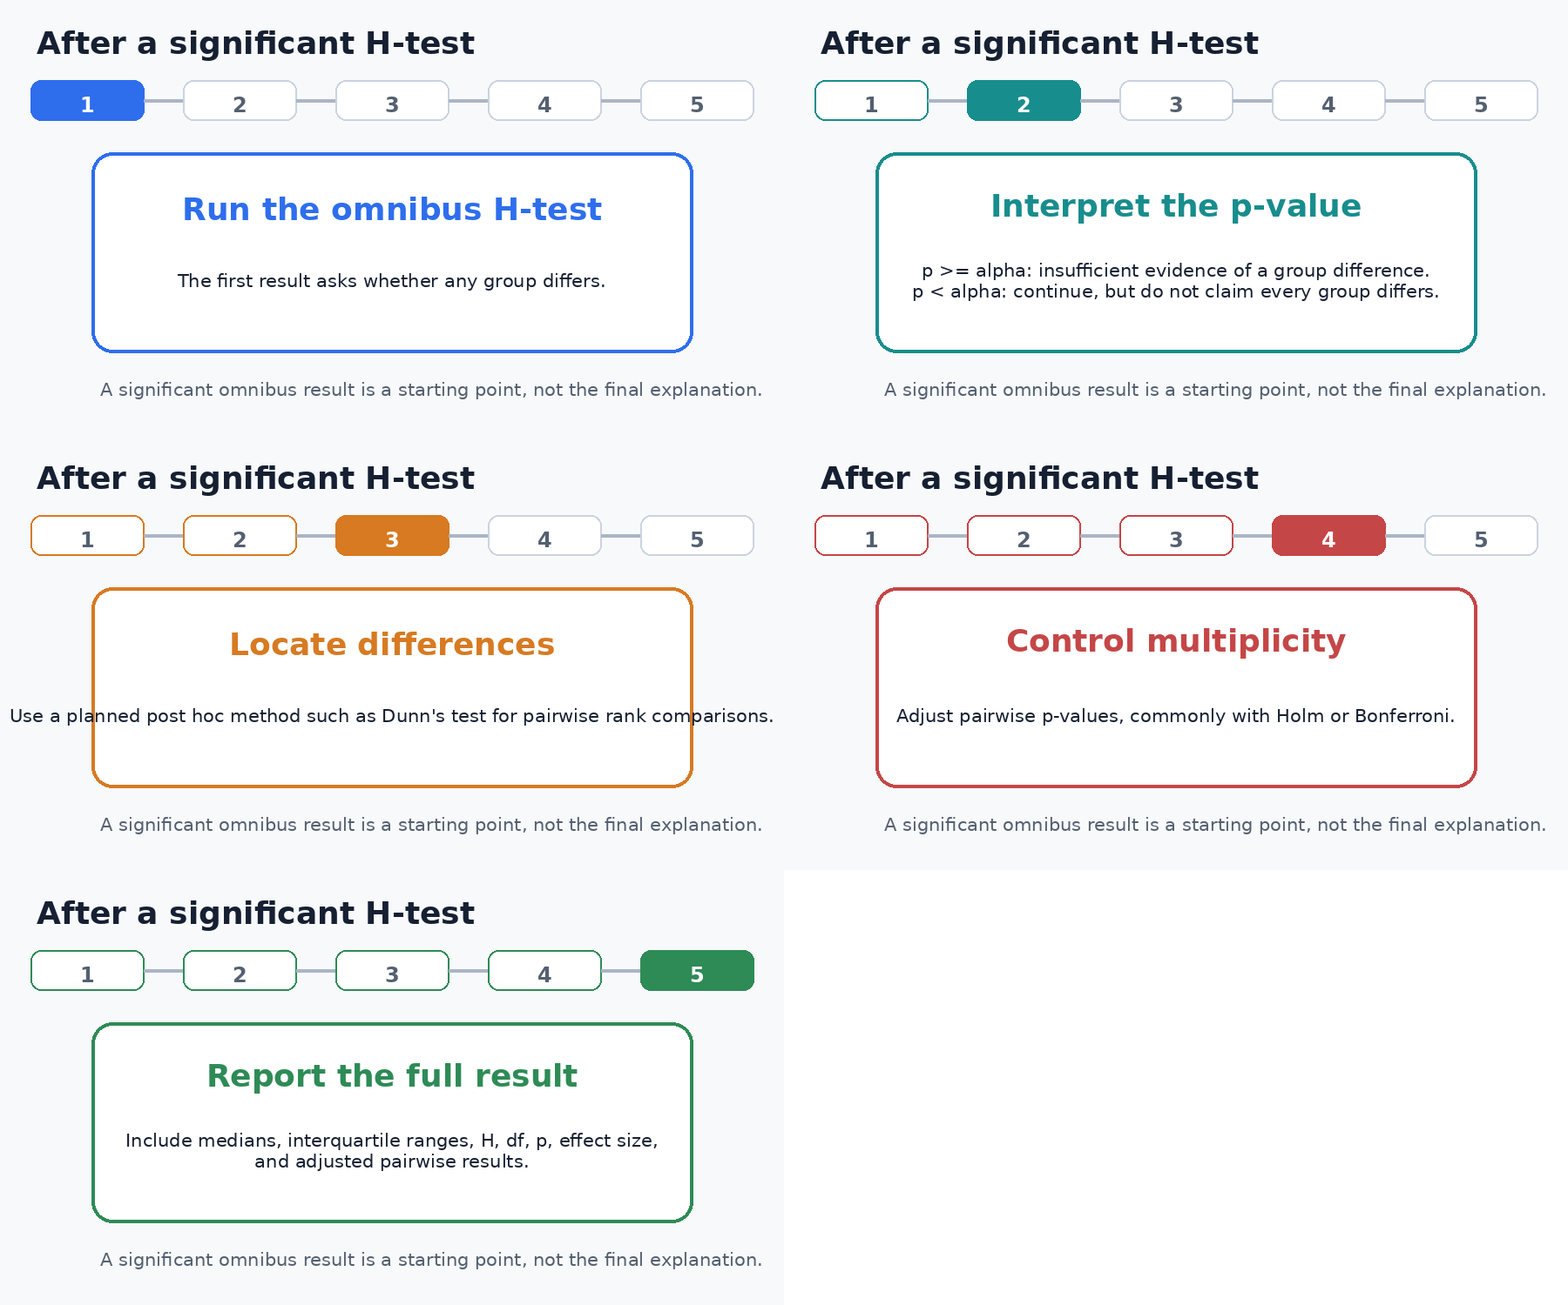
Dunn's test is a common post hoc choice after a significant Kruskal-Wallis result. It uses ranks from the combined set of independent samples to evaluate pairwise differences, following the approach described by Olive Jean Dunn [5].
Because several pairs are tested, p-values should be adjusted for multiplicity. Holm and Bonferroni control the family-wise error rate, while false-discovery-rate methods may suit explicitly exploratory work. The adjustment should be selected for the analysis plan, not chosen afterward because it produces a preferred conclusion.
Kruskal-Wallis vs ANOVA, Mann-Whitney, and Friedman
| Method | Typical design | Relationship | Analytical target |
|---|---|---|---|
| Kruskal-Wallis | Three or more groups | Independent | Pooled ranks |
| One-way ANOVA | Three or more groups | Independent | Means under a parametric model |
| Mann-Whitney U | Two groups | Independent | Ranks |
| Friedman | Three or more conditions | Related or repeated | Within-block or within-subject ranks |
The closest alternative depends on the design. Mann-Whitney is the two-independent-group relative; Friedman addresses related or repeated measurements; and one-way ANOVA or Welch's ANOVA may be preferable when the research question concerns means and a suitable model is available.
Worked Kruskal-Wallis Test Example
Hypothetical example: a researcher compares response times under three interface designs. Design A records 12, 14, 15, 17, and 18 seconds; Design B records 20, 21, 23, 24, and 25 seconds; Design C records 11, 13, 16, 18, and 19 seconds.
Applying a tie-corrected Kruskal-Wallis test gives H(2) = 9.41 and p = .009. The result supports the conclusion that the response-time distributions are not all the same.
The analysis is not finished. The researcher should inspect the distributions, run corrected pairwise comparisons, calculate an effect size, and report which designs differ. Because the dataset is hypothetical, it demonstrates the method but provides no evidence about actual interface performance.
Calculate the Kruskal-Wallis Test With Your Own Data
Ready to check whether your independent groups differ? Enter or paste your data into the calculator below to obtain the H statistic, degrees of freedom, and p-value.
Statistics Calculator — dataclue
The calculator provides the overall test result. If the result is statistically significant, use an appropriate post hoc procedure, such as Dunn’s test with a multiple-comparison adjustment, to identify which groups differ.
Theory vs Implementation
Theoretical advice often presents Kruskal-Wallis as an automatic replacement whenever normality fails. Implementation results depend on independence, data quality, group size, ties, missing-value handling, distribution shapes, and the actual question being tested.
The calculation itself is inexpensive and available in R through kruskal.test(), in Python through scipy.stats.kruskal(), and in packages such as SPSS [3][4][6]. The greater effort lies in screening the data, documenting exclusions, selecting post hoc corrections, checking robustness, and writing a conclusion that does not overstate what the ranks show.
AI assistants can draft software code or explain output, but they cannot establish that observations are independent or that the selected test matches the scientific design. Generated code should be checked against official documentation and reproduced on a known example before being trusted with research data.
Common Mistakes and Limitations
Common mistakes include treating the test as assumption-free, describing it as a direct median test without checking distribution shapes, using it for repeated measurements, skipping multiplicity correction, and reporting only a p-value.
Ranking also discards information about numerical distances. A one-unit difference and a much larger difference can have similar effects on ordering. The method may therefore have less power than a well-specified parametric model when that model's assumptions and target estimand are appropriate.
A further limitation is structural: the basic test does not naturally handle covariates, interactions, clustered observations, or complex longitudinal designs. Regression, robust modeling, permutation methods, or specialized ordinal models may better answer those questions.
How to Report the Results
Report the grouping variable, outcome, sample sizes, group medians and interquartile ranges, H statistic, degrees of freedom, p-value, effect size, and any adjusted post hoc comparisons.
Example: A Kruskal-Wallis test indicated that response times differed across the three interface designs, H(2) = 9.41, p = .009. Holm-adjusted Dunn comparisons were then used to identify the differing pairs. Group medians, interquartile ranges, and an effect-size estimate were reported to describe direction and magnitude.
Replace the final sentence with the actual pairwise results and effect-size value. Also state any important limitations, including small groups, heavy ties, missing data, or non-comparable distribution shapes.
Quick Decision Guide: Is Kruskal-Wallis the Right Test?
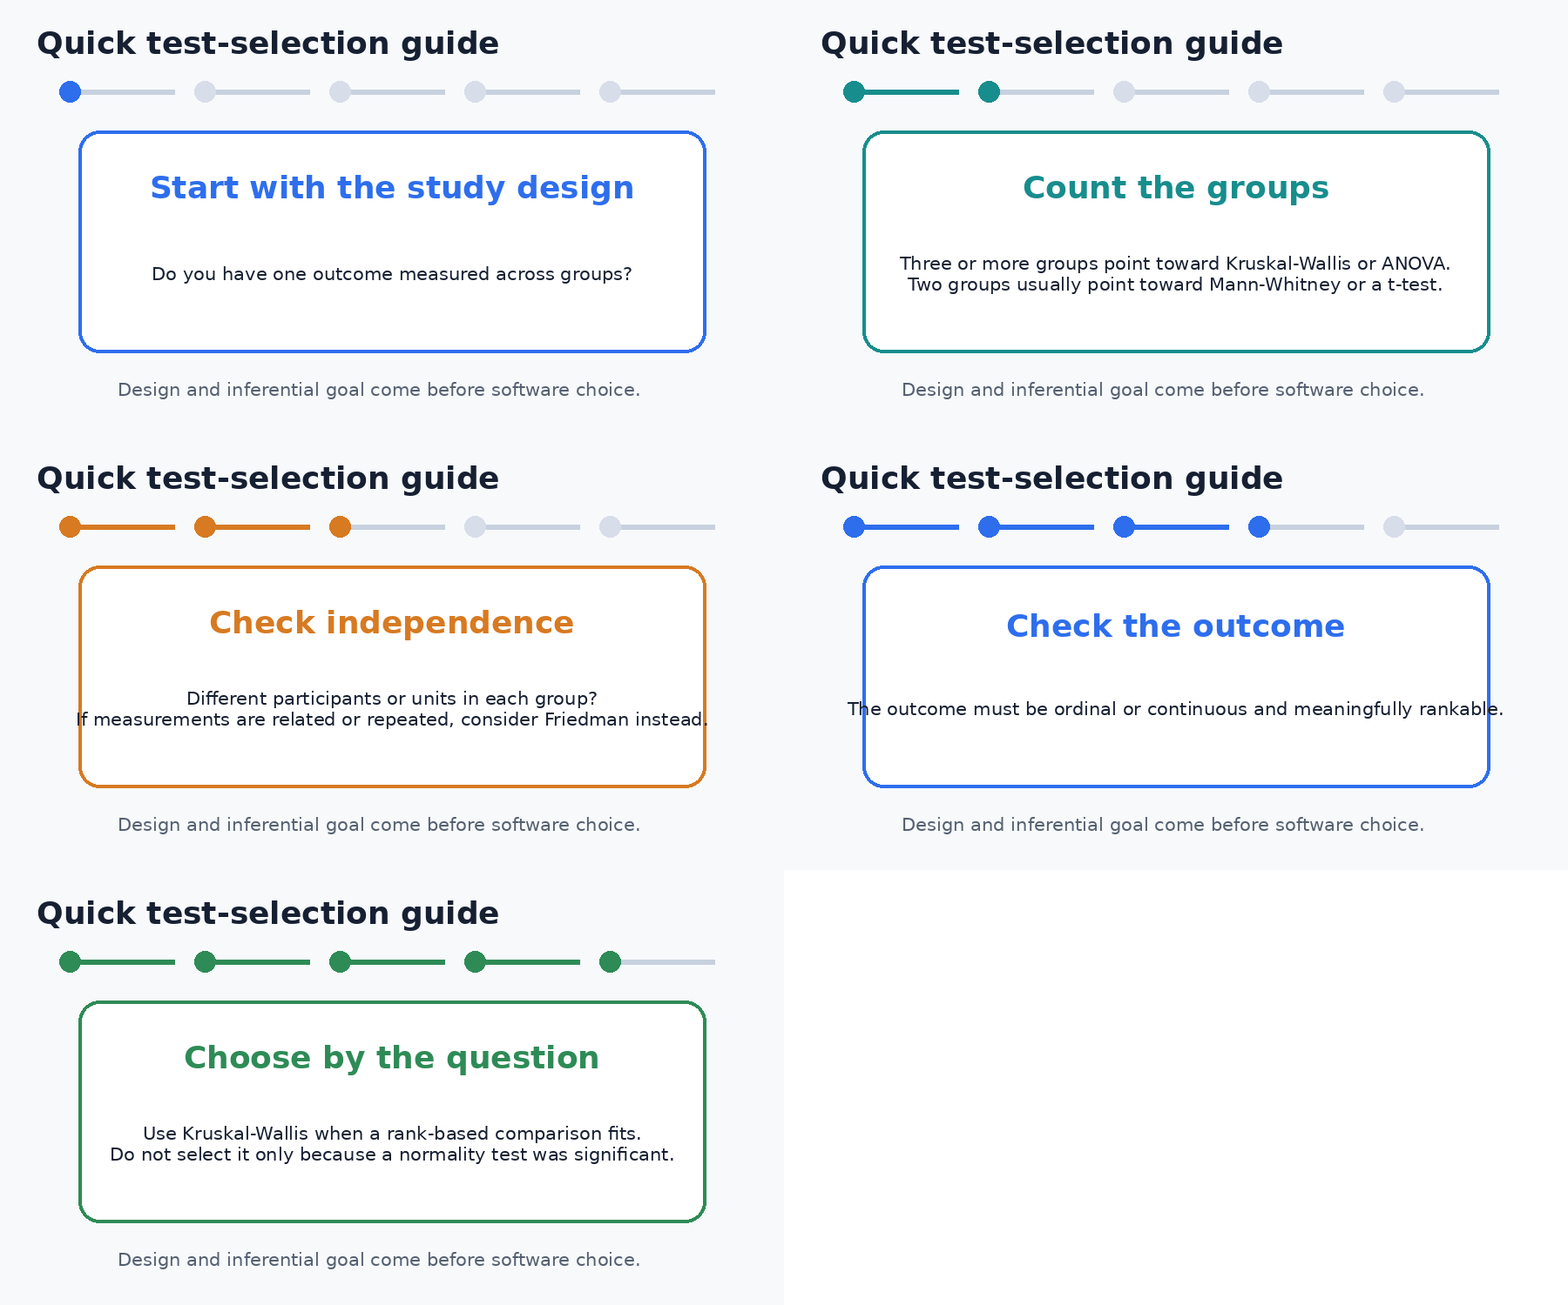
Kruskal-Wallis is a reasonable choice when you have three or more independent groups, one rankable outcome, and a research question that can be answered through a rank-based comparison. You should also be prepared to inspect distributions and run corrected post hoc tests if the omnibus result is significant.
Choose another method when observations are paired, covariates or interactions matter, the outcome requires a specialized model, or the target question is specifically about means and an appropriate ANOVA-type method is available.
The central decision is not whether the dataset passed a normality test. It is whether the study design, outcome scale, inferential target, and assumptions align with what the Kruskal-Wallis test actually measures.
Recommended Next Steps
Use separate supporting guides for software-specific workflows, Dunn's test, effect-size calculation, and small-sample or tied-rank problems. These topics require more detail than a single pillar article can provide without becoming difficult to navigate.
You May Also Like Wilcoxon Signed-Rank
FAQs
What is the Kruskal-Wallis test?
The Kruskal-Wallis test is a non-parametric method used to compare an ordinal or continuous outcome across three or more independent groups.
What is the purpose of the Kruskal-Wallis test?
Its purpose is to determine whether at least one group tends to produce higher or lower ranked values than the others.
How does the Kruskal-Wallis test work?
The test combines all observations, ranks them from lowest to highest, and compares the rank totals or mean ranks across the groups.
What is the main benefit of the Kruskal-Wallis test?
It can analyze ordinal, skewed, or outlier-affected data without requiring the outcome to follow a normal distribution.
What is the main limitation of the Kruskal-Wallis test?
A significant result shows that a difference exists somewhere among the groups, but it does not identify which specific groups differ.
Does the Kruskal-Wallis test compare medians?
It directly compares ranks rather than medians. A median-based interpretation is most appropriate when the groups have similarly shaped distributions.
When is the Kruskal-Wallis test a good choice?
It is a good choice when three or more independent groups are being compared and a rank-based analysis matches the measurement scale and research question.
When should the Kruskal-Wallis test not be used?
It should not be used for paired, matched, or repeated observations; the Friedman test is usually more appropriate for those designs.
What is required before running the test?
The analyst should confirm that observations are independent, the outcome is at least ordinal, and the grouping variable defines separate samples.
What should be done after a significant result?
A post hoc method such as Dunn’s test should be used with an appropriate multiple-comparison adjustment to determine which group pairs differ.
How much effort or cost does the analysis require?
The calculation is inexpensive and available in tools such as R, Python, SPSS, Stata, Jamovi, and JASP, but careful assumption checking and interpretation still require statistical skill.
What is the long-term value of using the test correctly?
Correct use improves the reproducibility and credibility of group comparisons, while incorrect use can produce misleading conclusions about medians, significance, or practical importance.
References
- Kruskal, W. H., & Wallis, W. A. (1952). Use of Ranks in One-Criterion Variance Analysis. Journal of the American Statistical Association, 47(260), 583-621. Source
- NIST/SEMATECH. Engineering Statistics Handbook: Kruskal-Wallis test. Source
- R Project. kruskal.test: Kruskal-Wallis Rank Sum Test, stats package. Source
- SciPy. scipy.stats.kruskal documentation, version 1.18.0. Source
- Dunn, O. J. (1964). Multiple Comparisons Using Rank Sums. Technometrics, 6(3), 241-252. Source
- IBM. SPSS Statistics: Tests for Several Independent Samples. Source