
Labor Force Participation Rate Analysis: Trends and Python Tutorial
Explore the U.S. labor force participation rate, July 2026 trends, key drivers, age and sex gaps, economic effects, and what to watch next.
Labor Force Participation Rate: Trends, Drivers, and Python Analysis Tutorial
Published August 21, 2026 | Data through July 2026 | U.S. national analysis
The U.S. labor force participation rate was 61.4% in July 2026. That means about six in ten adults age 16 and older were working or actively looking for work. The rate was 61.5% in June and 62.2% one year earlier. It has fallen 0.7 percentage point since January. The decline matters, but it does not mean that every missing worker gave up on the job market. Population aging and a large January population adjustment explain much of the recent move. At the same time, prime age participation was 83.4% in July, the same as a year earlier. The best labor force participation rate analysis separates demographic change from real changes in work and job search. This guide also shows how to reproduce the same analysis step by step, so readers can update the work after each monthly BLS release.
Key Takeaways
- The U.S. participation rate was 61.4% in July 2026, down 0.8 percentage point from July 2025.
- The July monthly move was small, but BLS tests show the six month and twelve month declines are statistically significant.
- Aging and the January 2026 population control revision explain more than half of the decline measured through June in a St. Louis Fed decomposition.
- Prime age participation was 83.4% in July 2026, unchanged from a year earlier, so the total rate tells only part of the story.
- Lower participation can reduce labor supply and potential growth, but its effects on wages and inflation depend on labor demand, productivity, and why people are outside the labor force.
- The unemployment rate and participation rate should be read together because people who stop looking for work are not counted as unemployed.
- The tutorial section shows how to collect BLS series, calculate changes, compare groups, check significance, build charts, and write a careful conclusion.
Table of Contents
- What Is the Labor Force Participation Rate?
- Labor Force Participation Rate Trends in the United States
- Latest Labor Force Snapshot
- What Is Driving the Participation Rate?
- Why Changes in Participation Matter
- Labor Force Participation Rate vs Unemployment Rate
- Who Is Participating in 2026?
- How to Analyze the Labor Force Participation Rate Step by Step
- Python Code for the Full Analysis
- What to Watch Next
- Frequently Asked Questions
- Methodology and Data Note
What Is the Labor Force Participation Rate?
The labor force participation rate measures the share of the civilian noninstitutional population age 16 and older that is either employed or actively looking for work. BLS measures it through the Current Population Survey, also called the household survey.
The formula is simple: labor force divided by the civilian noninstitutional population, multiplied by 100. The labor force includes people with jobs and people without jobs who are actively searching and available for work. It does not include people who are retired, in school and not seeking work, caring for family and not seeking work, or otherwise outside active job search.
This makes the rate different from the employment population ratio. That ratio counts only people who are employed. It is also different from the unemployment rate, which looks only at the labor force rather than the whole eligible population.
Labor Force Participation Rate Trends in the United States
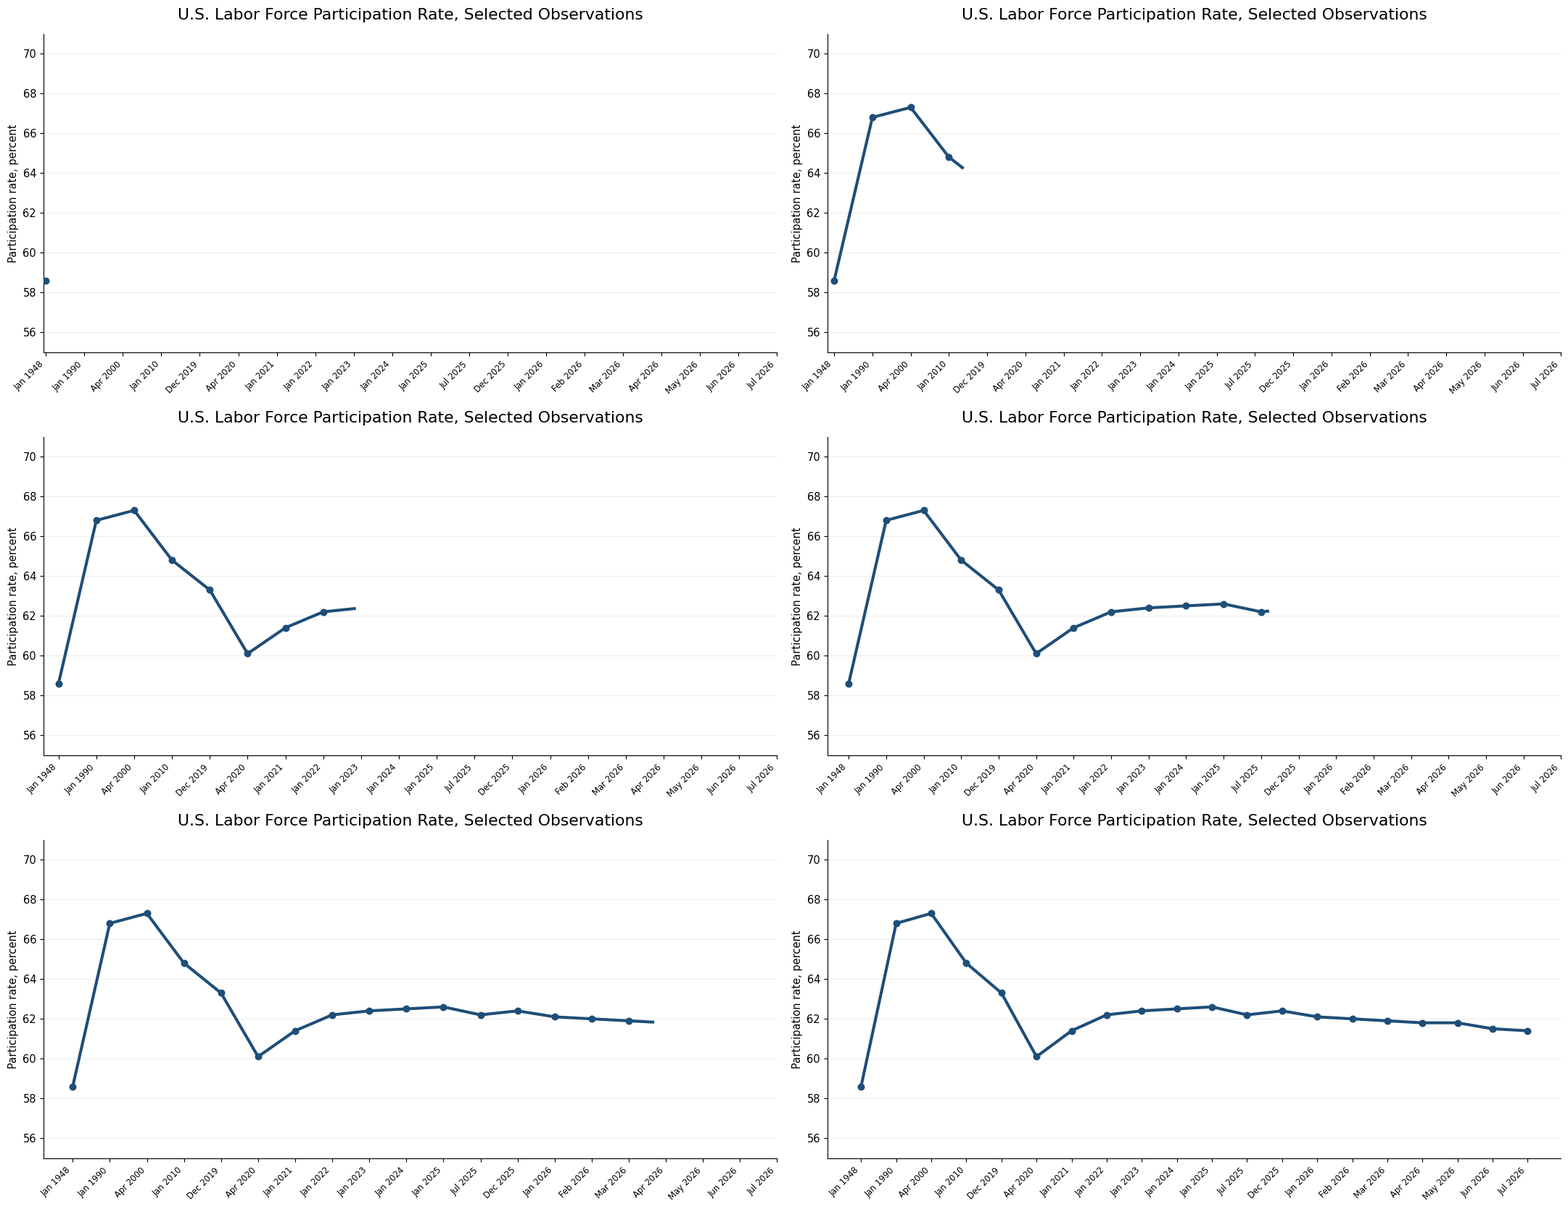
The long run path has three broad chapters. First, participation rose for decades after World War II. Women entered paid work in much larger numbers, and the large baby boom generation moved into its prime working years. The total rate reached 67.3% in April 2000, the high point in the modern monthly BLS series.
Second, the total rate moved lower after 2000. Population aging became a stronger force as baby boomers moved toward retirement. Participation among men also continued a long decline, while the earlier rise in women participation slowed. The Great Recession added cyclical weakness, but demographics were already changing the base of the labor market.
Third, the pandemic caused an abrupt break. Participation fell to 60.1% in April 2020. It then recovered as businesses reopened and job demand improved. The rate moved back above 62% by 2022 and reached 62.8% in some months of 2023. It was 62.6% in January 2025, then moved lower and reached 61.4% in July 2026.
The latest monthly number needs care. BLS reports that the one month change in July 2026 was not statistically significant. The six month and twelve month declines were significant. That is a good reason to focus on several months of data rather than one headline print.
U.S. Labor Force Participation Rate, Selected Observations
| Date | Participation rate |
|---|---|
| Jan 1948 | 58.6% |
| Jan 1990 | 66.8% |
| Apr 2000 | 67.3% |
| Jan 2010 | 64.8% |
| Dec 2019 | 63.3% |
| Apr 2020 | 60.1% |
| Jan 2021 | 61.4% |
| Jan 2022 | 62.2% |
| Jan 2023 | 62.4% |
| Jan 2024 | 62.5% |
| Jan 2025 | 62.6% |
| Jul 2025 | 62.2% |
| Dec 2025 | 62.4% |
| Jan 2026 | 62.1% |
| Feb 2026 | 62.0% |
| Mar 2026 | 61.9% |
| Apr 2026 | 61.8% |
| May 2026 | 61.8% |
| Jun 2026 | 61.5% |
| Jul 2026 | 61.4% |
Source: U.S. Bureau of Labor Statistics series LNS11300000, retrieved through BLS and FRED.
Latest Labor Force Snapshot
The table below keeps the latest headline in context. Rate changes are shown in percentage points, while level changes are shown as people.
| Metric | Latest month | Previous month | Year ago | Change from previous | Change from year ago | Source |
|---|---|---|---|---|---|---|
| Participation rate | 61.4% | 61.5% | 62.2% | Down 0.1 point | Down 0.8 point | BLS CPS |
| Prime age participation, age 25 to 54 | 83.4% | 83.3% | 83.4% | Up 0.1 point | No change | BLS CPS |
| Employment population ratio | 58.9% | 59.0% | 59.6% | Down 0.1 point | Down 0.7 point | BLS CPS |
| Unemployment rate | 4.1% | 4.2% | 4.3% | Down 0.1 point | Down 0.2 point | BLS CPS |
| Civilian labor force | 169.094 million | 169.358 million | 170.412 million | Down 264,000 | Down 1.318 million | BLS CPS |
| Not in labor force and want a job | 5.920 million | 6.045 million | 6.186 million | Down 125,000 | Down 266,000 | BLS CPS |
Source: U.S. Bureau of Labor Statistics Current Population Survey. Latest month is July 2026, previous month is June 2026, and year ago is July 2025.
What Is Driving the Participation Rate?
A national participation rate can fall for two very different reasons. People within an age group can leave work or stop searching, which is a behavior change. Or the population can shift toward groups that normally participate at lower rates, which is a composition change. The second effect is easy to miss.
A St. Louis Fed analysis of the decline from December 2025 through June 2026 split the move into three parts. It estimated that 43% came from the January 2026 population control revision, 16% came from ongoing aging, and 41% came from changes in participation within age groups. The analysis used CPS microdata and is a useful decomposition, not an official BLS cause estimate.
1. Population aging and retirement
Aging is the clearest long term force. Adults age 65 and older are much less likely to work or look for work than adults in their prime working years. When older adults become a larger share of the population, the total participation rate can fall even if participation inside each age group does not change.
This is not the same as a weak job market. It can reflect normal retirement. Federal Reserve research has repeatedly found that aging has placed steady downward pressure on the total rate for years. The St. Louis Fed estimate for the first half of 2026 also found a meaningful aging effect.
2. Prime age participation
Prime age adults, ages 25 to 54, are useful because they are less affected by school and retirement. Their participation rate was 83.4% in July 2026, up from 83.3% in June and equal to July 2025.
This does not cancel the decline in the total rate, but it changes the meaning. A stable prime age rate suggests that much of the national drop is tied to population mix and older groups rather than a broad exit by core working age adults. It also makes prime age participation one of the best numbers to watch in coming reports.
3. Women, caregiving, and job flexibility
Women participation reshaped the U.S. labor market in the second half of the twentieth century. San Francisco Fed research estimates that trend participation for women rose 8.2 percentage points from 1976 through 2024, while the trend for men fell 10.1 points.
Care costs, school schedules, paid leave, and access to flexible work can affect whether parents and caregivers can take a job. Remote and flexible work may help some people stay attached to work, but the effect is not the same for every occupation. Jobs that require physical presence offer less choice.
4. Youth schooling
Teen participation is far below its postwar level. July 2026 participation for ages 16 to 19 was 34.9%. In January 1948 it was above 50%. One major reason is more time spent in education and a different mix of school and work.
Lower youth participation is not automatically a problem. Time in school can build skills and future earnings. The key question is whether young people are gaining education or training, or are disconnected from both school and work.
5. Health and disability
Health limits can keep people out of work, especially in jobs that are physically demanding or hard to adjust. Disability, chronic illness, mental health, and access to care can all affect work decisions.
These forces are hard to read from the headline rate alone. A strong analysis should compare health data with age, occupation, disability status, and local labor demand before claiming a single cause.
6. Immigration and working age population growth
Immigration affects the size and age mix of the U.S. workforce. Many immigrants arrive during working ages, so changes in migration can alter labor force growth even if the participation rate inside groups is steady.
Federal Reserve research in April 2026 said labor force growth could be near zero because population growth had slowed, in part from lower net immigration, while aging was also lowering participation. This matters because an economy with very slow labor force growth needs less job growth to keep unemployment steady.
7. Wages, job openings, and the business cycle
People are more likely to enter or stay in the labor force when jobs are plentiful, pay is attractive, and hiring is fast. The reverse can happen when job finding becomes harder. Some people may stop searching if they believe suitable jobs are not available.
Still, discouraged workers were 476,000 in July 2026, little changed from June. BLS also counted about 5.9 million people outside the labor force who wanted a job. These groups matter, but they are not large enough by themselves to explain every long run move in participation.
8. Taxes, benefits, and retirement rules
Public policy can shape work incentives at the margin. Taxes, child care support, health coverage, disability rules, Social Security rules, and retirement plan design can affect when people work and when they retire.
The direction is not always simple. A benefit can reduce the need to work for some people, while support for child care or health coverage can make work possible for others. Good analysis needs policy specific evidence rather than a broad claim.
Main Drivers at a Glance
| Driver | How it works | Likely direction | Groups affected | Time frame | Best source |
|---|---|---|---|---|---|
| Population aging and retirement | A larger share of adults is in older groups that work at lower rates. | Usually lowers the total rate | Older adults and the total population | Long term | BLS, Federal Reserve |
| Prime age participation | Changes among ages 25 to 54 can move labor supply even when demographics are stable. | Can raise or lower the rate | Core working age adults | Short and long term | BLS CPS |
| Women, care, and job flexibility | Care costs, schedules, paid leave, and flexible work can affect whether people can take jobs. | Depends on access and job quality | Women, parents, caregivers | Short and long term | BLS, Federal Reserve research |
| Youth schooling | More time in school can reduce work while building skills for later years. | Often lowers youth participation | Age 16 to 24 | Long term | BLS CPS |
| Health and disability | Health limits can reduce work or job search, especially in physically demanding jobs. | Usually lowers participation | Prime age and older adults | Short and long term | BLS, Census, research studies |
| Immigration and population growth | Migration changes the size and age mix of the working age population. | Depends on age mix and employment | Working age population | Short and long term | Census, Federal Reserve |
| Wages and job opportunities | Better pay and easier hiring can draw some people into work or active search. | Often raises participation | People near the labor force margin | Short term | BLS, JOLTS, wage data |
| Taxes and benefit rules | Work incentives can change when taxes, benefits, retirement rules, or care support change. | Depends on policy design | Parents, older adults, lower income households | Long term | CBO, research studies |
Why Changes in Participation Matter
Participation is not just a labor market statistic. It affects how much labor the economy can use, how firms hire, how families earn income, and how fast the economy can grow without running into supply limits.
The Federal Reserve noted in April 2026 that labor force growth could be near zero. If that happens, potential GDP growth would have to rely much more on productivity because there would be little growth in the number of available workers. That is a major shift from earlier decades, when population and labor force growth supplied a larger part of economic expansion.
A lower participation rate can also make hiring harder when business demand is strong. Employers may raise pay, improve schedules, invest in training, or use more technology. But the wage effect is not automatic. If participation falls because job demand is weak, wage pressure may stay soft.
The same caution applies to inflation. A smaller labor pool can add supply pressure when spending remains strong, but inflation depends on many forces, including productivity, demand, energy, housing, supply chains, and expectations. The Federal Reserve does not set policy from participation alone.
For households, more participation can raise earned income and support living standards. Yet a lower rate can be reasonable when people retire, care for family, or study. The quality of the choice matters as much as the direction of the rate.
For public finances, a broad worker base supports income and payroll tax revenue. An aging population can reduce the worker share while increasing demand for retirement and health programs. This link makes labor supply important for long range budget planning.
For businesses, participation shapes recruiting plans, location choices, wage budgets, automation, and capital spending. A national rate is a useful signal, but firms should also study their own region, industry, skill needs, and worker age mix.
| Area | When participation rises | When participation falls | Important caution |
|---|---|---|---|
| Potential growth | More available workers can support more sustainable output. | A smaller labor pool can slow potential output growth. | Productivity and hours also matter. |
| Hiring and labor shortages | A deeper worker pool can ease recruiting pressure. | Some employers may face a tighter pool of applicants. | Demand for workers may also be weak. |
| Wages | More supply can reduce some hiring pressure. | Scarce labor can support faster wage gains when demand is strong. | Wages also depend on productivity, skills, and bargaining conditions. |
| Inflation and monetary policy | More labor supply can help the economy meet demand with less pressure. | Tight supply can add pressure if demand stays strong. | Participation alone does not determine inflation. |
| Household income | More work can raise total earned income. | Less work can reduce income for some households. | Retirement or schooling can be a chosen and useful outcome. |
| Tax revenue and public programs | More earnings can support a wider tax base. | A smaller worker share can raise fiscal pressure as the population ages. | Tax rules and benefit design matter. |
| Reading unemployment | A rising rate can bring job seekers back even before all find work. | A falling rate can make unemployment look lower if people stop searching. | Always read both rates together. |
| Business planning | More labor supply can support expansion and staffing. | Firms may invest more in training, technology, or labor saving equipment. | Industry and region can differ a lot. |
Labor Force Participation Rate vs Unemployment Rate
The participation rate asks how many eligible adults are in the labor force. The unemployment rate asks how many people in the labor force are jobless, available, and actively looking for work. Because the denominators are different, the two rates can move in opposite directions.
Consider 100 adults. Suppose 57 have jobs and 3 are unemployed and actively searching. The labor force is 60, so the participation rate is 60%. The unemployment rate is 5% because 3 of the 60 people in the labor force are unemployed.
Now suppose two of the three unemployed people stop searching. Employment is still 57, but the labor force falls to 58 and only one person is counted as unemployed. Participation falls to 58%, while unemployment falls to about 1.7%. No new job was created. This is why a lower unemployment rate is not always a full picture of improvement.
Who Is Participating in 2026?
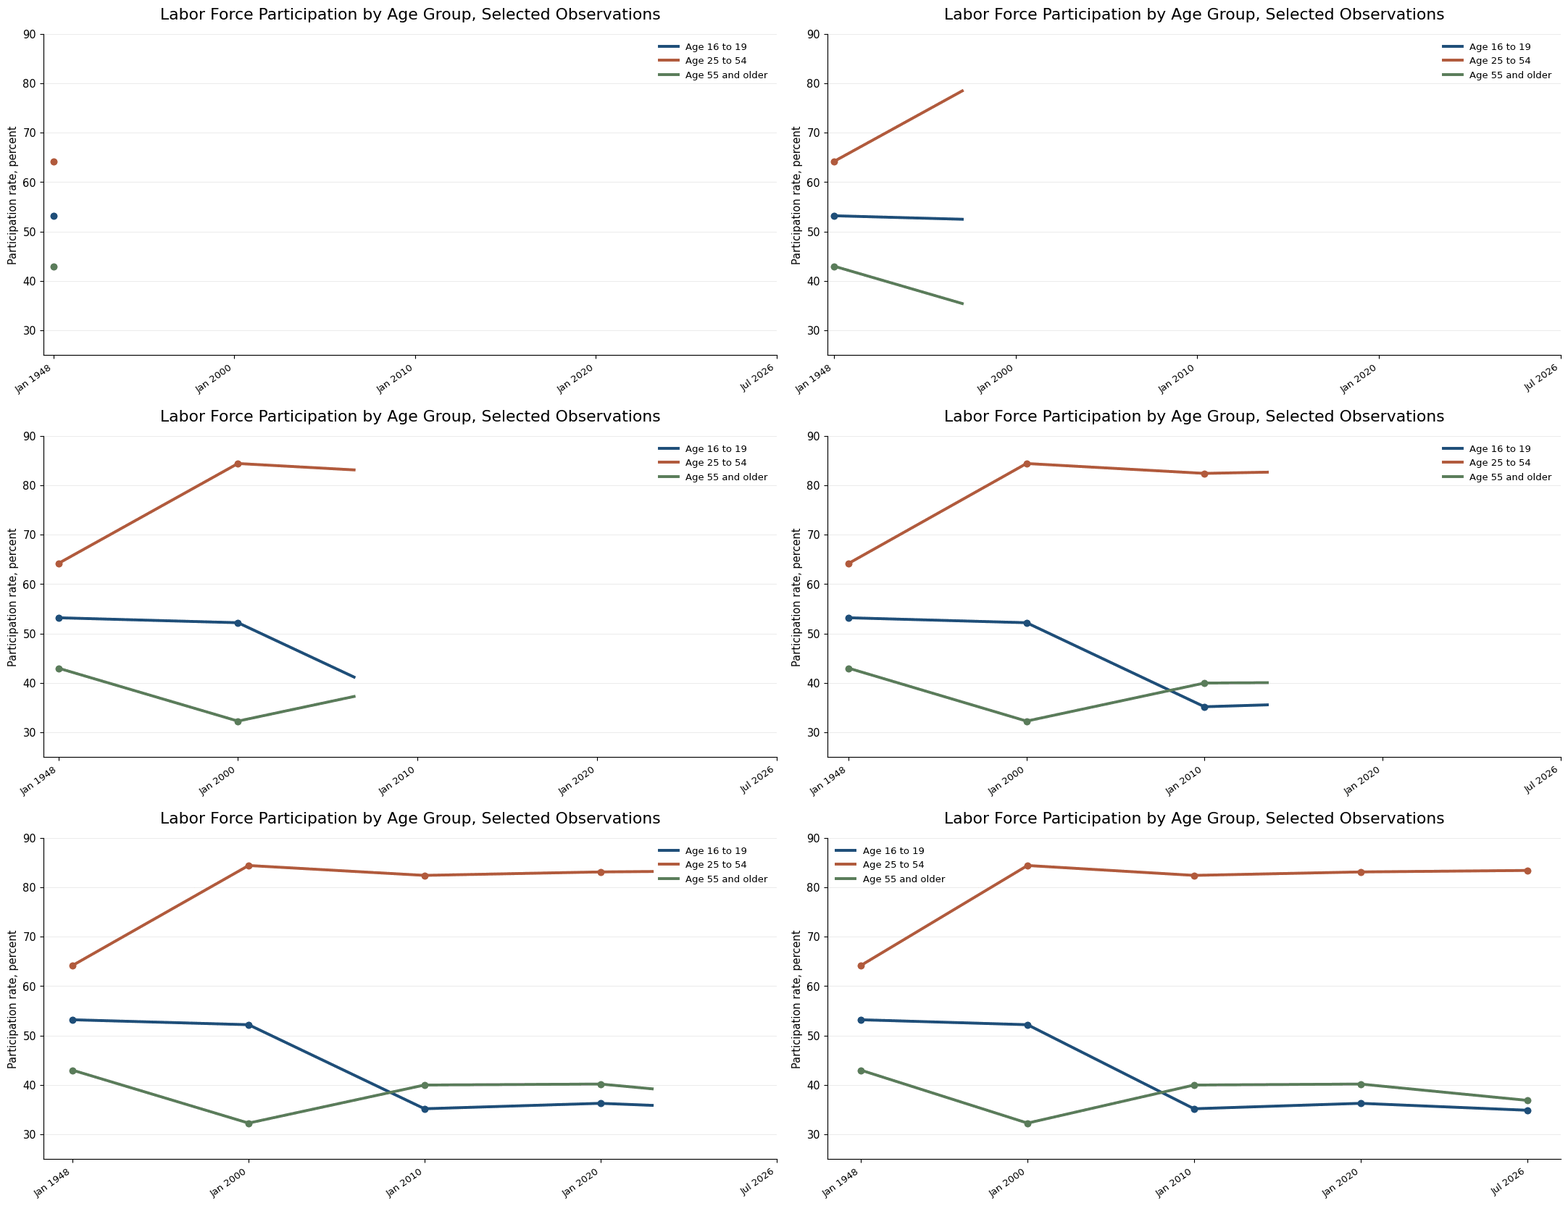
Age is one of the biggest differences. In July 2026, the participation rate was 34.9% for ages 16 to 19, 83.4% for ages 25 to 54, and 36.9% for ages 55 and older. These gaps explain why a change in the age mix can move the total rate even when behavior inside each group is stable.
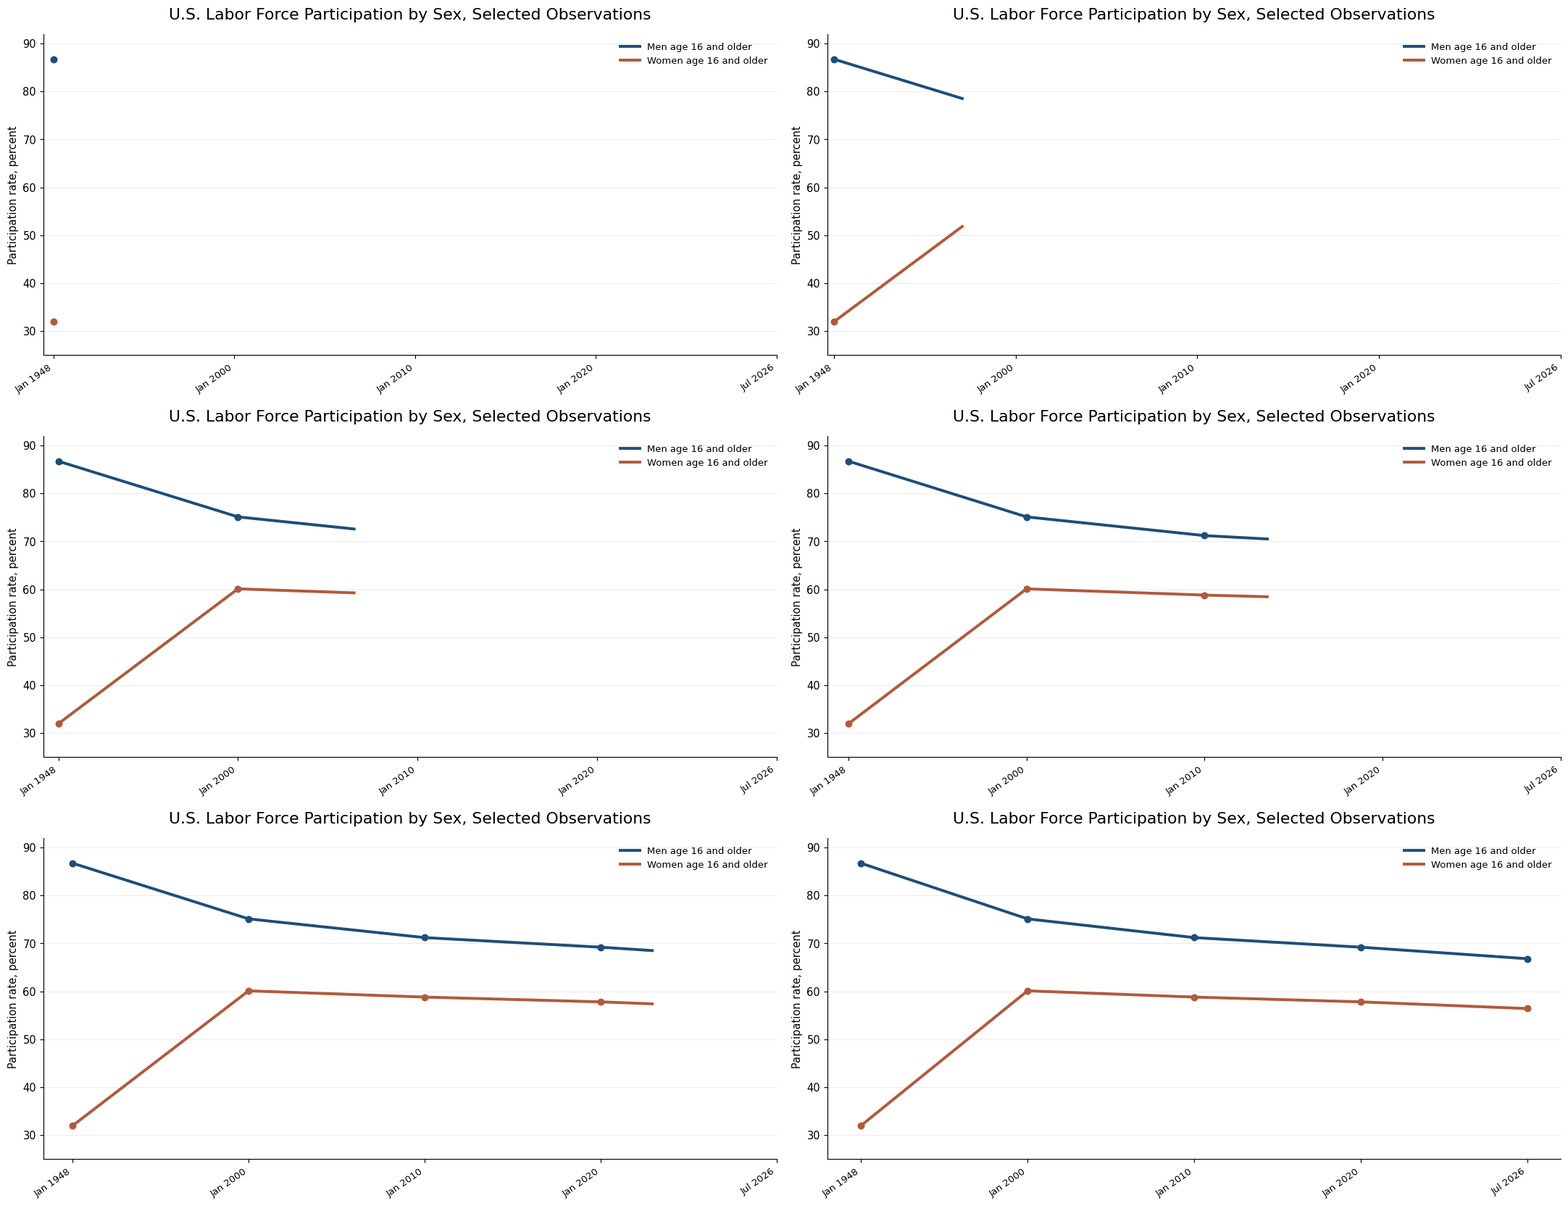
Sex also matters. The July 2026 rate was 66.8% for men age 16 and older and 56.4% for women. Among prime age adults, the rates were 89.2% for men and 77.8% for women. The gap remains, but the long run history shows far more convergence than in 1948, when the overall rates were 86.7% for men and 32.0% for women.
Race, education, disability status, family structure, and geography can add more detail. They are useful when a question calls for them, but the national headline should not be overloaded with subgroup comparisons that do not change the main finding.
Labor Force Participation by Age Group
| Date | Age 16 to 19 | Age 25 to 54 | Age 55 and older |
|---|---|---|---|
| Jan 1948 | 53.2% | 64.2% | 43.0% |
| Jan 2000 | 52.2% | 84.4% | 32.3% |
| Jan 2010 | 35.2% | 82.4% | 40.0% |
| Jan 2020 | 36.3% | 83.1% | 40.2% |
| Jul 2026 | 34.9% | 83.4% | 36.9% |
Source: U.S. Bureau of Labor Statistics Current Population Survey, seasonally adjusted.
Labor Force Participation by Sex
| Date | Men age 16 and older | Women age 16 and older |
|---|---|---|
| Jan 1948 | 86.7% | 32.0% |
| Jan 2000 | 75.1% | 60.1% |
| Jan 2010 | 71.2% | 58.8% |
| Jan 2020 | 69.2% | 57.8% |
| Jul 2026 | 66.8% | 56.4% |
Source: U.S. Bureau of Labor Statistics Current Population Survey, seasonally adjusted.
How to Analyze the Labor Force Participation Rate Step by Step
You can analyze this topic with a spreadsheet, a notebook, or a simple script. The important part is the order of the work. Start with the question, use official data, compare the right groups, test the size of the change, and only then explain what may be driving it. The steps below use U.S. Bureau of Labor Statistics data and the same logic used in this article.
Step 1. Start with a clear question
Decide what you want the data to answer before you download anything. A useful question might be whether the national participation rate is falling because core working age adults are leaving the labor force, or because the population is getting older. Another question might be whether a lower participation rate is making it harder for employers to hire. A clear question keeps the analysis focused and helps you choose the right comparison groups.
Step 2. Collect the core BLS series
Use the Current Population Survey as the main source. Start with the total participation rate, then add prime age participation, men, women, unemployment, and the employment population ratio. The total rate shows the headline. Prime age data help remove some of the effect of school and retirement. The other measures show whether the change is broad or concentrated.
Core BLS Series for a Reproducible Analysis
| Measure | BLS series ID | Why it matters |
|---|---|---|
| Total participation rate | LNS11300000 | Headline share of adults working or actively looking |
| Prime age participation, age 25 to 54 | LNS11300060 | Core working age labor supply |
| Men participation | LNS11300001 | Long run and current male participation |
| Women participation | LNS11300002 | Long run and current female participation |
| Unemployment rate | LNS14000000 | Joblessness among people in the labor force |
| Employment population ratio | LNS12300000 | Share of the eligible population that is employed |
For a quick recent analysis, the BLS Public Data API can return published time series data in JSON. For a longer custom history, use BLS API version 2 or download the series from BLS or FRED. BLS documents both GET and POST methods for the public API.
Step 3. Keep the data consistent
Use the same frequency and seasonal adjustment when you compare series. Monthly seasonally adjusted data are usually the easiest choice for national trend analysis. Do not compare a seasonally adjusted rate with a not seasonally adjusted rate unless you clearly explain why. Also record the release date, because labor data are updated on a schedule and some series can be revised.
Step 4. Calculate the changes that matter
Do not stop at the latest level. Calculate the change from the previous month, the change from six months earlier, and the change from one year earlier. For the July 2026 headline rate, the monthly change was negative 0.1 percentage point, the change since January was negative 0.7 point, and the change from July 2025 was negative 0.8 point. Longer comparisons help separate a trend from normal monthly noise.
Use these simple calculations:
- Monthly change = current rate minus previous month rate
- Six month change = current rate minus the rate six months earlier
- Year over year change = current rate minus the rate twelve months earlier
- Prime age gap = prime age participation minus total participation
Step 5. Check statistical significance
A small monthly move can look important in a chart even when it is not statistically meaningful. BLS publishes significance guidance for Current Population Survey estimates. Check it before writing that a one month change proves the labor market is weakening or strengthening. In July 2026, the one month participation change was not statistically significant, while the six month and twelve month declines were significant.
Step 6. Compare the headline with prime age participation
This is one of the most useful checks. Prime age participation covers adults age 25 to 54. It is less affected by teenagers staying in school and older adults retiring. If the total rate falls while the prime age rate stays firm, demographics may be doing more of the work. In July 2026, the total rate was 61.4 percent while prime age participation was 83.4 percent and unchanged from a year earlier.
Step 7. Break the rate into groups
Next, compare age and sex groups. Look at teenagers, prime age adults, older adults, men, and women. This shows where the movement is coming from. A falling total rate can hide a strong prime age rate if the share of older adults is rising. It can also hide different trends for men and women. Group analysis makes the story more accurate and more useful.
Step 8. Read participation with unemployment and employment
Participation cannot tell you by itself whether the labor market is healthy. Add the unemployment rate and the employment population ratio. If unemployment falls while participation also falls, some of the improvement may come from people leaving active job search. If participation rises and unemployment rises at the same time, more people may be entering the labor force before they find jobs. The employment population ratio helps show whether a larger or smaller share of the population is actually working.
A Simple Interpretation Matrix
| Signal | What to investigate |
|---|---|
| Total rate falls, prime age rate is stable | Demographics and retirement may be more important than broad prime age withdrawal. |
| Total rate and prime age rate both fall | Look more closely for weaker labor supply among core working age adults. |
| Unemployment falls and participation falls | The lower unemployment rate may partly reflect fewer people searching for work. |
| Unemployment rises and participation rises | More people may be entering the labor force before finding jobs. |
| Employment population ratio falls too | Employment is weakening relative to the population, not only active job search. |
| People outside the labor force who want a job rise | Unused labor supply may be increasing outside the unemployment measure. |
Step 9. Check people outside the labor force
BLS also reports people who are outside the labor force but say they want a job. This group is not counted as unemployed because they are not actively searching under the survey definition. A rising number can point to unused labor supply that the unemployment rate misses. A falling number can mean fewer people are close to reentering, although the reason still needs context.
Step 10. Add demographic and population context
January can be especially important because BLS introduces updated population controls. These changes can create breaks in labor force levels and can affect aggregate rates. Also check population aging, retirement, and working age population growth. In 2026, Federal Reserve research found that aging and the January population control revision explained more than half of the measured decline through June. That is a much different story from saying that the same share represents discouraged workers.
Step 11. Build charts that answer one question each
A useful chart should make one point clear. Use a long run line chart for the national trend. Use a second chart for total participation and prime age participation. Use separate lines for men and women when studying sex differences. For a current update, add a recent monthly chart covering about twelve to twenty four months. Keep the source and date visible, and place the underlying values in a normal table so readers can check the numbers.
Python Code: Reproduce the Full Analysis
Run the blocks below from top to bottom. Together they pull the official BLS series used in this tutorial, build a clean monthly data set, calculate the main changes, create the comparison charts, and save the results. The code is written for readers who know basic Python and pandas.
1. Install the packages
Run this once before the analysis. If requests, pandas, and matplotlib are already installed, you can skip this step.
# In a terminal, run this once
python -m pip install requests pandas matplotlib

# In a Jupyter notebook, use this instead
# %pip install requests pandas matplotlib
2. Define the BLS series and download the data
This block pulls all six core series. It uses the public Version 1 API so a registration key is not required. Because unregistered requests are limited to ten years at a time, the function automatically downloads the history in ten year chunks.
import time
import requests
import pandas as pd
import matplotlib.pyplot as plt
from pathlib import Path

SERIES = {
    "Total participation rate": "LNS11300000",
    "Prime age participation": "LNS11300060",
    "Men participation": "LNS11300001",
    "Women participation": "LNS11300002",
    "Unemployment rate": "LNS14000000",
    "Employment population ratio": "LNS12300000",
}

API_URL = "https://api.bls.gov/publicAPI/v1/timeseries/data/"
START_YEAR = 1948
END_YEAR = 2026


def make_year_chunks(start_year, end_year, years_per_request=10):
    chunks = []
    current = start_year

    while current <= end_year:
        chunk_end = min(current + years_per_request - 1, end_year)
        chunks.append((current, chunk_end))
        current = chunk_end + 1

    return chunks


def fetch_bls_series(series_map, start_year, end_year):
    id_to_name = {
        series_id: name
        for name, series_id in series_map.items()
    }
    records = []

    for chunk_start, chunk_end in make_year_chunks(
        start_year,
        end_year,
    ):
        payload = {
            "seriesid": list(id_to_name.keys()),
            "startyear": str(chunk_start),
            "endyear": str(chunk_end),
        }

        response = requests.post(
            API_URL,
            json=payload,
            timeout=30,
        )
        response.raise_for_status()
        result = response.json()

        if result.get("status") != "REQUEST_SUCCEEDED":
            raise RuntimeError(result.get("message", "BLS request failed"))

        for series in result["Results"]["series"]:
            name = id_to_name[series["seriesID"]]

            for item in series["data"]:
                period = item["period"]
                if period < "M01" or period > "M12":
                    continue

                records.append({
                    "measure": name,
                    "series_id": series["seriesID"],
                    "year": int(item["year"]),
                    "month": int(period[1:]),
                    "value": float(item["value"]),
                })

        time.sleep(0.25)

    data = pd.DataFrame(records)
    data["date"] = pd.to_datetime({
        "year": data["year"],
        "month": data["month"],
        "day": 1,
    })

    return data.sort_values(["date", "measure"]).reset_index(drop=True)


long_data = fetch_bls_series(
    SERIES,
    START_YEAR,
    END_YEAR,
)
print(long_data.tail())
3. Put the series into one analysis table
The BLS response is in long format. Pivoting it creates one date index with one column for each measure. This makes comparisons much easier.
wide = long_data.pivot_table(
    index="date",
    columns="measure",
    values="value",
    aggfunc="last",
).sort_index()

latest_date = (
    wide["Total participation rate"]
    .dropna()
    .index.max()
)

print("Latest BLS month:", latest_date.strftime("%B %Y"))
print(wide.loc[latest_date].round(1))
4. Calculate the changes that matter
The next block calculates one month, six month, and twelve month moves. For rate series, report these as percentage point changes, not percent changes.
change_table = pd.DataFrame(index=SERIES.keys())
change_table["Latest"] = wide.loc[latest_date]

for periods, label in [
    (1, "1 month change"),
    (6, "6 month change"),
    (12, "12 month change"),
]:
    previous = wide.shift(periods).loc[latest_date]
    change_table[label] = wide.loc[latest_date] - previous

change_table = change_table.round(2)
print(change_table)

# These are percentage point changes because the series are rates.
5. Create the main charts
These charts match the core questions in the article. The first shows the long run headline trend. The second separates total participation from prime age participation. The third compares men and women. The fourth focuses on the latest twenty four months.
# Chart 1. Long run total participation rate
ax = wide["Total participation rate"].dropna().plot(
    figsize=(10, 5),
    title="U.S. Labor Force Participation Rate",
)
ax.set_xlabel("Date")
ax.set_ylabel("Percent")
ax.grid(True, alpha=0.25)
plt.tight_layout()
plt.show()

# Chart 2. Total rate compared with prime age participation
comparison = wide.loc[
    "2000":,
    ["Total participation rate", "Prime age participation"],
].dropna()

ax = comparison.plot(
    figsize=(10, 5),
    title="Total and Prime Age Participation",
)
ax.set_xlabel("Date")
ax.set_ylabel("Percent")
ax.grid(True, alpha=0.25)
plt.tight_layout()
plt.show()

# Chart 3. Men and women participation
sex_data = wide[
    ["Men participation", "Women participation"]
].dropna()

ax = sex_data.plot(
    figsize=(10, 5),
    title="Labor Force Participation by Sex",
)
ax.set_xlabel("Date")
ax.set_ylabel("Percent")
ax.grid(True, alpha=0.25)
plt.tight_layout()
plt.show()

# Chart 4. Recent 24 month view
recent = wide[
    ["Total participation rate", "Prime age participation"]
].dropna().tail(24)

ax = recent.plot(
    marker="o",
    figsize=(10, 5),
    title="Recent Participation Trend",
)
ax.set_xlabel("Date")
ax.set_ylabel("Percent")
ax.grid(True, alpha=0.25)
plt.tight_layout()
plt.show()
6. Export clean data for review or publishing
Save both the raw long table and the wide analysis table. This makes the work easier to audit and refresh after the next BLS release.
output_dir = Path("lfpr_analysis_output")
output_dir.mkdir(exist_ok=True)

long_data.to_csv(
    output_dir / "bls_labor_force_long.csv",
    index=False,
)
wide.to_csv(
    output_dir / "bls_labor_force_wide.csv"
)
change_table.to_csv(
    output_dir / "latest_change_table.csv"
)

print("Files saved in:", output_dir.resolve())
7. Add a simple interpretation check
This final block gives a basic reading of the total and prime age pattern. Treat it as a prompt for analysis, not as an automatic economic conclusion.
total_change = change_table.loc[
    "Total participation rate",
    "12 month change",
]
prime_change = change_table.loc[
    "Prime age participation",
    "12 month change",
]

if total_change < -0.2 and abs(prime_change) <= 0.2:
    message = (
        "The total rate fell while prime age participation was stable. "
        "Check aging, retirement, and population composition before "
        "calling the move a broad labor market exit."
    )
elif total_change < -0.2 and prime_change < -0.2:
    message = (
        "Both total and prime age participation fell. "
        "This can point to broader weakness, but confirm the pattern "
        "with unemployment, employment, and BLS significance tests."
    )
else:
    message = (
        "The latest pattern does not show a broad participation decline. "
        "Review subgroup data before drawing a strong conclusion."
    )

print(message)
Important: Python can calculate the size of a monthly or yearly move, but it cannot tell you by itself whether a survey change is statistically significant or why the change happened. Check the BLS significance tables and population control notes before making a strong claim. BLS Version 1 public access allows up to ten years per request, so the code above uses ten year chunks. Version 2 offers higher limits after registration.
API reference: U.S. Bureau of Labor Statistics Public Data API.
Step 12. Write the conclusion with limits
End by stating what the evidence supports and what it does not support. Separate observed facts from interpretation. For example, you can say the participation rate fell over the year and prime age participation was flat. You can also say demographic forces appear important when research supports that view. Do not claim that one factor caused the full move unless the evidence can isolate that cause. A careful conclusion is more credible than a dramatic one.
Common Analysis Mistakes to Avoid
Good labor market analysis is often about avoiding simple mistakes. Use this checklist before you publish a conclusion.
- Treating one monthly move as a trend.
- Ignoring BLS significance guidance.
- Using only the national headline and skipping prime age data.
- Confusing the participation rate with the unemployment rate.
- Mixing seasonally adjusted and not seasonally adjusted data without explanation.
- Ignoring January population control changes.
- Calling correlation a cause without supporting evidence.
- Updating the latest number but leaving old conclusions and chart labels in place.
A Fast Monthly Update Routine
When a new Employment Situation report arrives, update the total rate, prime age rate, unemployment rate, employment population ratio, men and women rates, and the count of people outside the labor force who want a job. Then recalculate the monthly, six month, and yearly changes. Check statistical significance, review any population control notes, redraw the recent charts, and rewrite the conclusion only after you know whether the new point changes the trend.
This process keeps the article useful over time. It also prevents a common SEO problem where a page changes the headline number but leaves old analysis underneath it.
What to Watch Next
First, watch prime age participation. A sustained decline among ages 25 to 54 would be more concerning than an aggregate decline caused mainly by aging. July 2026 showed a small rebound to 83.4%.
Second, watch the participation and employment rates for adults age 55 and older. Retirement and aging are slow forces, so several months and longer trend lines matter more than one report.
Third, watch the number of people outside the labor force who want a job. A clear rise can signal unused labor supply even when the unemployment rate looks low.
Fourth, watch population growth, immigration, and the annual January population controls. These can change the measured size and age mix of the population and can create a break in the series.
Fifth, read participation with the employment population ratio, unemployment, job openings, hiring, wages, and payroll growth. A labor market is a system. One rate rarely tells the full story.
What the Latest Data Suggest
The U.S. labor force participation rate is lower than it was a year ago, and the decline over several months is real enough to deserve attention. Still, the best reading is more balanced than a simple story about workers leaving the job market. Aging and a population revision explain a large share of the 2026 move, while prime age participation remains high by historical standards. The next step is to watch whether core working age participation weakens, whether older worker participation keeps falling, and whether slower population growth continues to limit labor force growth. Those signals will tell us more about the strength of U.S. labor supply than one monthly headline.
Frequently Asked Questions
What is the U.S. labor force participation rate in July 2026?
It is 61.4%, according to BLS. The rate was 61.5% in June 2026 and 62.2% in July 2025.
How is the labor force participation rate calculated?
Divide the number of people in the labor force by the civilian noninstitutional population age 16 and older, then multiply by 100.
Why is the labor force participation rate falling?
The recent decline reflects several forces. Population aging, the January 2026 population control revision, and changes in participation within age groups all played a role. Slower population growth and immigration can also reduce labor force growth.
Is a lower participation rate always bad?
No. A lower rate can reflect retirement, education, caregiving, or other choices. It is more concerning when people want work but cannot find a path into the labor market.
What is prime age labor force participation?
It is the participation rate for adults age 25 to 54. Analysts use it to reduce the direct effects of school and retirement on the total rate.
How is participation different from unemployment?
Participation measures who is working or actively looking for work as a share of the eligible population. Unemployment measures jobless active job seekers as a share of the labor force.
How often does BLS update the participation rate?
BLS updates the national rate each month in the Employment Situation report. The next report after July 2026 is scheduled for September 4, 2026.
How does immigration affect labor force participation?
Immigration can change both the size and the age mix of the working age population. Its effect on the participation rate depends on who arrives and how strongly those groups participate, while its effect on labor force growth can be large even when the rate changes little.
How can I analyze the labor force participation rate?
Start with the total BLS participation series, then compare prime age workers, men, women, unemployment, and the employment population ratio. Calculate monthly, six month, and year over year changes. Check BLS statistical significance, review January population control notes, and use subgroup charts before deciding what is driving the headline rate. The tutorial above gives a complete workflow and full Python code that downloads the core BLS series, calculates changes, builds charts, and exports the data.
Methodology and Data Note
Primary data come from the U.S. Bureau of Labor Statistics Current Population Survey. Monthly headline rates are seasonally adjusted unless stated otherwise. Population levels are subject to annual population control updates. The tutorial section uses the same source hierarchy and includes Python code to reproduce the core calculations with official BLS series.
The total participation series is BLS series LNS11300000. The analysis compares the total rate with prime age, youth, older worker, and sex series to separate composition from within group changes.
The 2026 decomposition cited here comes from a Federal Reserve Bank of St. Louis analysis of CPS microdata through June 2026. It is used to explain the measured decline, not as an official BLS causal finding.
Percentage rate changes are described in percentage points. Monthly moves are not treated as meaningful by themselves when BLS significance tests show they may reflect normal survey variation.
Data on this page were checked against sources available on August 21, 2026. The July 2026 Employment Situation was released on August 7, 2026.
Sources
- U.S. Bureau of Labor Statistics, Employment Situation, July 2026
- U.S. Bureau of Labor Statistics, Current Population Survey tables
- U.S. Bureau of Labor Statistics, statistical significance tests
- Federal Reserve Bank of St. Louis, what is behind the 2026 participation decline
- Board of Governors of the Federal Reserve System, labor force growth and potential GDP
- Federal Reserve Bank of San Francisco, participation trends across genders
- FRED, U.S. labor force participation rate series from BLS
- Congressional Budget Office, Budget and Economic Outlook 2026 to 2036
- U.S. Bureau of Labor Statistics, Public Data API documentation
Suggested Internal Links
- U.S. unemployment rate analysis
- Wage growth trends in the United States
- Regional Price Parities by State
- CPI Analysis Python Tutorial: Monthly Reproducible Inflation Analysis
Chart Alt Text
- Selected U.S. labor force participation rate observations from January 1948 through July 2026, showing a rise toward the 2000 peak, the April 2020 pandemic drop, recovery, and renewed decline in 2026.
- Labor force participation rates for ages 16 to 19, ages 25 to 54, and ages 55 and older at selected dates from 1948 through July 2026.
- Labor force participation rates for U.S. men and women age 16 and older at selected dates from 1948 through July 2026, showing a much smaller gender gap over time.
Primary keyword: labor force participation rate analysis. Data checked August 21, 2026. Latest BLS month: July 2026.
Downloads
Files attached to this article for your reference.